-
Paper Information
- Paper Submission
-
Journal Information
- About This Journal
- Editorial Board
- Current Issue
- Archive
- Author Guidelines
- Contact Us
International Journal of Agriculture and Forestry
p-ISSN: 2165-882X e-ISSN: 2165-8846
2018; 8(5): 176-185
doi:10.5923/j.ijaf.20180805.02

Analysis of Forest-Based Enterprises and Income Inequalities among Rural Households in South-Western Nigeria
 Abstract
 Reference
 Full-Text PDF
 Full-text HTML
Azeez F. A.1, Nosiru M. A.1, Kabir G. B.1, Amoo M. A.2
1Department of Agricultural Economics, Forestry Research Institute of Nigeria, Ibadan, Nigeria
2Department of Agricultural Technology, Federal College of Forestry, Ibadan, Nigeria
Correspondence to: Azeez F. A., Department of Agricultural Economics, Forestry Research Institute of Nigeria, Ibadan, Nigeria.
| Email: |  |
Copyright © 2018 The Author(s). Published by Scientific & Academic Publishing.
This work is licensed under the Creative Commons Attribution International License (CC BY).
http://creativecommons.org/licenses/by/4.0/

This study analyses economic importance of forest-based enterprises and income inequality among forest indigenous households in South-western Nigeria. Descriptive statistics, budgetary analysis and Gini coefficient decomposable technique were used to estimate income inequalities among forest entrepreneurs. For every N1000 invested on high income yielding forest-based Enterprises,  243 on the average was realized as profit while
  184 and
  125 on the average were realized as profit on middle income yielding and low income yielding forest-based Enterprises respectively. Forest-based enterprises are profitable ventures with higher market efficiency in South-western Nigeria having the average investment worth of
  127, 022 and profitability index of 0.192 on the aggregate. Also, aggregate income inequality for the region was 0.73 and engaging in diverse income sources would reduce income inequality. Finally, forest enterprises income is the most inequality decreasing business with a correlation coefficient of 0.72 followed by commerce income with a correlation coefficient of 0.91. Forest-based approaches, such as market development for forest products like wood, bush meat, wood crafts, furniture making and pole should be aided. Also, credit facilities should be made friendly accessible to local traders to boost their commerce particularly the low return forest based businesses while the economy-environment trade-offs of forest resources should be minimized.
Keywords: Forest-based enterprises, Forest income, Income inequality, Income source, Investment worth
Cite this paper: Azeez F. A., Nosiru M. A., Kabir G. B., Amoo M. A., Analysis of Forest-Based Enterprises and Income Inequalities among Rural Households in South-Western Nigeria, International Journal of Agriculture and Forestry, Vol. 8 No. 5, 2018, pp. 176-185. doi: 10.5923/j.ijaf.20180805.02.
Article Outline
1. Introduction
- Nigerian households are not just poor but suffering immensely from inequality in terms of assets, basic human needs as well as human capability deprivation including exposure to violence as well as pervasive insecurity (Holmes et al. 2012). There is no doubting the fact that income inequality is pervasive in most developing countries of the world including Nigeria (An Hodgson 2012). According to Euromonitor International (2011), Nigeria Gini index was found to fall within the range of 0.5 and 0.7 compare to some other countries with relatively impartial distributions such as Greece, Germany among others having their Gini index between 0.20 and 0.35. Further, Nigeria is among the thirty most unequal countries in the world with respect to income distribution, the poorest half of the population possesses not more than 10% of national wealth (Idowu et al. 2011; Council British 2012; Mbanasor et al. 2013, p. 200). Going by the UN Development Programme Report UNDP (2009), Nigeria inequality rose between 1985 and 2004 (from 0.43 to 0.49), although some say it had been declined in 1990 from 0.491 to 0.438 (Ortiz and Cummins 2011, p. 48) yet, it is still high. If inequality is used as a parameter to estimate the Nigeria‘s Human Development Index, the value falls considerably, from 0.423 to 0.246 (UNDP 2009). This declining Human Development Index value is a reflection of the rate of poverty orchestrated by a fast increasing population and an unfair distribution of income, whereby a larger percentage of Nigeria‘s wealth is concentrated in the hands of the most well-off people of not more than 20% of the population possessing about 65% of the national wealth (UNDP 2009). However, considering the natural endowment in Nigeria, forests have rescued majority of hopeless masses to reduce the inequality and contributed immensely to influence patterns of economic development, sustaining livelihoods, and promoting sustainable growth. Forest resources are prime constituent of the natural resource base of any community, region or country upon which the socio-economic well-being of the people of those communities depends most especially in Sub-Saharan Africa including Nigeria (Richardson et al. 2011, p. 3).Moreover, in assessing the role of timber and non-timber forest products for livelihood sustainability in most of developing countries, Richardson et al. (2011, p. 3) categorized forest uses into groups, including food, fuel, shelter, erosion control, and water conservation. The authors assessed the total amount of foods produced from trees, the wild foods gathered, and animals hunted from forests, and the forest resources used in generating non-farm income and wage employment and estimated that between 60 and 70% of the population in developing countries live and work near forested areas. Many households subsist in part by collecting leaves, roots, fruits and nuts from trees and other wild plants, and by hunting wild animals, fish, and insects for consumption and income generation. Many people living in and around forest reserves harvest a range of products from forests for sale, trade, or barter, such as wood for timber, fuel wood, roof thatching materials, construction poles, honey, mushroom, caterpillars, and medicinal plants (Richardson et al. 2011, p. 3). Furthermore, several studies have corroborated the important roles of forests to include income generation for welfare improvement. Yet, the challenges of disproportionate income distribution among rural households still remain unabated despite being opportune to explore variety of income sources through forest based enterprises (FAO 2011). Similarly, in spite of rising evidence about the importance of forest products in various dimensions and as the income diversification options and strategies of rural households, the roles of specific forest resource types still remain obscure (UNFF 2013). This lack of understanding does not only limit the ability of policy makers in efficiently allocating scarce forest resources, but also hinders their ability to accurately determine how many such allocation might impact vulnerable and poor rural communities (Paumgarten 2005). Therefore, there is an urgent need for better data on the specific contributions of forests income sources that reduce or increase disparity in income distribution among forest related entrepreneurs in order to assist governments and policymakers concerning the identification of the target groups that will enhance more equitable distribution of income among rural households and most especially for judicious allocation of resources among forest related entrepreneurs. Arising from above, some questions are needed to be asked about: various forest based enterprises that rural households are engaging in; most prominent forest based enterprises in the study area; the income sources that reduce or increase the disparity in income distribution and the effects of such income sources on forest related entrepreneurs in the study area. It is against this backdrop, the study seeks to investigate income inequality among forest–related enterprises with a view that such investigation would trigger opportunity to identify and improve on the distributional impacts of forest income on household welfare in South-western Nigeria. Specifically, the study sought to: ü profile the economic importance of various forests based enterprises that rural households engage in; ü determine which of the forest income sources reduces or increases income inequality and their effects on forest based entrepreneurs in the study site.
2. Materials and Methods
2.1. Study Area
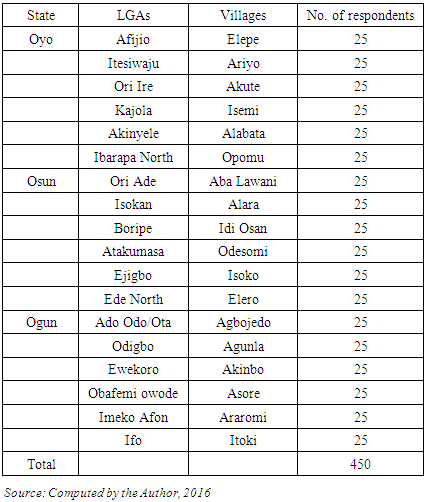
- This research work was carried out in South-western region of Nigeria. It is one of the six geo-political zones in the country (Agunwamba et al. 2009:8) [see Figure 1]. The area lies between longitude 30° and 7°E and latitude 4° and 9°N and thus, west of the lower Niger and south of the Niger Trough. South-west region includes Osun, Oyo, Ogun, Lagos, Ondo and Ekiti states. The total land area is about 191,843 square kilometers (Agunwamba et al. 2009, p. 8). Specifically, the study area where data were collected include: Ogun, Osun and Oyo States (Table 1).
|
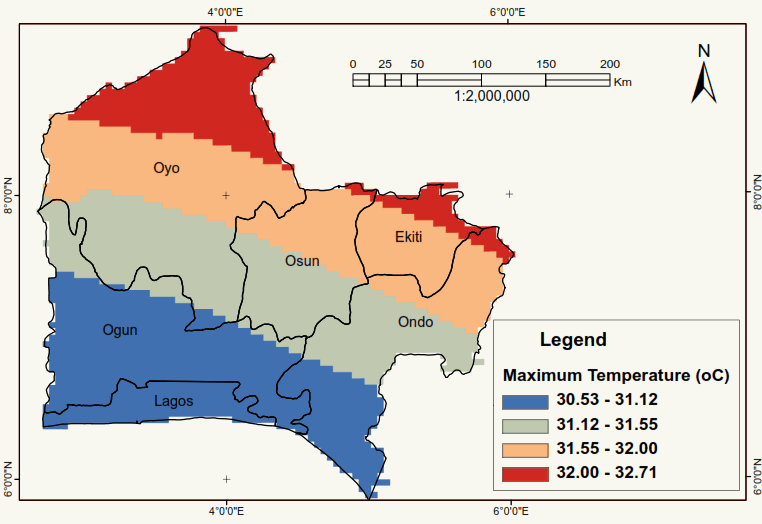 | Figure 1. Map of South-west Nigeria |
2.2. Sampling Frame and Procedure
- The sample frame for the study include rural household heads who engage in forest-based businesses such as plank trading, carpentry/furniture, basketry/mat/bag making, wood carving, rattan and bamboo utilization, rattan and bamboo utilization, charcoal production and selling, fuel wood collection and selling, chew stick, bush meat, snail, fish, fruits and vegetables, medicinal plants, gum and dye, broom, poles, locust bean, spices/ leaves and fibre, mushroom, honey, shea butter, local wine, local wine and farmers who practise agro-forestry system within and around the forest community. The questionnaire was structured to elicit information on individual basis about their involvement in various forest based enterprises with respect to their income. Focus Group Discussion (FGD) method was also adopted in this regard. A multi-stage random sampling approach was adopted in selecting the respondents for the study. At first stage, three states (Oyo, Ogun and Osun states) were randomly selected from the five states that make up the South-west geo-political zone of the country excluding Lagos state due to its cosmopolitan and less forested nature.In the second stage, six Local Government Areas (LGAs) in each of the three states (Table 1) were purposively chosen making eighteen LGAs in total (based on their potentials in forestry and their population size) while one forested village was randomly selected in each selected LGA, for a total of eighteen villages.In the third stage, twenty-five households were randomly selected from each village. A total of four hundred and fifty households' heads were interviewed in the eighteen selected villages (206 males and 243 females). Each respondent was interviewed separately and each interview lasted for about 1 hour. The exercise was carried out between December 2015 and April 2016.
2.3. Analytical Procedures
- Descriptive analysis using frequency distribution and percentage analysis was used to discern the respondents’ household characteristics and budgetary analysis was used to determine economic importance of various forest resources based enterprises that rural households engage in. Also, in determining the forest income sources that contribute to overall inequality in line with the second objective of this study, the Gini coefficient decomposable technique proposed by Lerman and Yitzhaki (1985) was adopted to reveal the contribution of each individual income source to overall income inequality as used by Adams (2001); McKay (2002) and Huang et al. (2005).
2.4. Model Specification
- In accordance with the set objectives of the study, the following models are specified:
2.4.1. Gross Margin
- GM %= TR-TC ÷ TR × 100Where GM= Gross Margin as a percentageTR=Total Revenue TC = Total Cost
2.4.2. Gini Coefficient Decomposable Technique
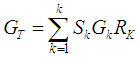
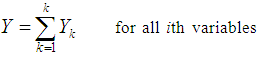
- This method involves the estimation of the overall Gini-coefficient of total income, which can be decomposed according to the various income sources. According to Shorrocks (1982), if Y is the total income and it consists of income from k sources, viz. y1, y2….… yk . Total income Y is thus given as:
 | (1) |
 | (2) |
 | (3) |
 | (4) |
 | (5) |
 | (6) |
3. Results and Discussion
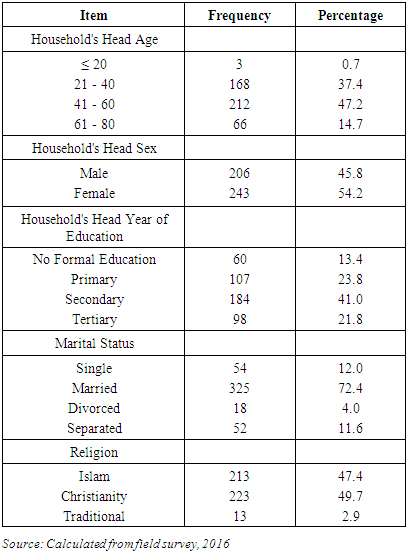
3.1. Socio-economic Characteristics of Sampled Rural Households
- The section presents the socio economic characteristics of the sampled forest based rural households (Table 2).
|
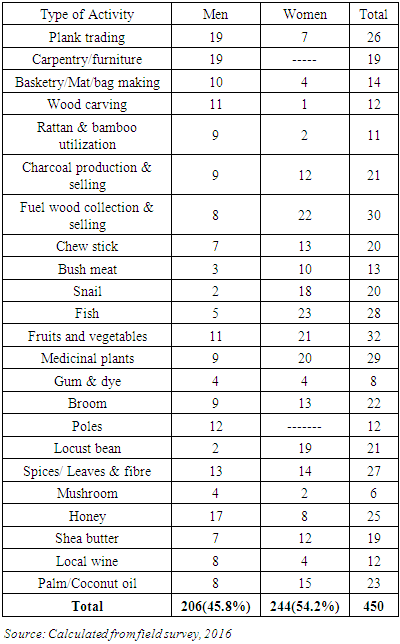
3.2. Forest- Based Enterprises (FBEs)
- Table 3 profiles most of the various forest- based enterprises that rural households employ in the study area as captured by this study. Although field experience reveals that some of the forest based entrepreneurs do combine several forest products for sales. For example, medicinal plants marketers offer a lot of Non Timber Forest Products (NTFPs) such as various plants roots, leaves, barks and seeds as traditional herbs and medicine; snails; insects and animals, honey among others. Table 3 thus presents the descriptive statistics for the sampled forest based enterprises.
|
3.3. Rate of Economic Importance of Sampled Forest-based Enterprises
- This study considers average investment worth per person and the corresponding profitability indices (PI) of various forest based enterprises for easy determination of the level of households' subsistence income. Essentially, FBEs were categorized based on their rate of return on investment and their respective PI into high income yielding (HIY ≥ 0.200 PI), middle income yielding (MIY ≥ 0.150 PI) and low income yielding (LIY ≤ 0.150 PI) enterprises. Table 4 thus presents the profile the economic prominence of various forest based enterprises of sample households.
|
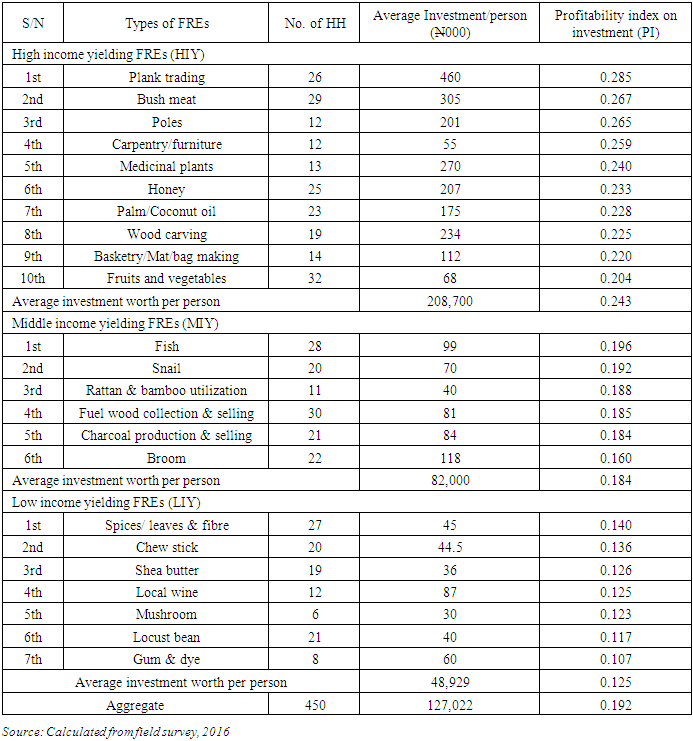
 1000 invested on high income yielding FBEs,
  243 on the average was realized as profit while
  184 and
  125 on the average were realized as profit on middle income yielding and low income yielding FBEs respectively. On the aggregate, the average investment worth for the region was
  127, 022 while its profitability index was 0.192. Thus, FBEs are profitable ventures with higher market efficiency in South-western Nigeria (see Okunmadewa et al. 2000; Azeez et al. 2011 & 2015, Alao and Kuje, 2012; Awe and Rufus 2012).Similarly, in terms of income yielding propensity, plank trading, bush meat, poles, carpentry/furniture, medicinal plants, honey, palm/coconut oil, wood carving, basketry/mat/bag making and fruits and vegetables belong to HIY enterprises.The MIY enterprises include: fish selling, snail collection and selling, rattan & bamboo utilization, fuel wood collection & selling and broom marketing. Also, LIY enterprises are: Spices/ leaves & fibre, chew stick, shea butter, local wine, mushroom, locust bean and gum & dye enterprises in that order.Among the high income yielding enterprises, plank business (0.285 PI) was the most lucrative and worthwhile venture among all FBEs in the region since it has recorded highest profitability index. One of the reasons for this might be due to the fact that planks are produced in different dimensions that are priced differently in the market. For instance, industrial round wood, sawn wood, and wood panels and several bye products such as fire wood, saw dust etc. are obtainable from the plank business and might be an additional advantage for the entrepreneurs. So, this suggests that timber processing business in form of plank has certain anti-poor characteristics than other forest based enterprises in the region. Another possible justification for the lucrativeness of plank business is that some poor are denied access to timber wealth mainly because of its high investment worth which might be too exorbitant for the poor to venture into. Essentially, plank processing and sales even at small and medium-scale level require relatively much capital, technology, and skills mostly for fairly specialised consumer markets (Williams 2003). The second most prominent and lucrative business in the study site is bush meat (0.267 PI). Some of the likely explanations that can be advanced for this outcome might be due to the fact that bush meat attracts high price as it is mostly cherished by the rich people who often patronize the bust meat marketers. Likewise, many other people prefer eating bush meat because of its attendant nutritional values considering it as sources of both calories and proteins (Adams et al. 2009; Adams and Piperata 2014).Furthermore, other prominent and lucrative FBEs include; poles (0.265 PI), carpentry/furniture (0.259 PI), medicinal plants (0.240 PI) among others in that order. These HIY enterprises can be undertaken at small and medium scale levels. According to Alao and Kuje (2012), the viability of small and medium scale forest enterprises (SMFEs) like furniture industries is very enduring based on their findings on economies of small-scale of furniture production in some part of northern Nigeria. Conversely still, engaging in some businesses such as gum (0.107 PI), locust bean (0.117 PI), mushroom (0.123 PI) local wine marketing (0.125 PI) and shea butter (0.126PI) might not be considered worthwhile to be singularly undertaken in the region unless they were being combined with other lucrative ones to boost their sales just as the case for the medicinal plants sellers as earlier noted. Arising from the above, there are two perspectives providing evidences for engaging in FBEs relative to its potentials to household subsistence. First is the fact that returns from some FBEs are high and capable of improving the household well-being. This argument is in line with the view of Neumann and Hirsch (2000) who posited that trading of medicinal and aromatic plants (MAPs) in the Gorkha District, Nepal; harvesting of tagua in Ecuador and the emergence of basket making for tourist and export markets in southern Africa are economically viable to undertake because they all yielded high returns. On the other hand, some FBEs yield very low returns and could not substantially cater for the living of the households. For instance, some NTFPs harvested for sale in Port city of Belém yielded a very low remuneration and rattan harvest in Central Kalimantan; Indonesia suffered high return due to low encouragement (Neumann and Hirsch 2000). In sum, while being mindful of the high economic returns from some FBEs, conscious attention should be given to the environmental implications of harvesting these forest resources in order to sustain the balance of ecosystem in the region. However, that is not to say that those low return ones should be wrecked or neglected. Instead, more incentives are required to their marketers so as to boost their respective businesses.
3.4. Forest Income Inequality
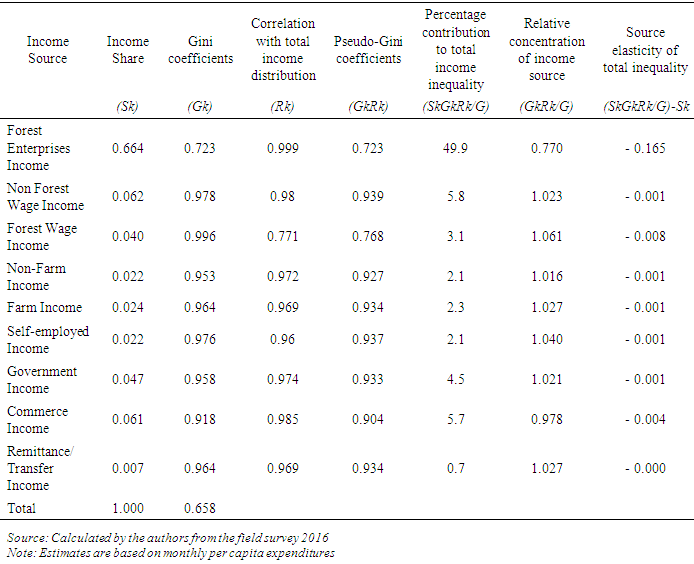
- This paper analyses overall income inequality among rural households in South-western region of Nigeria and how individual income sources contribute to the observed inequality (Table 5). For this purpose, the study used the Gini decomposition method, which allows the decomposition of the overall Gini coefficient into different components. The decomposition of income inequality by various income sources makes it possible to find out whether forest source plays any important role to improve income distributional pattern among these forest fringe households.The aggregate income inequality of 0.66 for the region is higher than what was reported in most literature. For instance, Olaniyan and Awoyemi (2005) reported Gini coefficient of 0.52 while Oyekale et al. (2006) reported the same 0.52 for the South-west region. This implies that there is about 14% increase in inequality of the region rural households within a period of a decade. Although, one possible source of discrepancy might be measurement error in the household survey data, e.g. inclusion of information on home consumed forest products among others. It is also possible that the authors' estimate was based on a measure of income that did not include forest resources. Similarly, considering the mean of all income sources inequalities which is 0.93, it equally suggests that the level of inequality among all income sources in the sample is on the high side. The implication of this is that there is a great deal of social variation in income distribution – between and within the rural households in the region. As revealed in Table 5, income sources with a relative concentration coefficient that is greater than one contribute to increasing total inequality, but those income sources with a relative concentration coefficient that is less than one contribute to decreasing total inequality for the region, indicating that engaging in diverse income sources would reduce income inequality across the sample. However, not all income sources reduce income inequality.
|
4. Conclusions
- This paper analysed the economic importance of forest-based enterprises and the disparity in income of forest households in South-western region in Nigeria. The data indicates that for every
 1000 invested on high income yielding FBEs,
  243 on the average was realized as profit while
  184 and
  125 on the average were realized as profit on middle income yielding and low income yielding FBEs respectively. FBEs are profitable ventures with higher market efficiency in South-western Nigeria having the average investment worth of
  127, 022 and profitability index of 0.192 on the aggregate. Similarly, in terms of income yielding propensity, plank trading, bush meat, poles, carpentry/furniture, medicinal plants, honey, palm/coconut oil, wood carving, basketry/mat/bag making and fruits and vegetables belong to HIY enterprises. The MIY enterprises include: fish selling, snail collection and selling, rattan & bamboo utilization, fuel wood collection & selling and broom marketing. Also, LIY enterprises are: Spices/ leaves & fibre, chew stick, shea butter, local wine, mushroom, locust bean and gum & dye enterprises.These findings thus suggest two perspectives for engaging in FBEs relative to its potentials to household subsistence. First is the fact that returns from some FBEs are high and capable of improving the households’ well-being. On the other hand, some FBEs yield very low returns and could not substantially cater for the livelihood of the households.The study also concluded that the aggregate income inequality for the region is 0.73 and that engaging in diverse income sources would reduce income inequality across the sample. However, in terms of contribution of individual income sources to the observed inequality – forest enterprises income correlated mostly with total households’ income having a correlation coefficient of 0.72 followed by commerce income with a correlation coefficient of (0.91). Alternatively, non-forest wage income, forest informal employment income, other self-employed income, government income, farm income and remittance transfer income increase total inequality.
5. Recommendations
- The fact that forest based enterprises particularly those high income yielding and middle income yielding ones may have a role in poverty mitigation in South-western Nigeria, the entrepreneurs of the FBEs should be motivated through policies that would liberalize open access to the forest resources. Although, careful implementation and a mix of forest-based approaches to poverty mitigation (such as selective exploration, forest regeneration, market access, micro lending opportunity among others) are necessary in this regard.Further, efforts to conserve the region's forests are important but should not be too rigid so as to reduce the burden of such households who depend primarily on forest resources to make their income. Therefore, a more effective pro-poor and pro-forest strategies may be one that assists the poor in diversifying the sources of income to maintain the balance. Towards this end, public investment in the (non-forest) wage-work and self-employment sectors may be warranted.On the other hand, those less prominent and less lucrative FBEs such as spices/ leaves and fibre, chew stick, shea butter, local wine, mushroom, locust bean and gum and dye sellers can also be assisted through provision of credit access to lift them up in their respective businesses.The study suggests that there is high degree of inequality among rural households in the region and that forest based enterprises and commerce incomes are the only sources of income that has the capacity to reduce the disparity in income distribution gap. Therefore, forest-based approaches, such as market development for forest products like wood, bush meat, wood crafts, furniture making and pole should be aided. Such approaches can increase local incentives to sustainably manage forest resources on which enterprises depend. But careful implementation is necessary, because the rise in value of forest products may stimulate over-harvesting of resources as explained by (Neumann and Hirsch 2000). Also, credit facilities should be made friendly accessible to local traders to boost their commerce particularly the low return forest related businesses while the economy-environment tradeoffs of forest resources should be minimized.
ACKNOWLEDGEMENTS
- The authors thank University of Fort Hare South Africa and Forestry Research Institute of Nigeria (FRIN) for the opportunity given to the authors to conduct this study.