-
Paper Information
- Paper Submission
-
Journal Information
- About This Journal
- Editorial Board
- Current Issue
- Archive
- Author Guidelines
- Contact Us
International Journal of Agriculture and Forestry
p-ISSN: 2165-882X e-ISSN: 2165-8846
2018; 8(3): 129-138
doi:10.5923/j.ijaf.20180803.03

Influence of Social Capital on the Use of Improved Maize Seed among Farmers in Southwestern Nigeria
 Abstract
 Reference
 Full-Text PDF
 Full-text HTML
Komolafe J. O. , Adeoti I. A.
Department of Agricultural Economics, University of Ibadan, Ibadan, Nigeria
Correspondence to: Komolafe J. O. , Department of Agricultural Economics, University of Ibadan, Ibadan, Nigeria.
| Email: |  |
Copyright © 2018 The Author(s). Published by Scientific & Academic Publishing.
This work is licensed under the Creative Commons Attribution International License (CC BY).
http://creativecommons.org/licenses/by/4.0/

There has been a deficit in the national maize output due to low usage of Improved Maize Seed (IMS) among other factors. Social Capital (SC) has been identified as a potential instrument for adoption of improved seed. Although most farmers belong to Social Groups (SG), the contribution of SC in the use of improved seed has not been adequately documented. Thus, relationship between SC and usage of improved seed in southwestern Nigeria was examined. A four-stage sampling procedure was used. Osun and Oyo states were purposively selected based on their high maize production level. A total of seven Agricultural Development Programmes zones: three from Osun and four from Oyo states were randomly selected. One block was randomly selected from each selected zone. Twenty one cells were randomly selected proportionate to the size of the blocks in the states. In all, 386 farmers were randomly selected proportionate to size of the cell. Structured questionnaire was used to collect data on farmers’ characteristics, seed type, maize yield and social capital dimensions: Membership Density (MD), heterogeneity, Meeting Attendance (MA), Decision Making (DM), Cash Contribution (CC), Labour contribution (LC) and Aggregate Social Capital (ASC). Data were analysed using descriptive statistics and logit at α 0.05. Farmers belonged to an average of 3 societies and had DM index of 60.7±9.7. Meeting attendance was high (76.7±27.3), Heterogeneity index was 38.7±9.7, while monthly CC and LC to SG were ₦83.0±2.3 and 26.3±10.8 man-day per annum, respectively. The ASC was 41.9±1.1. Farmers’ group accounted for the highest proportion (26.6%), while recreational club (0.5%) and environmental protection/natural resources group (0.5%) accounted for the lowest proportion of farmers’ membership in SG. The main source of IMS was farmer association (33.2%), while the least source was certified farmers’ shop (2.8%). Marital status (β=1.85), output price (β=0.89), education (β=0.81), MD index (β=0.09), quantity of maize seed planted (β=0.04) and volume of loan accessed from SG (β=1.0x10⁻⁵) increased the likelihood of using IMS. Social capital influenced improved maize seed usage. Education, output price and meeting attendance increased farmers’ choice of improved maize seed, while membership in fewer social groups reduced it. Active participation in social groups is recommended to promote usage of improved maize seed.
Keywords: Social capital, Improved maize seed, Maize farmers
Cite this paper: Komolafe J. O. , Adeoti I. A. , Influence of Social Capital on the Use of Improved Maize Seed among Farmers in Southwestern Nigeria, International Journal of Agriculture and Forestry, Vol. 8 No. 3, 2018, pp. 129-138. doi: 10.5923/j.ijaf.20180803.03.
Article Outline
1. Introduction
- Maize is the second most important cereal crop in Nigeria, ranking behind sorghum in the number of people it feeds ([8] Enyisi, Umoh, Whong, Abdullahi and Alabi, 2014). Maize is a multipurpose crop, providing food and fuel for human beings and feed for animals (poultry and livestock). Its grain has great nutritional value and it is used as raw materials in flour mills, breweries, confectionaries and animal feed manufacturing firm. It is a very versatile crop since it is used for domestic consumption in addition to its industrial uses [2] Afzal, 2007.Current production is about 8 million tonnes; this quantity is far behind the national demand. Research shows that yield per hectare can be raised to about 4.2 tonnes from 1.5 tonnes. This suggests that national production could hit 20 million tonnes per annum if the recommendations (use of improved seed and other complimentary inputs) are scaled-up ([9] Fakorede, 1989; [28] Okoboi, Muwanga, and Mwebaze, 2012). Local production needed to be geared up to meet the demand for direct consumption, breweries, pharmaceutical companies, baby cereals, livestock feeds and other industries ([17] Iken and Amusan, 2004). Though maize is among the most important crops, there exist low usage of improved maize seed, inefficient marketing system, and low investments in research, among the factors that have limited its production in Nigeria. Seed is a basic and a critical input for agricultural production ([19] Kaliba, Hugo, and Wilfred, 2010). The recent achievements by breeders in development and release of superior maize varieties with higher yield potential and better resistance to insect, pests and diseases plays a central role in increasing maize production in Nigeria ([26] Obi, 1991; [17] Ikenand Amusan, 2004). This role will better be felt by increased use of these seeds. Despite the efforts of government and private seed industry, the availability of improved seed is still low. The constraints of farmers in accessing improved seed include high price of seed, unavailability at planting time, and little awareness in the rural community and poor rural road conditions ([4] Akulumuka, Nwakitwange and Ngowi, 2001; [23] Mcguire, and Sperling, 2016). Farmers’ usage of improved new technology, such as improved seed is a choice between traditional and new technology ([19] Kaliba, Hugo, and Wilfred, 2010). The use of improved agricultural technologies, such as inorganic fertilizers, pesticides, improved seed varieties, irrigation facilities and mechanical power is limited among farmers ([32] Saka, Okoruwa, Lawal, and Ajijola, 2005). Most of the production is rain fed with extremely low use of external inputs particularly among the poorest households. Adoption of new technology starts with awareness and then demand for and usage of new technology.Low usage of improved seed by farmers is due to constraints in both the supply and demand for seeds ([15] Hiroyuki and Salau, 2007). The constraints associated with supply were inadequate seed production facilities, scope of production and inadequate trained personnel for production, insufficient human capital and absence of equipment that affect timeliness of production of seed and grains. The constraints in demand are limited access to information, lack of credit, small and fragmented land holding, inadequate incentives associated with tenure arrangements, untimely supply of complementary inputs and inappropriate transportation infrastructure among others ([10] Feder, Just and Zilherman, 1985; [6] Bernard, Hellin, Nyika, and Mburu, 2010). While the constraints in supply have been studied, the constraints in demand have not been well understood ([25] Nimot, et al, 2007. Membership of farmers’ social groups is significantly correlated with the use of improved agricultural technologies ([5] Benedito, 2009). Seed delivery system to farmers falls under two categories: the formal (ADP, seed companies, agro dealers) and the informal (saved own seed, seed exchange, gift, borrowing and purchase from local markets), with a dominance of the informal system. About 10% of the seed needs of farmers are met by the formal seed system, while the remaining 90% emanated from the informal system ([21] Larinde, 1996 and [25] Nimot, et al, 2007). [4] Akulumuka, Nwakitwange and Ngowi, 2001; Mc Guire, and Sperling, (2016) asserted that to date, only 2-4% of farmers in rural areas can access IMS due to constraints like high cost, limited distribution awareness and associated risk.Numerous studies on the adoption of agricultural and other technologies have attempted to identify the determinants of technology adoption and potential barriers to it ([11] Foster and Rosenzweig, 2010). While the specific determinants of technology adoption depend upon the setting and the technology type, there are some common factors that have been identified both in the theoretical and empirical literature. These include education levels, wealth, tastes, risk preferences, complementary inputs (land, labour and credit) and access to information and learning – either learning by doing or learning from others. Of these, the role of information and SC has not received particular attention ([14] Heikkila, 2009; [3] Aker, 2010).There are twice as many farmers using improved seed among members of a farmers’ association than otherwise. [33] Silici (2011) identified three factors that are critical to the use of improved seeds. These are the economic incentives provided to vulnerable households in the very early stage of adoption, the level of education of the household head and the degree of trust and cooperation, especially when combined with participatory approach pursued by committed trainers. With regard to social capital (SC), the households which adopt improved seed are more trustworthy and cooperative than those that do not. This suggests that high endowment with social assets foster the use of the innovative practices ([33] Silici, 2001). However, achieving accelerated usage requires collective action on various fronts involving investment in SC. The role of SC is important for a farmer to use improved technology due to the fact that it enhances cooperation and collective action and facilitates extension and adaptive research through participatory activities [33] Silici (2011). As a means to support institutional agreements, avoid conflicts and foster community participation, SC would help to solve the problems related to the use of common pool resources to stimulate the use of improved technology in Africa ([7] Calegari and Ashbuner, 2005; [16] Husen, Loos and Siddig 2017). Nonetheless, people’s participation in social activity rarely happens spontaneously rather it involves the process of supporting people to gather information about their circumstances and resources, analyse the situation, prioritise actions they wish to purse, join together into group organization of their own choice and workout the means to implement these actions at a cost that poor farmers are not willing to pay ([34] Woolock, 2001; [16] Husen, Loos and Siddig 2017). This research therefore, examines the influence of SC on the use of IMS in south western Nigeria. Attention was also paid to assessing the dimensions of SC among maize farmers and disaggregated by socio-economic characteristics.
2. Materials and Methods
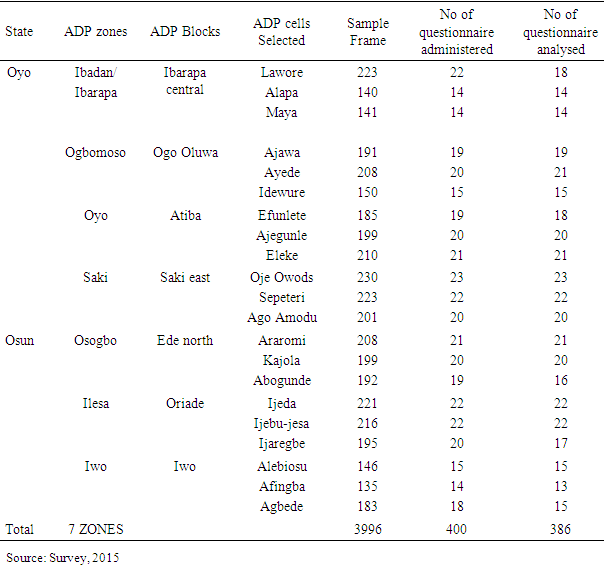
- The sampling frame for this study consists of maize farmers growing maize under mono-cropping systems in the South-western zone of Nigeria. This study adopted the State ADP sampling frame. A four-stage sampling procedure was used for this study. The first stage was the purposive selection of two states in southwest Nigeria because maize is a major and important cereal being cultivated. The selection of state was based on the maize production level ([31] Oyewo, 2011). Nigeria has been divided into low, medium, medium to high and high maize production potential groups by USAID ([27] Olaniyan, 2015). In southwest Nigeria, Osun State was classified as a state with medium potential, while Oyo State was put in the group of medium to high (Oyo). Second stage was the random selection of one block from each ADP zone. In the third stage, three cells were selected randomly from each block and the last stage involved the random selection of maize farmers from each of the cells. The number of maize farmers selected from each cell was (10% of the total farmers) proportionate to the size of the cell. In all, 400 farmers were interviewed, but only 386 copies of questionnaire that gave consistent responses were analysed. The distribution across the ADP zones is as shown below:
|
2.1. Measurement of Variables
2.1.1. The Dimensions of Social Capital (Index Generation)
- This study focused on six aspects of Local Level Associations (LLAs); the method of index generation is described below:Meeting attendance index: The indexes were obtained by summing up attendance of farmers members at meetings and relating it to the number of scheduled meeting per annum by the associations they belonged to. The value was then multiplied by 100 ([22] Maluccio, 2001; Aker, 2005).Density of membership: This was measured by the number of active farmer membership in existing associations. A complete inventory of all associations was made at local level institutions (LLIs). Each farmer was given the inventory and was asked to indicate which associations he/she belonged to. The proportion of membership of associations by individuals was calculated and rescaled to 100 (Aker, 2005).Heterogeneity index: The three most important associations that each farmer belonged to were identified. For each of the three associations, each farmer answered questions on whether members lived in the same neighborhoods, were same kin group, same occupation, were of the same of same economic status, were of the same religion, are of same gender and same age group. For each of the factors, a yes/ no response was coded 1 or zero (a value of one on each criterion indicated that members of the associations were ‘mostly from different’ kin groups, economic status, etc.). The scores in the three associations for each farmer were then divided by the maximum score to obtain an index. This index was then multiplied by hundred (a zero value represented complete homogeneity, while 100 represented complete heterogeneity) ([29] Okunmadewa, Yusuf and Omonona, 2005).Decision making index: This was calculated by asking association members to subjectively evaluate whether they were “very active”, “somewhat active” or “not very active” in the group’s decision making. This response was scaled from 2 to 0, and was averaged across the three most important associations and multiplied by 100 for each farmer (Grooteart, 2000; ([29] Okunmadewa, Yusuf and Omonona, 2005; [35] Yusuf, 2008).Cash contribution index: This was obtained through the summation of the total cash contributed to three most important associations which the farmer belonged. The actual contribution for each farmer was rescaled by dividing the amount by the maximum fee scheduled to be contributed and multiplying the resultant fraction by 100 ([12] Grootaert, 2000).Labour contribution index: This is number of days that farmers belonging to associations have worked for their associations. This represents total number of days worked by members in a year divided by the total number of days they were scheduled to work for the associations. This was then rescaled to 100 ([13] Grootaert, 2001; [29] Okunmadewa, Yusuf and Omonona, 2005; [35] Yusuf, 2008).Aggregate social capital index: This is the multiplicative SCI. The index is the products of density of membership, heterogeneity index and decision making index of farmers in their various SGs [1] Adepoju, 2012.
2.1.2. Logit Model
- Logit regression model was specified to identify factors that influence the probability of using improved maize seed among farmers [24] (Neupane, Sharma and Thapa, 2002).Assuming the probability that farmer n would choose to produce maize using a particular technology (local seed or improved seed is equal to the proportion of maize farmers using either of the technology, then the individual empirical models to be estimated may be specified as:
 | (1) |
 and
and  are vector of respective parameters estimated
 = vectors of explanatory variables (Farmer’s characteristics, Seed variables and Social capital dimensions and variables)
 = error termsVolume of loan accessed from SGs is a function of cash contributed; therefore, cash contribution index was not included in the model; besides its inclusion in the trial model give no significant result.
 3. Results and Discussions
3.1. Socio-economic Characteristics and Social Capital Dimensions
- The distribution of farmers by social capital dimension and socio-economic characteristics of the farmers in relation to the social capital dimensions are presented below.
3.1.1. Distribution of Farmers by Social Capital Dimension
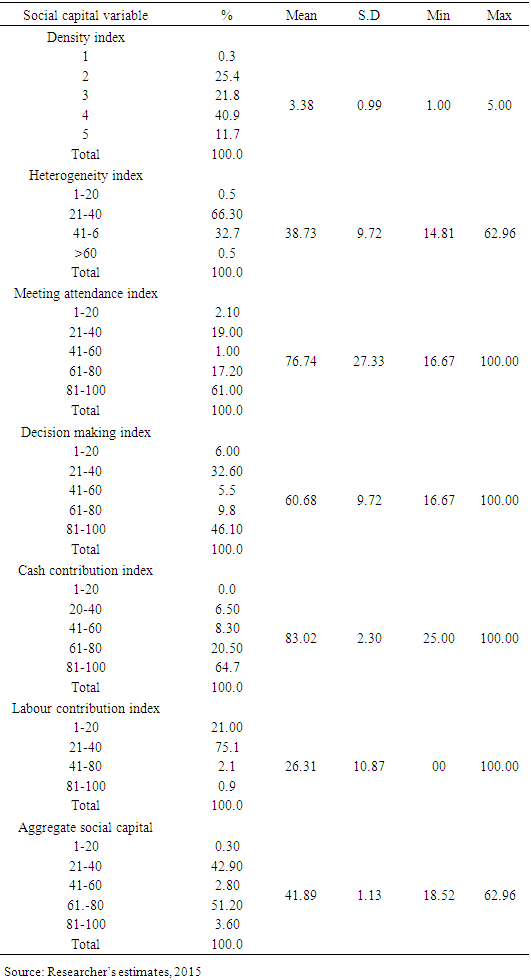
- The SC dimensions of membership density, heterogeneity index, meeting attendance decision making, cash contribution, labour contribution and aggregate SC index of farmers were presented in the table 2. A farmer belonged to an average of 3.38 SGs. Level of diversity of farmers within the associations to which farmers belonged was measured by heterogeneity index. Heterogeneity index of associations to which a farmer belonged was 38.7%. Heterogeneity of farmer in SGs was low (<50%). This implied that farmers had more similar socio-economic characteristics and this could promote trust and enhance information and knowledge sharing among famers. The result showed that meeting attendance (76.7%) which implied that farmer attended meetings scheduled up to about (77%). It suggested that farmers in the area of study had access to information through their SG. Decision making index was moderate (60.68%). This agrees with the finding of [18] Iyanda, Afolami, Obayelu and Ladebo (2014). It showed that members’ decisions on matters were made by majority of the farmers. Average monthly cash contributed by members to associations by farmers was N83.02. This amounted to an average of N996.24 in a year. The implication of this was that farmers had low access to credit since their cash contribution determined the volume of loan they could access from their associations.
|
3.1.2. Use of Maize Seed and the Dimension of Social Capital
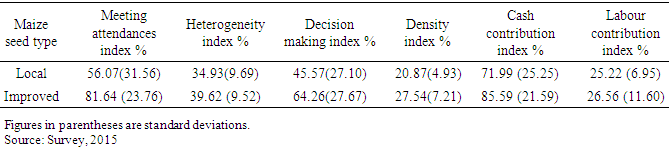
- The use of maize seed and the dimensions of SC is presented in table 3 and it revealed that cash contribution index (85.6) had the highest for farmers that used IMS. This could be due to the fact that IMS might be given easily to farmers that paid their dues regularly. This was followed by meeting attendance index (81.6). It implied that an attendance in meeting enabled farmers to be informed of IMS purchase and, therefore, gave their consent to access the seed. Decision making index was high (64.3). The implication of this was that social group carried members along in decision making and in execution of the decisions made. All the indices were higher for IMS. It implied that active participation in SG enhanced the use of IMS.
|
3.2. Distribution of Farmers Based on Socio-economic Characteristics and Social Capital Dimensions
3.2.1. Age of Farmers and Social Capital Dimensions
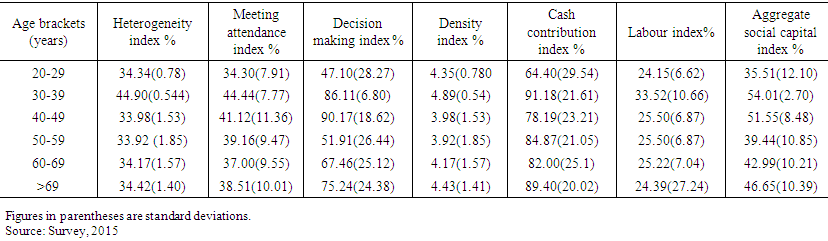
- Table 4 showed the distribution of farmers by age and SC dimensions. The age group 40-49 had the highest meeting attendance (44.4%). This implied that members’ dedication to their SG measured by attendance of meeting was low. Age group 30-39 years had the highest density (4.89), while age group 50-59 had the lowest (3.92%). Aged people belonged to more groups. This agrees with [20] Kuku, Omonona, Oluwatayo, and Ogunleye, (2013) findings that farmers aged 70 years and above had the highest density in association membership. This could be the due to the fact that at higher age, they did less work and relaxed more. Labour contribution was highest for farmers in the age group 30-39 years (33.5). Cash contribution was highest for age group 30-39 years. This indicated that they had more income than the other groups. Aggregate of SC showed that 54% of farmers between 30-39 years had the highest aggregate SC, while age group 20-29 had the least. Younger farmers invested more of their money and labour.
 | Table 4. Distribution of farmers by age and social capital dimensions in percentages |
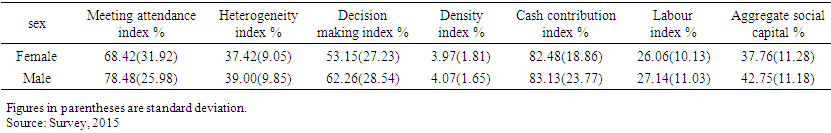
3.2.2. Sex and Social Capital Dimensions
- Table 5 is presented the distribution of farmers by sex and SC dimensions. Female farmers had lower meeting attendance index (68.4%), heterogeneity index (37.4%), cash contribution (82.5%), labour contribution (26.1), decision making index (53.1%), density index (3.9%) and aggregate SC (37.7%). On the other hand, male farmers had higher meeting attendance index (78.5%), heterogeneity index (39.0%), cash contribution (83.1%), labour contribution (27.1), decision making index (62.3%), density index (4.0%) and aggregate SC (42.8%). Male farmers joined at least, 4 associations and attended 78% of their association meetings. This might be due to the fact that male farmers have more free time after their days’ work than their female counterparts that must care for their families after their days’ work.
 | Table 5. Distribution of farmers by sex and social capital dimensions |
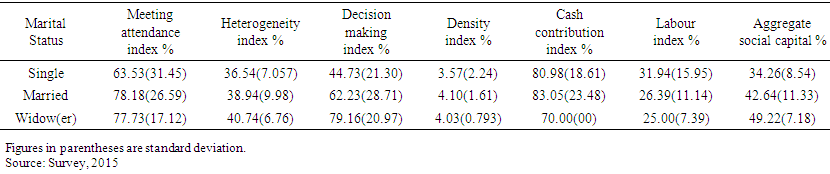
3.2.3. Marital Status and Social Capital Dimensions
- Table 6 showed that farmers who were married (4.1) and widows or widowers (4.03) belonged to more associations than single farmers. Married farmers attended (78.7%) of scheduled meeting and their meeting attendance was more than others. Married farmers’ cash contribution (83.1%) was the highest. Heterogeneity (40.74%) for widows / widowers was the highest. The cash contribution by widows/ widowers (70.00%) was lower than that of married and single farmers possibly as a result of the fact that they were solely responsible for their families’ upkeep. Equally, the labour contribution of the widows/ widowers (25.00%) was lowest, but they had the highest decision making index (79.2%).
 | Table 6. Distribution of farmers by marital status and social capital dimensions |
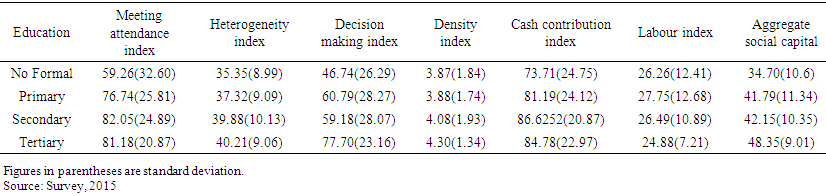
3.2.4. Educational Status and Social Capital Dimensions
- Table 7 showed that farmers with no formal education had the least density index (3.9%), heterogeneity index (35.4%), meeting attendance index (59.3%), cash contribution index (73.7%) and ASCI (34.7%). Farmers with tertiary education had the highest heterogeneity (40.2%), decision making index (77.7%), meeting attendance (81.2) and ASCI (48.35%) but the least labour contribution (24.9%). All these findings agree with [20] Kuku, Omonona, Oluwatayo and Ogunleye (2013) findings. Higher decision making index could be a product of the level of intelligence and exposure. Also, the lower labour contribution by tertiary education respondents was as expected because of the regard given to the educated by the illiterate. This agrees with the findings of [29] Okunmadewa et al., (2005) and Adepoju (2012) which exempted the highly educated from participation in manual or menial jobs.
 | Table 7. Distribution of farmers by education and social capital dimensions |
3.2.5. Household Size and Social Capital Dimensions
- Table 8 showed households with 1-4 members had the highest heterogeneity (39.8%) and had density index (4.0). Farmers with 13-16 household members had the highest meeting attendance index (80.1%), cash contribution index (96.1%) and labour contribution index (29.5). Farmers with household size 9-12 had the highest decision index (68.4%) and density index (4.1). However, they had slightly lower labour contribution than all others. Farmers with household size 5-8 had the lowest cash contribution index (81.9%).
 | Table 8. Distribution of farmers by household size and social capital dimensions |
3.3. Determinants of Farmers’ Use of Improved Maize Seed
- Table 9 was presented the result of LM used to investigate the use of IMS by farmers. Seventeen variables were included in the model and only 6 variables were significant at 5%. The likelihood ratio chi-square of -99.50 with a p-value of 0.000 revealed that the model as a whole was statistically significant.
|
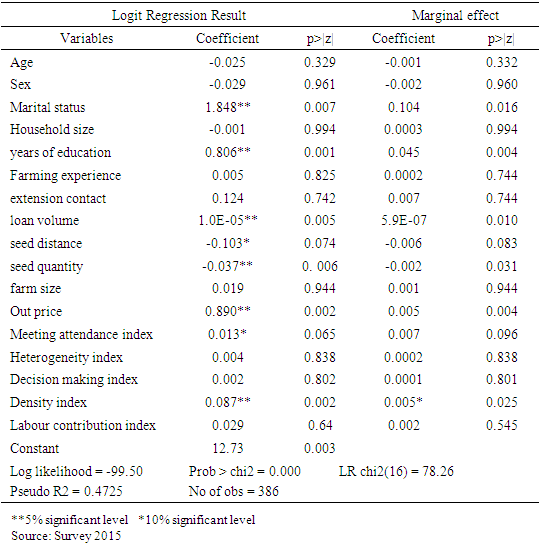
4. Conclusions
- The study provided empirical evidence that use of IMS was influenced by social capital. Based on the result of the logit model, it was evident that education, SC, access to credit, access to IMS, other complimentary inputs and labour availability were drivers for the usage of IMS.
4.1. Policy Implications and Recommendations
- • Farmers’ attendance in meetings and their participation in decision making are important in promoting usage of IMS. Local level associations should attach serious sanctions, such as payment of huge fine by members that fail to attend meetings.• Education is one of the major factors that influence the adoption of IMS. This suggests that agricultural training programmes that would enhance farmers’ awareness of the importance of improved seed should be put in place by government and the extension agents. Also, education beyond the basic education level should be subsidised and made compulsory and educational loans should be made available by government.• Access to credit is an important driver of improved seed usage. Therefore, banks should be mandated and supervised by the government to make loan available to farmers through farmers SG and the credit usage should be monitored.