-
Paper Information
- Next Paper
- Paper Submission
-
Journal Information
- About This Journal
- Editorial Board
- Current Issue
- Archive
- Author Guidelines
- Contact Us
International Journal of Agriculture and Forestry
p-ISSN: 2165-882X e-ISSN: 2165-8846
2018; 8(2): 104-111
doi:10.5923/j.ijaf.20180802.09

Effects of Climate Change on Yam Production in Cross River State, Nigeria
 Abstract
 Reference
 Full-Text PDF
 Full-text HTML
Elijah Samuel T.1, Osuafor Ogonna O.2, Anarah Samuel E.2
1Department of Agricultural Economics, University of Nigeria, Enugu State, Nigeria
2Department of Agricultural Economics and Extension, Nnamdi Azikiwe University Awka, Anambra State, Nigeria
Correspondence to: Osuafor Ogonna O., Department of Agricultural Economics and Extension, Nnamdi Azikiwe University Awka, Anambra State, Nigeria.
| Email: |  |
Copyright © 2018 The Author(s). Published by Scientific & Academic Publishing.
This work is licensed under the Creative Commons Attribution International License (CC BY).
http://creativecommons.org/licenses/by/4.0/

Climate change is critically affecting agricultural productivity and food security in developed and developing economies of the world. Developing countries like Nigeria often depend on rainwater for crop production. However, Unpredictable changes in the onset of rains in the last 10 years have led to situations where crops planted with the arrival of early rains get smothered in the soil by an unexpected dry spell; resulting in harvest failures in Nigeria and other ecosystems that rely on rain-fed agriculture. These challenges therefore pose questions like: to what extent has climate change affected crop productivity? What are the activities of the farmers that exacerbate the effect of climate change? The broad objective of the study was to examine the effect of climate change on root crops production in Cross River State, Nigeria. To achieve this, the specific objectives were to: determine the effects of climate change on yam production; identify the activities of the farmers that exacerbate the effect of climate change. The study employed a survey design. A multi-stage sampling technique was adopted to select 150 respondents (farmers) for the study. The yam output was proxied by farmers’ income in the study area and was therefore regressed against the independent variables. Ordinary Least Square analysis, Likert rating scale and descriptive statistics were employed to actualize the objectives while t-test was employed to test the hypothesis. The results show that the effects of climate variability and change on yam production is statistically significant at P<0.05. The prevalent farm practices in the area according to the order of intensity were; burning of firewood – 16%, burning of crop residues and household waste as well as burning of fossil fuel by automobile – 11%, deforestation and the use of fertilizer – 10%, bush burning, use of herbicide/insecticide and burning of fossil fuel by industries – 9%, continuous cropping – 8% and use of insecticide/pesticide – 7%. Recommendations were made based on the findings.
Keywords: Climate change, Productivity, Food security
Cite this paper: Elijah Samuel T., Osuafor Ogonna O., Anarah Samuel E., Effects of Climate Change on Yam Production in Cross River State, Nigeria, International Journal of Agriculture and Forestry, Vol. 8 No. 2, 2018, pp. 104-111. doi: 10.5923/j.ijaf.20180802.09.
Article Outline
1. Introduction
- Climate change is a subject that has attracted considerable attention in recent years due to its deleterious effects on ecosystem. Until recently, the effects of man’s activities on climate variations were perceived as negligible and so climate change was generally taken for granted [1]. However, it is palpably established that climate change is no longer a trivial issue; it is a reality that is seriously affecting the earth already, especially challenging agricultural productivity and food security in both developed and developing economies of the world and thus requires urgent attention. Although, the impacts of climate change on agricultural productivity may be positive or negative; however, empirical studies show that the latter outweighs the former [2-6]. In the view of the International Panel on Climate Change [7], climate change is a change in the state of the climate that can be identified (e.g. using statistical tests) by changes in the mean and/or the variability of its properties and that persist for an extended period typically decades or longer. On the other hand, the United Nations Framework Convention on Climate Change (UNFCCC, 1992) views climate change as a change of climate (air temperature, windfall, wind speed), which is attributable directly or indirectly to human activity that alters the composition of the global atmosphere, and which is in addition to natural climate variability observed over a comparative time periods. In recent times, various countries have been threatened by changes in climatic conditions ranging from draught, delayed rainfall, continuous melting of the polar region causing severe flood in some countries and speculation about the acid rain [8]. In Africa as a whole and Nigeria in particular, the pattern of rainfall has already altered, affecting the commencement of the planting season and resulting in poor harvest yields. Although IPCC projections suggest rainfall in southern Nigeria will increase [9], the simultaneous increase in temperature may increase evaporation and potential evapo-transpiration, leading to a tendency towards droughts. Indeed, recent studies indicate a 10-25% decrease in precipitation in southern Nigeria since the beginning of the century. If this trend persists, rainfall in the humid regions of southern Nigeria may be about 50% to 80% of the 1900 values by 2100 [6]. Such periods of drought will have a drastic impact upon agricultural output in the region, particularly if there is no forest remaining to act as a buffer during times of food crisis.Yam production in Nigeria seems to be the most vulnerable by the deleterious effects of climate change. Yam is an annual tuber and monocot plant. It belongs to the genus “Dioscorea” and the family “dioscoreacea”. The food plant comprises of 600 species out of which ten species produces edible tubers and only six are cultivated in Africa [10]. As a root crop, the place of yam in the diet of the people in West Africa and in Nigeria in particular cannot be overemphasized. [11] observes that yam contributes more than 200 dietary calories per capita daily for more than 150 million people in West Africa while serving as an important source of income to the people. In Nigeria, yam is becoming more expensive and relatively unaffordable in urban areas as production growth has not kept pace with population growth leading to demand exceeding supply [12]. Yam production in Nigeria is entirely dominated by small-scale farmers [13]. Furthermore, the production of this crop like every other crop is affected by factors varying from physical, economic to cultural [14]. Climate, one of the physical factors, is the most crucial factor, which determines the nature of the natural vegetation, the characteristics of the soils, the crops that can be grown, and the type of farming that can be practiced in any region [14]. The most important climatic elements for crop growth and yield are radiant energy, or solar radiation, temperature and water or rainfall [15]. Solar radiation in turn determines the thermal characteristics of the environment, namely net radiation, day-length or photoperiod, the air and soil temperatures [16]. Soil and air temperatures affect the developmental stages more than any other factor [17]. Statement of the ProblemClimate change can seriously affect agricultural production. Climate change brings about changes in weather patterns which in turn give rise to imbalances in seasonal cycles, harm to ecosystems and water supply affecting agriculture and food production, causing sea levels to rise. Extreme weather events such as floods, landslides and drought are caused by climate change. Climate change, including global warming and increased climate variability result in a variety of impacts on agriculture. [18] and [3] noted that unpredictable changes in the onset of rains in the last 10 years have led to situations where crops planted with the arrival of early rains get smothered in the soil by an unexpected dry spell that can follow early planting. Climate change impacts the four key dimensions of food security – availability, stability, access, and utilization. Availability of agricultural products is affected by climate change directly through its impacts on crop yields, crop pests and diseases, and soil fertility and water-holding properties. It is also affected by climate change indirectly through its impacts on economic growth, income distribution, and agricultural demand. In addition, stability of crop yields and food supplies is negatively affected by variable weather conditions [19]. These challenges therefore pose questions like: to what extent has climate change affected yam production in Nigeria? What are the activities of the farmers that exacerbate the effect of climate variability and change in Cross River State? There have been numerous studies of climate change, the bulk of these were conducted in temperate and highly industrialized countries [20]. Most of the empirical work to date on the effect of climate change on crop production has focused on Europe, the United States, Canada and Australia [21]. Worldwide little research has focused on developing regions such as those in the tropical rainforest where the poor who may be most vulnerable to adverse changes live. Scientists fear that the most adverse effects are likely to occur in this region [21]. Some of the studies in developing regions [22, 23, 6] considered the effects of one or two aspects of climate change on maize and other crops. None within the knowledge of the researcher has focused on yam production in the agro-ecological zones of many developing countries especially that of the rainforest zone of Nigeria where the most vulnerable group live; hence, the necessity for this study.Objectives of the StudyThe broad objective of this study is to examine the effects of climate change on yam production in Cross River State, Nigeria. Specifically, the study is meant to:1. determine the effects of climate variability and change on yam production; 2. identify the activities of the farmers that exacerbate the effect of climate change in the study area.Hypothesis of the StudyClimate change has no significant effect on yam production in the study area.Theoretical FrameworkAccording to [24], a theory is a set of reasoned ideas that are intended to explain facts or statement of the principles on which a subject is based. A theoretical framework guides your research, determining what things you will measure, and what statistical relationships you will look for [25]. In this context, the neo-classical growth model will be adopted to examine the effect of climate change on the yield of the selected crops. [26] argued that an appropriate framework to analyze the food crop output is the neo-classical growth model. The neoclassical growth model, also known as the Solow–Swan growth model or exogenous growth model, is a class of economic models of long-run economic growth set within the framework of neoclassical economics. Neoclassical growth models attempt to explain long run economic growth by looking at productivity, capital accumulation, population growth and technological progress. How then can this model be linked to this study? Basically, the productivity (i.e. output) or weighted food crop yield proxied by income, is assumed to be a function of loss due to climate change, quantity of fertilizer used, quantity of pesticides, excess cost on disease prevention, excess cost of additional supply of yam and cost of excess rainfall. The general formulation of the production function is: Q = A(t) f(K, L)Where Q denotes the output (income), K and L are, capital (expenditure incurred) and labour respectively. The factor A(t) measures productivity shifts over time which may be induced by technological progress or through adaption linked to changes in climatic conditions, as per land productivity is concerned.
2. Methodology
- This study was carried out in Cross River State. Cross River State, lies between latitudes 5°32' and 4°27' North and longitudes 7°50' and 9°28' East, bounded in the North by Benue State, in the South-west by Akwa Ibom State, in the West by Ebonyi and Abia States. Cross River State has the largest rainforest covering about 7,290 square kilometers described as one of Africa’s largest remaining virgin forest harbouring as many as five million species of animals, insects and plants [27]. The climate of the area is controlled by two tropical air masses namely the equatorial maritime (MT) air mass, which originates from the South-West and the tropical continent (CT) air mass, which originates from North East [28], with average temperatures ranging between 15°C - 30°C, and the annual rainfall between 1300 – 3000mm. The high plateau of Obudu experience climatic conditions which are markedly different from the generalized dry and wet period in the rest of Cross River State. Temperatures are 4°C - 10°C lower due to high altitude than in the surrounding areas. Similarly, the annual rainfall figures are higher than in areas around them, particularly on the windward side [29]. Sampling TechniqueMulti-stage sampling technique was used to select the respondents. This procedure considered the delineation of the study area into zones. The Cross River Agricultural Development Project (CRADP) divided the state into three agricultural zones namely Ogoja Zone, Ikom Zone and Calabar Zone [30]. Each of the agricultural zones comprises six (6) Local Government Areas. In the first stage, one (1) Local Government Area was selected randomly from each of the zones. In the second stage, five (5) farming communities were randomly selected from each of the Local Government Areas making a total of fifteen (15) farming communities. In the thirds stage, ten (10) respondents (farming households) were finally selected from each of the farming communities making a total of 150 farmers (respondents) for the study. Only Primary data were used for the analysis. The primary data were collected with the aid of detailed and well-structured questionnaire administered to the selected yam crop farmers and was complemented by scheduled interview. The questionnaire was designed to capture information on socioeconomic and demographic data like age, gender, household size, size of land holding, etc. In this study, Objective 1 was realized using ordinary least squares (OLS) analysis, while objective 2 employed Likert rating scale and descriptive statistics. T-test was employed to test the hypothesis.Model SpecificationThe multiple regression model was specified as:
 Where
Where  = yam yield (income)X1 = sex (male =1, 0 otherwise)X2 = years of educationX3 = experience in yam production (years)X4 = belonging to an associationX5 = household size (number of persons)X6 = age (years)X7 = losses from diseases due to climate change (₦)X8 = excess preservation cost due to excessive rainfall/sunlight (₦)X9 = excess cost on disease preventionX10 = market access (yes =1, 0 otherwise)X11 = cost of additional supply of yamX12 = hired labour (man days)X13 = quantity of fertilizer used (kg)X14 = quantity of pesticide applied (ltrs)ei = error term
3. Results and Discussion
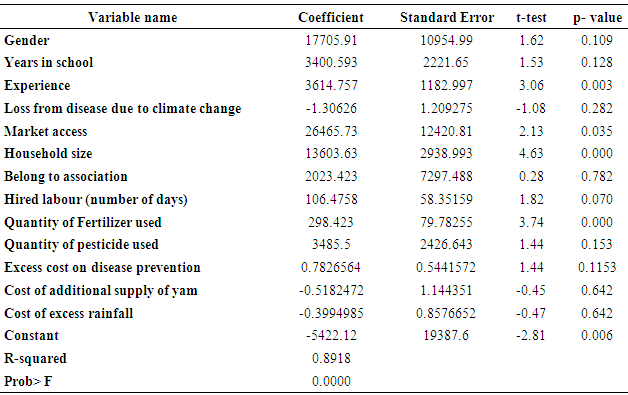
- Objective 1: Effects of Climate Change on Yam Production The multiple regression was used to investigate the effects of climate change on yam production which is the first objective of this study. The study used the proceeds (income) from yam to proxy yam production at the end of a season, while it employs the core variables for climate change to be loss from disease due to climate change, quantity of fertiliser used, quantity of pesticides, excess cost on disease prevention, excess cost of additional supply of yam and cost of excess rainfall. The results are presented on Table 1.
|
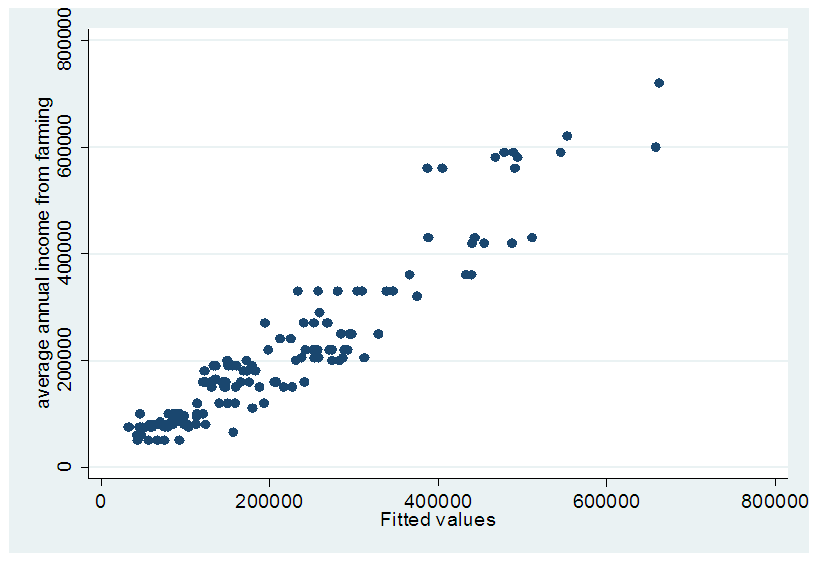 | Figure 1. Predicting Power of the Explanatory Variables of Income |
|
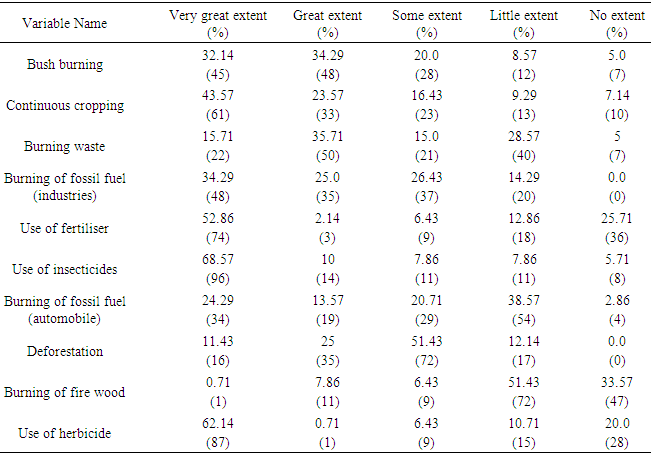
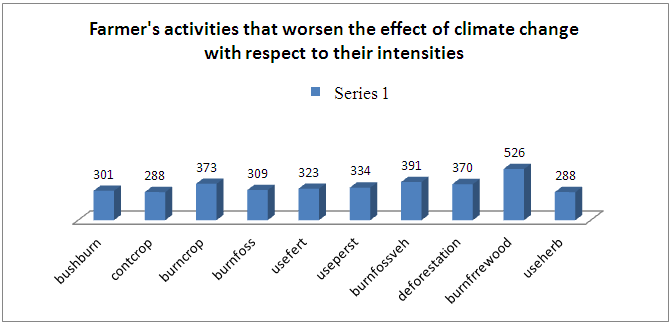 To have a clearer picture of the intensities of climate change the study illustrates the composite index of the intensities using bar charts. The composite index was gotten by summing up all the responses of the responses on farmer’s activities by assigning 5 to a very great extent, 4 to a great extent, 3 to some extent and 2 to a little extent. Based on this therefore the figure above illustrates that the most intensively used is the practice of firewood burning with about 526 followed by the burning of fossil fuel by vehicles and then the burning of waste. While the least intensively practiced are the continuous cropping and the use of herbicides with a composite index of 288.
 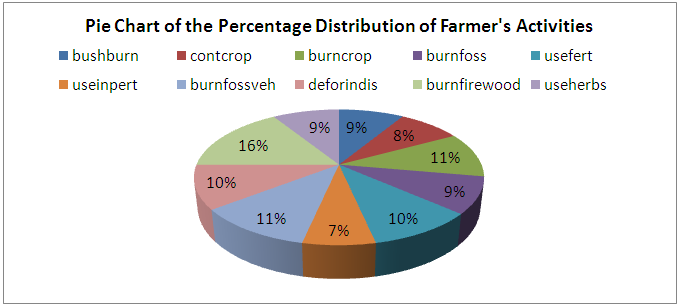 This could be further buttressed with a pie chart showing the intensities of the farmer’s activities in percentages. The pie chart above suggest that based on the 10 farmer’s activities that worsen the effect of climate change considered in the study, the greatest contributor is the burning of firewood 16%, 11% for the burning of crop and household waste as well as the burning of fossil fuel by automobile. Followed by deforestation and the use of fertiliser, burning of fossil fuel by industries and the least contributor is that of continuous cropping with only 8%. However, their contributions are more or less similar having only small margins among them.
4. Conclusions
- The findings illustrate that climate change has no significant effect on the production of certain root crops in the study area. However, the study does not suggest that climate change and its variability has no impact on root crops generally, as the bulk of empirical review posits that climate change has critical impact on crop production. Little research in the subject of climate change and its impacts on agricultural productivity has been done in the area of study. Consequently, the rural farmers are to a large extent ignorant of the anticipated deleterious impact. It therefore calls for agricultural economists in the country to gear their research interests on the subject matter of climate change and its associated issues towards the area of study.
5. Recommendations
- Based on the findings of this study, the following recommendations and policy implication are advocated as alternatives to curb the effect of climate change in the study area as well as the country at large:1. More should be invested in research on more efficient measures to combat the nascent turbulence peculiar with climate variability and change in the study area and the entire planet. 2. Although, the findings of the study established that the effect of climate variability and change is insignificant on yam production; however, there is need to be on the watch to avoid untold devastating impediment to the agrarian economy. 3. Policies should be put in place to regulate anthropogenic practices that foster climate change and its variability.4. One of the predominant challenges in the study area is lack of access to extension services. To redress this, the government should deploy more extension agents to the area of study.