E. C. Merem1, Y. Twumasi2, J. Wesley1, P. Isokpehi1, S. Fageir1, M. Crisler1, C. Romorno1, A. Hines3, G. S. Ochai4, S. Leggett4, E. Nwagboso5
1Department of Urban and Regional Planning, Jackson State University, Jackson, MS, USA
2Department of Urban Forestry and Natural Resources, Southern University, Baton Rouge, LA, USA
3Department of Public Policy and Administration, Jackson State University, Jackson, MS, USA
4Department of Health Policy and Administration, Jackson State University, Jackson, MS, USA
5Department of Political Science, Jackson State University, Jackson, MS, USA
Correspondence to: E. C. Merem, Department of Urban and Regional Planning, Jackson State University, Jackson, MS, USA.
| Email: |  |
Copyright © 2018 Scientific & Academic Publishing. All Rights Reserved.
This work is licensed under the Creative Commons Attribution International License (CC BY).
http://creativecommons.org/licenses/by/4.0/

Abstract
The state of Mississippi compared to its size contains enormous forestland with ecological and economic benefits. Just as it provides habitats for different species of animals, and acts as a carbon sink for greenhouse gases. In the last several years, the forestry sector has assumed a leading role in the state’s economy. With a production structure built on private ownership, the forest sector continued to face wildfire threats, and the limited adoption of forest management plans by most landowners. Despite four decades of stability, the impacts of extensive logging and the risks of forest depletion from such practices could emerge as major problems in the future in the absence of effective management. Accordingly, the paper presents an analysis of changing trends in Mississippi’s forestry sector. The project uses descriptive statistics and Geographic Information Systems (GIS) to track the changes under a mix-scale model alongside the identification of factors fuelling the problems in the state. In view of that, the results point to the presence of different forest types and ownership categories as well as changing forestland at the state and regional level. GIS mapping revealed clusters of counties filled with concentration of forests in various regions, the risks of forest fire, outbreak of pests and the penetration of wood processing mills statewide. Notwithstanding the partial diffusion of forest management plans and changes attributed to physical, economic and demographic factors, the suggested mitigation measures ranged from the adoption of forest management plans to continued GIS mapping.
Keywords:
Forest, Land area, GIS, Ownership category, Changes, Regional trends, Factors
Cite this paper: E. C. Merem, Y. Twumasi, J. Wesley, P. Isokpehi, S. Fageir, M. Crisler, C. Romorno, A. Hines, G. S. Ochai, S. Leggett, E. Nwagboso, Analyzing Changing Trends in Forest Land Areas of Mississippi, International Journal of Agriculture and Forestry, Vol. 8 No. 1, 2018, pp. 35-52. doi: 10.5923/j.ijaf.20180801.06.
1. Introduction
The state of Mississippi compared to its size and land area has enormous tracts of forestland with a whole range of ecological and economic benefits for society and other life forms. According to the United States Forest Service forest survey, Mississippi has 19.8 million acres of commercial forestland [1]. This represents 65% of the state’s land and indications are that more land is being planted to trees from marginal agriculture annually [1-3]. In essence, the health of forests is not only crucial to humanity’s place on earth, but forestland performs vital ecological services. Part of the role of forests involves the provision of habitats for different species of animals and its crucial capacity in the regulation of climate, the prevention of land degradation and flooding, and staving off the impacts of environmental change by acting as the world’s second largest store house of carbon as an emission sink for greenhouse gases [4]. Considering such a critical attribute in the midst of recurrent hazards from climatic variability, in the last several years, the analysis of forest trends continued to assume greater importance in both academic and policy arenas. With the rise of environmentalism in the 1960s, popular ideas about the proper use of forests changed. In the process, practices such as clear-cutting, single-age management, and manufacturing by chip mills became highly controversial [3]. Not only has society become highly interested in the condition of its forest resources, but also reports of acid rain, global warming, and massive clearing of tropical rain forests, have put increasing pressure on today’s resource managers to report on the status, ownership patterns, and the woodlands under their charge. For that, the United Nations (UN) has followed up through the adoption of a strategic plan [5] and the proposal for sustainable forest management initiatives (SFM) based on the adoption of forest instruments, international arrangements and global objectives [6-8]. On the one hand, the proposed strategic plan for forests covers 6 global forest goals and 26 associated targets with a commitment to increase forest area world wide by 3% in 2030 [5]. On the other, the management component under three segments recognizes the contributions of forests to development, with measures dealing with forest related issues, the prevention of degradation, enhancement of ecological and economic benefits, the increases in the size of protected forest areas coupled with restoration and afforestation [6-8]. Fortunately, this interest coincides with the growing acceptance of Geographic Information Systems (GIS) and hosts of other analytical approaches as valuable monitoring tools for management [9-13]. In the context of the study area, much of the GIS applications germane to changing the forest landscape extend from the studies in agriculture to agroforestry. With the details covered under various years, the underlying themes in these studies reaffirm the use of GIS as an analytical and decision support tool under a mix-scale orientation on different localities. This resonates with the dynamic nature of Mississippi’s forest trends in the last several years and in line with the call to map, track and protect renewable natural resources like timberland areas. This emerging idea prompted by the current thinking has fostered a novel notion of the forest not only as an ecosystem in itself, but also as a component of a very complex global ecosystem. With the growing perception of the forest as some kind of bio-indicator of planetary health, resource management agencies around the world are working to establish baseline standards to gauge possible deviation from acceptable management practices [14, 15]. In that line, numerous organizations including the Forest Association of Mississippi are playing a variety of roles in tracking the acreages of forestland uses, wildfire outbreaks within the state’s forest ecosystem [2, 3]. As similar efforts have been made elsewhere to manage forests sustainably [14, 15], developing an analytical approach showing these trends is critical for economic and ecological sustainability in a state where 80 % of the forest ownership is in private hands. Thus, the analysis of forest land use changes and trend helps update existing efforts among scholars and agencies addressing the management challenges in the sector.With that, over the past years, the forestry sector of Mississippi has assumed a leading role as one of the essential components of the state’s economy. In the process, the economic impacts of the state’s timber harvest in 2017 stood at $12.79-10.9 $billion dollars coupled with about 59,157-70,000 jobs created from 2013-2017 [1, 16, 17, 18, 2, 19]. As population growth and demands on the state’s forest resources have surged with impacts on the inventory, it is imperative to have a sound grasp of the volume and condition of the state’s forest resources even though just 5% of forest land owners in the state, use timber management plans. Aside from the fact, that Mississippi’s forest acreage has remained dynamic and slightly stable for nearly four decades, the impacts of logging by the timber industry could emerge as key ecological problem in the absence of proper management and assessment. Even though, forest acreage information requires constant upgrading for the purposes of management decisions, very little exists in the literature to undertake this task spatially using GIS. This research will fill this void by assessing changes in forestland use in Mississippi using GIS. The emphasis is on the trends, ownership, forest acreage change and factors. The paper has five objectives. The first aim focuses on the use of spatial tools to assess the effects of forest use, while the second objective is to design a decision support tool for managers. The third aim emphasizes the development of a new technique for appraising indices for forest management. The fourth objective is to design a basis for optimal planning in the sector. The fifth objective is to analyze forestland resource use in Mississippi. The paper has four sections. The first section covers the introduction and background, while section 2 describes the materials and methods based upon descriptive statistics and GIS. Section 3 provides the results of the data analysis involving temporal-spatial analysis of the trends, along with the identification of factors. Section 4 and 5 followed up with discussions of the findings, recommendations and closure of the paper.
2. Methods and Materials
The study area of Mississippi as shown in Figure 1 is a predominantly rural state situated in the South East portion of the United States of America. With an estimated population of 2.99 million inhabitants and 82 counties, forest land (19.8 Million acres) covers 65% of the entire area of the state [1-3]. The vast habitats suitable for the production of the three forest types of quality hardwoods, oak pine and pine harvest exist in different areas of Mississippi. 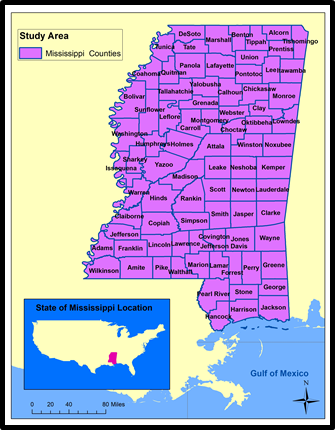 | Figure 1. The Study Area |
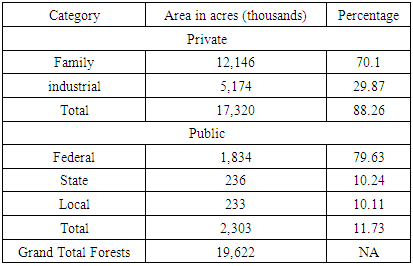
These sites are located throughout the state from larger acreages in the Delta alluvial plains and loess hills to smaller tracts along minor stream bottoms. From prehistory to the present, people have harvested Mississippi’s three classes of forests, cultivated and transformed the woodlands, and hunted forest wildlife. During those periods, Native Americans, the first foresters, periodically burned the undergrowth to improve hunting and to clear land for agriculture. More so, the forests offered the necessities of life to early settlers who relied on the forest for fuel and pasture and for home building [17, 20].In last phase of the 20th century, of Mississippi’s 82 counties, timber stayed as the most valuable agricultural crop in 49 counties, the second most valued in 17 counties and third most prized in 2 counties. In 1997, 83% of the counties in the state had timber as an important part of their agricultural economy. In the counties where timber was the most valuable agricultural crop, the values ranged from a low estimate of $5.0 million to a high of $39.2 million. While timber values represent a minor segment of the local economy in an urban county like Hinds, in most rural counties, timber remains an integral part of the local economy. Having seen the essence and distribution patterns, forest land use ownership by category in 2006 indicates that the forestland are concentrated in two broad areas of private and public domains with the former covering about 17,320 acres and the later at 2,303 thousand acres respectively. Among the private category, individual families lead the way with 12,146 thousand acres while industrial operators held 5,174 thousand acres. Under the public class, the federal government maintained ownership of 1,834 thousand acres while land under state and local authorities stood at over 230 thousand acres [21] (Table 1). The percentage distribution among the total ownership categories statewide also shows private operators control about 88.26% compared to 11.73% for those under public interests. Amongst all operators in the state, family owned operations stood out more than the others as well (Table 1).Table 1. Area of Forest Land by Ownership Category, 2006
 |
| |
|
Notwithstanding the contributions of forests as a source of income through timber production, they are also a valuable resource for a cleaner environment as well as providers of recreational areas and wildlife habitats [4-8]. Despite the fact that forest resources of the state of Mississippi played a vibrant role in the region’s advancement [1, 19], there are still widespread threats to the timber sector of the state. The challenges emanate from the outbreaks of southern pine beetle disease and the fire threats as demonstrated in the next section on results [1]. Considering the relevance of timber in various areas of the state, an analysis of the forestland use involving acreage changes and other trends across time and space is of great importance to resource managers and policy makers in the state.
2.1. Methods Used
The paper uses a mix-scale approach of descriptive statistics and secondary data connected to GIS. The spatial information for the research was obtained from various sources including the University of Maryland Online Data services and the Food and Agricultural Organization (FAO) and the Statista database and The Mississippi Automated Resource Information System (MARIS). The others include The United Nations, the United States Department of Agriculture (USDA), Mississippi Society of American Foresters, Mississippi Forestry Commission (MFC), The Mississippi Association of American Foresters (MSAAF), Mississippi Institute For Forest Inventory (MIFI), Mississippi Delta Forest Inventory and the Mississippi Department of Agriculture and Commerce. Additional information was procured through the USDA Forest Service (USFS), Mississippi State University Forest and Wildlife Research Center, Mississippi Prescribed Fire Council, Mississippi Urban Forest Council, United States Department of Agriculture (USDA), Forest Service, and Southern Research Station. Over the time, the Mississippi Forest Commission (MCF) resource book (2010) provided forest time series and statistics for fire incidents and the spatial information while other related geo data came from the Mississippi Automated Resource Information System (MARIS 2003). In addition, the Mississippi State University also furnished the economic data for 1957-2000. Accordingly, the state geographic identifier codes for the cities and counties and regions in Mississippi were used to geo-code the information contained in the data sets. This information was later analyzed with basic descriptive statistics, and GIS, with particular attention to the temporal-spatial trends at the city, regional and state boundary level. The relevant procedures consist of two stages.
2.2. Stage 1: Identification of Variables, Data Gathering and Design
The initial step guiding the research involves the identification of the variables needed to research forestland use at the state and regional level from 1957-2002-2010-2016. The variables consist of socio-economic and environmental information in the form of forest acreage, forest types and forestland use type. The others consists of forest land by category, grand total of forest category, forest acre total, differences in forest acreage, number of wildfires, percentage of acre burned, number of acres burned and the average number of wild fires. Added to the list is the average number of acres lost to fire, cause of forest wild fires, and percentage of change in forestland. Economic variables range from total delivered value, stumpage value, logging and transportation value and total tax and severance tax collected. The various categories of data needed for the research were derived from secondary sources such as government documents, newsletters and previous work found in the libraries. Additionally, access to databases that are available within the federal and state archives in the United States and Mississippi and other international agencies quickened the search process. Accordingly, the data gathering process occurred through the information provided by the Mississippi Forest Association, Mississippi Forest Commission, and Mississippi Automated Resource Information System (MARIS 2003). That process continued with the design of data matrices on economic and environmental variables covering the periods of 1957, 2003, 2010, 2013 and 2016. The design of spatial data for the GIS analysis required the delineation of state, county and regional boundary lines.
2.3. Stage 2: Step 2: Data Analysis and GIS Mapping
In the second stage, basic forest statistics and spatial analysis helped transform the original data on economic and environmental variables into relative forms of percentages. Under this process, the parameters for establishing the temporal changes in timber acreages, the percent of forest areas, forest land by category, grand total of forest category, forest acre total, differences in forest acreage, number of state wild fire, percentage of acre burned and the number of acres burned and the trends were generated for the state of Mississippi. This was facilitated by measurements and comparisons of the trends over time. The purpose of this descriptive statistics database is to generate categories and matrices vital to the paper. Emphasizing state level and county data analysis across time ensures a gradual appraisal and comparison of the trends in the state, regions and counties over the years. While this approach tracks the levels of change, the tables highlight usage, the different categories, distribution patterns, the rates and percentages. The remaining steps cover spatial analysis and output (maps-tables-text) over the study periods, using Arc GIS 10.4 and SPSS 20.0. The spatial units of analysis consist of counties, regions and the boundary and locations where forest use, the economic returns, and other challenges are active. The design of spatial data needed for the GIS analysis required the identification of the appropriate digital county boundary lines covering the study periods of 1993, 1997 and 2000, 2010, 1996. This entailed the assemblage of the electronic version of available forestland cover maps containing forest regions of the state of Mississippi and counties for the years of 1994, 1997 and 2000, 2010. This was made possible by the retrieval of spatial data sets of shape files and grid records from the Mississippi Automated Resource Information System (MARIS) in digital form of Arc GIS. Given that the official boundary lines between several counties in the state stayed stable, it was possible to assign consistent geographic identifier code to the respective area units in order to maintain analytical coherency. The statistical output of the acreage changes from the spatial areas units were mapped and compared across time in Arc GIS. The process helped show the spatial locations, patterns and trends of forest acreage changes in the study area. With forest information now available in electronic format and with GIS software easily accessible, the capacity to undertake spatial analysis on forest trends is now enhanced for decision-making.
3. The Results
This section of the paper presents the results of the data analysis on forest trends in the study area. There is an opening focus on the analysis of forestland use activities in the early years. This followed by the description of percentages, differences, forest trends in the 2000s, and the threats of forest wild fires throughout the state. The others include GIS mapping and the factors responsible for forestland use changes in Mississippi.
3.1. Forest Land Use Activities in the Early Years
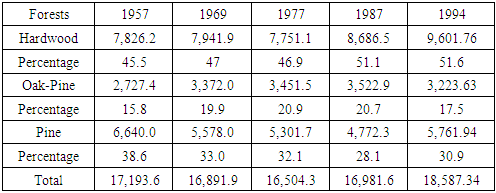
The information contained in Tables 2 to 2.2 outlines a summary of the temporal analysis on forestland use trends in the state of Mississippi in the early years of 1957-1994. The information as shown in Table 2 indicates that of the three forest types commonly found in the state, the area size of hardwood went from a value of 7,826.2 million acres in 1957 to 7,941.9 million in 1969, and it varied from 7,751.1million in 1977 to 8,686.5 million acres in 1987. In the following period of 1994, that number rose to 9,601.76 million acres. Regarding oak pine, approximately its initial estimate of 2,727.4 million acres in 1957 rose by 3,372 million acres in the period of 1969 and it experienced a slight variation from its 1977 level of 3,451.5 million acres to 3,522.9 million acres in 1987. In 1994, the state’s acreage of oakpine fell to 3,223.63 million acres. In terms of the forest type pine, the table shows that in 1957 the state of Mississippi had an estimated acreage of 6,640 million that year which latter came down (to 5,578 million acres) in 1969. While the study area opened with a value of 5,301.7 million acres in 1977, it plummeted to 4,772.3 million acres in 1987 and then moved up to 5,761.94 in 1994. Another aspect of the results shows the total acreage of the forest types at 17,193 million acres in the beginning of 1957, however it fell respectively in the three subsequent years (to 16,819.9, 16,504.3, 16,981.6) and then grew to 18,587.34 million acres in 1994 (Table 2).Table 2. The Distribution of Forest Acreage in Millions 1957-1994
 |
| |
|
3.1.1. The Differences in Acreages among Forest Types
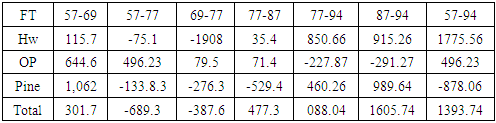
Elsewhere in Table 2.1, comes a display of the differences in the forestland acreages for the study area. The simplest way to look at the trends is by distinguishing between positive and negative estimates contained in the table for each of the forest types. The estimates with negative signs in Table 2.1 reveal some valuable signs on forest trends. In the first column, the table indicates a decline of -1,062 for pine and -301.7 for all forest types from 1957 to 1969. The differences for hardwood show a drop of -75.1 thousand acres in 1957-1977 while oak pine value stood at +496.23 thousand acres and pine recorded -1,338.3. At the same time, the difference for the entire forest type dropped to -689.3. The situation in 1969-1977 is different from the previous one especially with the forest types. While during that period, the pine forest type maintained a difference of +79.5 thousand acres, the other two forest types and the state’s total for all types saw some declines. The difference for the forest types shows hardwood with a drop of -1,908 million and oakpine with -276.3 thousand. The trends in the other periods (1977-1987, 1987-1994, 1977-1994, and 1957-1994) appeared somewhat similar in terms of gains except that, the acreage size of oak pine and pine showed various declines. During these years, the area of oak pine dropped by -299.27 acres in 1987 to 1994 and 227.87 from 1977 to 1994. Observe also that within that period in Table 2.1, the forest type pine declined by -529.4 acres in 1977-1987 and -878.06 in 1957-1994 (Table 2.1).Table 2.1. Differences in Forest Acreage by Forest Types in Millions
 |
| |
|
3.1.2. Percentage of Change
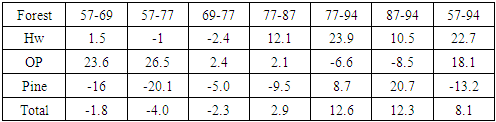
Regarding the percentages, Table 2.2 provides a presentation of the rates of change on the forestland area variables. It also covers some comparisons of the different trends covered in the two previous Tables of 2 and 2.1 along with descriptions of gains, identified by a plus (+) sign and declines among the forest types and the state’s total of forest acreage. While these percentages were calculated for the study periods, Table 2.2 indicates negative change (declines) for all forest types and pines from 1957-1969. Based upon the information, only two forest types like hardwood and pine recorded gains. Additionally, from 1957-1977, the area of hardwood and pine and the combined forest size declined whereas oakpine posted some increases. With time, pine saw more falloffs of great significance in double digits levels than the other forest types. This occurred during the various periods most notably, 1957-1969, 1957-1994 and 1957-1977. Along these lines, the table (2.2) offers further insights with respect to percentages of change from 1969-1977. From the information, it is evident that the percentages of change seem to be at comparable levels of declines with the exception of the 2.4 percent gains by oak pine. Other notable points worth knowing stems from the rates of gain of 12.1 percent in 1977-1987 for hardwood and the 2.1 percent of change for oak pine as well as 2.9 percent increase in total acreage for the entire state of Mississippi. However, during the same periods, there were higher gains of 23.6 percent in 1957-1969 and 26.5 percent in 1957-1977 for oak pine. In 1977-1994 and 1957-1994, the percentages of change for forest types showed a mix of gains in double and single digits. Within these periods, total gains in acreage for all forest types in the state remained fairly stable with some indications of decline as well (Table 2.2). Judging from the analysis herein, there were some notable changes in forest acreages in Mississippi among the various forest types. The trends seem to have been evolving over the years in the study area. From the information so far, in spite of some recovery, forest acreage has been dropping in Mississippi. At the same time, the forest types and the total acreage of timber saw some changes as well. This reflects some of the socio-economic trends that took place in Mississippi for almost 50 years.Table 2.2. Percentages of Change of Forest Acreage by Forest Types
 |
| |
|
3.2. Forest Trends in the 2000s
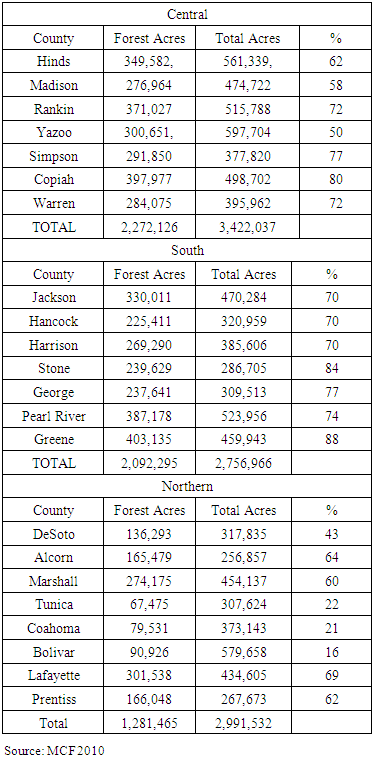
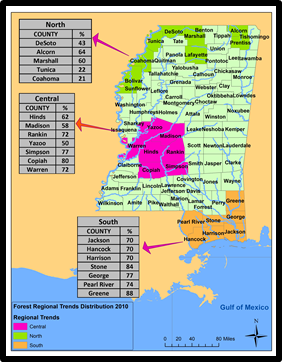
Regional patterns in the distribution of Mississippi’s forests offer some interesting perspectives. Of great importance in the state during the fiscal year 2010, is the dominance of certain areas of the state. For that, among the regions based on all categories from forested acres and the total, the central area outpaced the other regions. The central Mississippi zone contained about 2,272,126 to 3,422,037 acres compared to the 2,092,295-2,756,966 acres for the south and the 1,281,465-2,991,532 acres available in northern part. Added to that, the forest percentage of total land areas in the designated counties from central to the northern region of the state in 2010 ranged from high to medium levels much of the time with the exception of the three northern counties most notably Tunica, Coahoma and Bolivar where the percentage rates finished in lower levels (20, 21-16%). Just as Hinds, Copiah, Rankin and Yazoo did stand out in the central Mississippi region, Jackson, Pearl River and Greene counties followed up in the south alongside Marshall, Lafayette, and Prentiss in the northern area (Table 3).Table 3. Regional Trends in Mississippi Forest Land Use Distribution 2010
 |
| |
|
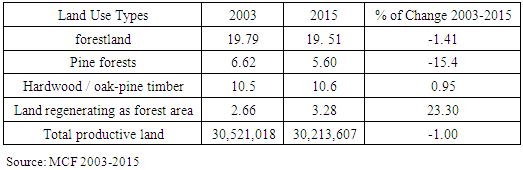
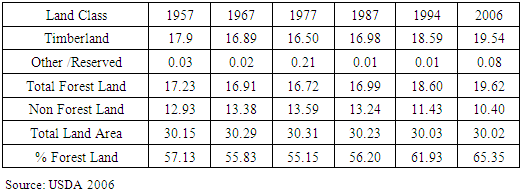
Considering that, the total productive land area of Mississippi for 2003 through 2015 ranged from 30,521,018 to 30,213,607 million acres. During the same period, forested land size, which opened at 19.79 million acres in 2003, dropped to 19.51 million acres in 2015. The same downward skid continued for Mississippi’s pine forests, which initially covered land areas estimated at 6.62 million acres in 2003 until it fell to 5.6 million areas in a span of twelve years in 2015. Even though the land acreages devoted to hardwood and oak pine timber rose from 10.5 million acres to 10.6 respectively, the state of Mississippi saw its regenerating forestland area but yet unclassified jump from 2.66 million to 3.28 million acres from 2003 through 2015. In the same periods, the rates of change from 2003-2015 not only showed that the state’s total productive land fell by 1 percentage point, but both forest land areas and pine forests posted declines of -1.41 to -15.4%. In the process, hardwood and oak pine timber alongside regenerating land in Mississippi maintained gains estimated at 0.95 to 23.30% (Table 4). In all these years, note also that woodland area stayed stable between 1957 through 2006 with some slight changes in different periods out of a total land area of 30.15 and 30.05 million acres. From the distribution of land area by class between 1957 to 2006, timberland area fluctuated continuously beginning with an opening value of 17.9-16.89 million acres during 1957 through 1967 followed by a rebound from 16.50-16.98 million acres which continued at 18.59 -1954 million acres. As the total forestland in the state showed similar patterns over time among the other indicators. The percent of forest land seemed stable at some periods particularly during a twenty year span from 1967-1987 with the values estimated at over 55 percentage points compared to the 1994 and 2006 levels of 61.93-65.35% (Table 4.1). Table 4. Forest Area Types Distribution, 2003-2015 in Mississippi (Million acres)
 |
| |
|
Table 4.1. Forest Area by Land Class (Millions of acres) 1957-2006
 |
| |
|
3.3. Threats of Forest Wildfires
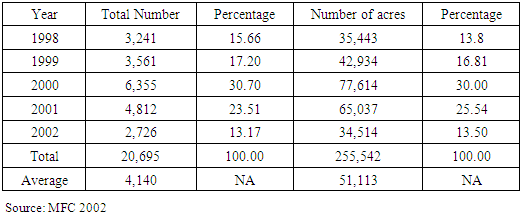
Part of the daily challenges confronting Mississippi forests over the years, involves the threats of forest fire outbreaks as manifested by their percentage and the number of acres gutted. Under the statewide five year monthly tracking of wild fires from 1998-2002, the state experienced 20,695 incidents at an average of 4,140 cases. Given the initial avalanche of forest fire incidents numbering over 3,000 (3,241-3,561). With time, the opening phases of the incidents showed visible increases all through 1998-1999, and by the fiscal year 2000-2001, the frequency of the fire events soared to 6,355 and 4,812 until it dropped to 2,726 in 2002. With the overall areas ravaged by fire under the five-year period at 255,542 acres statewide, the size of forestland acres gutted by fire from 1998 through 1999 stood at 35,443-42,934 acres. In the following periods, of 2000-2001, the state of Mississippi not only saw 77,614-65,037 acres of forest land destroyed by fire, but the size of land area under fire outpaced the other years coupled with the 34,514 acres lost to fire in 2002. Just as the percentages of wildfire incidents and number of acres of state wildfire were in the low and high double digits of 15.66-17.20% and, 13.8-16.81% between 1998 through 1999. During the periods of 2000 to 2001, the percentage levels for the total number of wildfire and the size of forest land acres grew substantially mostly in the high double digit rates (from 30.70- 23.51% to 30.00-25.54 %). In the following period in 2002, the percentage rates of fire events statewide subsided by 13.17-13.50 respectively (Table 5).Table 5. State Wide Five Year Monthly Forest Wildfire Summary 1998-2002
 |
| |
|
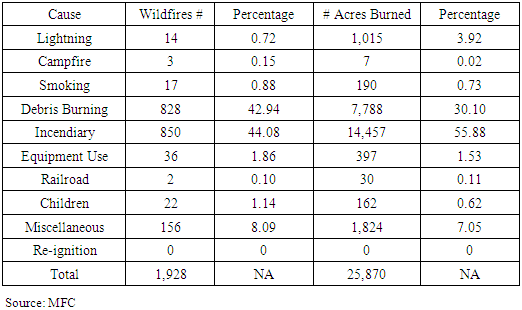
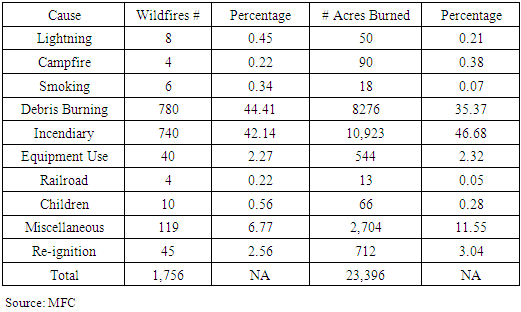
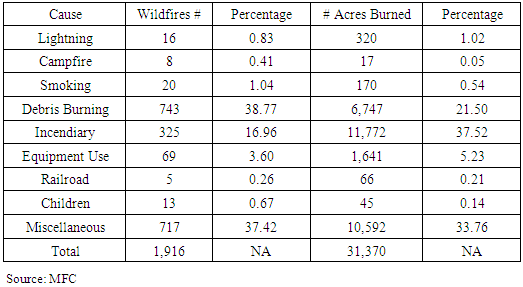
Regarding the frequency of forest fires and the acres burned all through 2014 to 2016, the total number of fires showed some fluctuations, which began at a high level of 1,928 cases in 2014 until it, dropped to 1,756 in 2015 only to increase again to 1,916 by 2016. The acreages burned by fire, which followed a similar pattern, indicate that the state had vast area measuring about 25,870 to 23,396 acres of forestland gutted by fire during 2014-2015. The problem went on unabated in 2016 as an additional 31,370 acres were razed by fire (Table 6,7,8).Table 6. 2014 Wildfires by Cause
 |
| |
|
Table 7. 2015 Wildfires by Cause
 |
| |
|
Table 8. 2016 Wildfires by Cause
 |
| |
|
From the rising frequency of the incidents, during the 2014 fiscal year and the other years, the two leading causes of forest fire outbreaks razing the state consists of mostly debris burning and incendiary events. These elements occurred at record numbers (of 828 to 850) and gutted more forested areas (7,788 - 14,457 acres) by fire (Table 6). In the following year of 2015, the reoccurring cases of debris burning and incendiary events estimated at 780-740 ignited additional forest land areas (8276 and 10,923 acres) (Table 7). The problems extended further into the 2016 fiscal year with additional 743-325 cases alongside the 6,747 and 11,772 acres lost to fire (Table 8).Another twist to the temporal distribution of wildfires by cause and acres burned involves the percentages. From the information on the table, the figures for debris burning and incendiary events hovered around very high levels (in the (order of 42.94%- 44.08 % and 30.10- 55.88%) in the fiscal year 2014. By 2015, the percentage distribution of the number of fire outbreaks and the causes involving debris burning, incendiary cases and the size of area gutted not only varied further (44.41% to 42.14% and 35.37%-46.68%). Nevertheless, in 2016 the percentages for both variables reached significant levels (3 8.77-16.96 and 21.50 to 37.52) followed by miscellaneous cases at 37.42 to 33.76 % (Table 6, 7, 8).
3.4. GIS Mapping and Spatial Analysis of the Trends
Seeing counties in the map distinguished in numerous colors, the evolving spatial patterns in forestland use change, consumption trends and challenges over time reflects common attributes among the forest regions of Mississippi. Accordingly, the map depicting the state forest legacy area (SFLA) high priority forestland in 2010 points to a combined cluster of hardwood and open pine forest areas classified under the urban category of various land uses. Notwithstanding the vast presence of pine spread across the counties, see the gradual dispersal of state forestland priority denoted in green in different localities of Mississippi. With that comes the concentration of mixed forest and water logged areas dispersed across the lower side of the study area and solidly firm in the southeast (Figure 2). In the context of the Mississippi Forest legacy areas at the regional level, it is evident that of the three existing forest availability categories in the state, the areas under the south eastern zone stands out as the largest area followed by the north east and the central regions (Figure 3). Of great importance in the spatial distribution of areas under the central region is the presence of a mix of urban and rural counties. The urban counties stretch through the uppermost areas adjacent to heavily built up corridors in central Mississippi made up of Rankin, Madison, and the rural area of Simpson on the lower edge of the region. Such spatial configuration raises future concerns about the potential spillovers of urbanization into forested areas.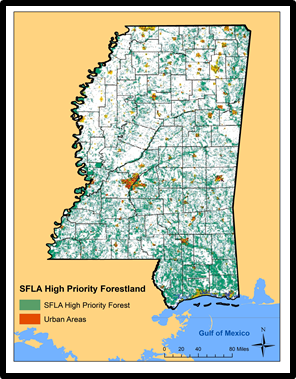 | Figure 2. SFLA High Priority Forestland |
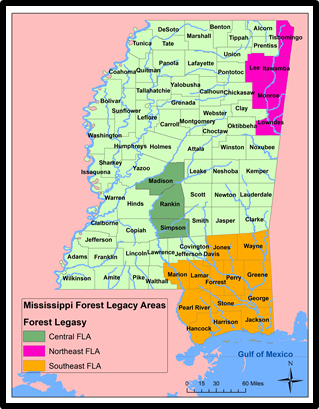 | Figure 3. Forest Legacy Areas in the Regions |
Regarding the status of operating wood mills in terms of active and declining types since 1997 and 2007, with both distinguished in purple and blue, there appears to be identical spatial distribution of these categories spread across the counties in the state from the north to southern part. Note that those localities in the upper northern edge of the state located near vibrant urban centers and visible water bodies may have experienced closure of wood mills facilities dating back to the 1997 period. Closely evident from primary wood using mills in 2007, are patterns depicting clusters of operating facilities mostly devoted to lumber represented in purple. Further, up to the upper left hand corner of the map in the Delta along the north east/west region known for its farming activities, one notices little presence of mills. Around the east central and southeast areas of the state, emerges further evidence of wood mills and areas with fading facilities dating back to 1997. The same spatial pattern continued on the southwest area of Mississippi where many active mills and pockets of lost wood facilities seemed concentrated on the southernmost zone of the state (Figure 4). Considering the significance of sustainable planning and the regenerative capacity of Mississippi’s forests in various areas of the state, the development of forest stewardship management plans appears quite uneven in some counties. This seems to be the case in the Central Mississippi region adjacent to the Delta where the design of forest stewardship stayed quite miniscule. In addition to that, the limited emphasis on forest stewardship plan as manifested in the central region from the map pales in comparison to the sustainable forest management practices prevalent among foresters in other counties. The observance of such sustainable practices seemed quite visible in the upper northern portion of the state, and the northeast region where the geographic distribution of stewardship plan development were quite remarkably robust with the sites in space extremely solid. Further onto the southeast and east central Mississippi region, similar adoptions of stewardship action plans were also quite evident given the concentration of numerous areas classified as having up to date forest management plans in the area (Figure 5).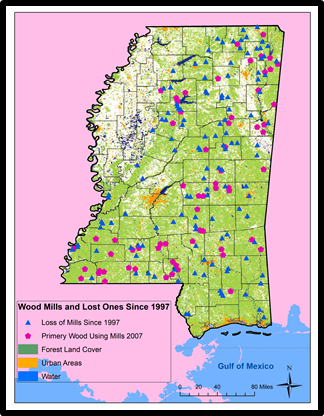 | Figure 4. Wood Mills and Lost Once Since 1997 |
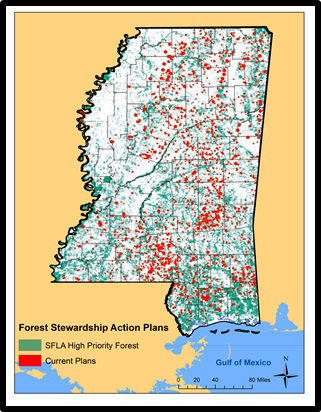 | Figure 5. Forest Stewardship Action Plans, 2010 |
The spatial dispersion of the percentage of forested area levels in the state covers a network of four classes. This involves those differentiated in dark green (numbering 8.17-28.8), light green (28.9-49.4), and the ones in orange classified under the 49.70 scale and those in red color (70.20-90.1). With the least area covering a scale of 8.17-2.88 in green, there came a gradual dispersal along the Mississippi Delta region of the map. Considering the sudden spread of the second category onto counties in light green adjacent to the lower delta followed by a few clusters in the northwest and eastern portion of the map. From there on emerges the second group of counties with medium percentage values (of 49.5-70.3) in forest areas visibly evident in central Mississippi alongside the group of counties located in the northern zone made up of the north central and north eastern areas and few counties in the south. Furthermore, the largest percentage scales as represented in red seems slightly concentrated along the upper northeast, and lower north central followed by a vast presence in the other geographic areas of the state from the southeast, southwest and the lower south (Figure 6).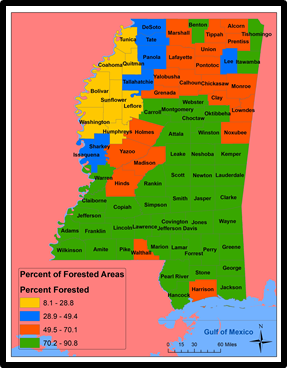 | Figure 6. Percent of Forested Areas, Source MFC, 2010 |
When it comes to threats to the forest sector of Mississippi, one need not look further than the spatial dispersion of wild fire risk areas over the years, total wild fire in 6 years in acres and the outbreak of southern pine beetle epidemic. To begin with, the areas under wild fire risks extend from some counties in the upper north to the central zone onto the lower southeast and the southwest. The total areas gutted by fire over a five year period are distinguished under five categories by different colors of green, light green, yellow and orange. These spatial patterns indicate the seemingly high dispersion of wild fire acres under the green and light green shades with estimated levels of 1.1173 and 1.174-2.169 acres visible in most counties. From the maps, even though, the vast concentration of the category remains quite evident in the northwest, the northeast and southwest. The next group of events involves the threats posed by the spreading of wild fire incidents across the state depicted in yellow (on land area measuring 2.970-6730 acres). Given a sketchy presence of these incidents in the upper north, the east central and the southern region, the largest acreages of forest land gutted by fire (in orange and red and measured at 6731-14,287 and 14,288-28,049) seemed sparingly concentrated in just a few counties in the lower southwest and one county in the northern region (Figure 7). The spatial dispersion of the outbreaks of southern pine beetle priority area from 1960-1996 shows the lowest number of years (of 1-4-5-8) in which the epidemic besieged the state. Those areas under the threats as represented in green and light green colors seemed prominent in counties along the lower half of the state. While the outbreak of the disease lasted a few years in most of the counties, the spread patterns followed the same path in years (9-12 years) in the northeast and southwest. Besides, the largest number of years of 13-16 and 17-20 in orange and red were concentrated in just a few counties in the lower southwest. From the mapping of the trends during 1993, 1997 and 2000, it is evident that there were changes in the dispersal patterns over the years. The array of variations appeared in different forms in the state in 1993 with some declines in the other years (Figure 8). On the dispersal of individual county percentage average distribution of forestland in Mississippi in 2010, the southern region outpaced the others (central and northern) at levels estimated at 76.4% -67.2% to 42% (Figure 9).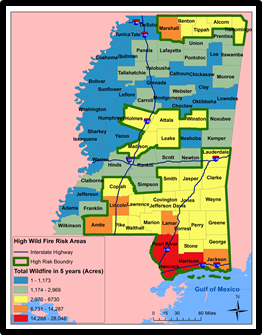 | Figure 7. High Wild Fire Risk Areas and Total Wild Fire in 6 years. Source: MCF 2010 |
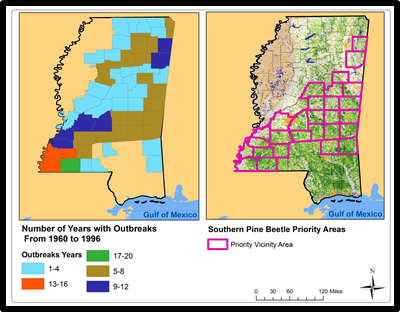 | Figure 8. Southern Pine Beetle Priority Areas 1960-1996 |
 | Figure 9. Percentage Distribution of MS Forest Regions, 2010 |
3.5. Factors Responsible For Variations in Forest Land use Activities
The changes in the forest sector emanate from some many factors. They consist of the challenges of physical (ecological) forces, the quest for economic benefits among the different players, the changing pace of demography and the continual encroachment of urbanization in the state.
3.5.1. Physical and Ecological Forces
On the physical side of things, the losses in some of the years may be associated with improper environmental management practices such as limited emphasis on proactive forest management plans. For example in the state of Mississippi where nearly 80% of forest ownership are in private hands, only 4 percent of these operators have adopted a management plan while the rest do not. Another thing from the findings involves the history of wild fires ravaging the forest landscape during the summer months in the last couple of years. The link between these occurrences and the changes in forest area cover is evident when one looks at the number of cases in Table 5-8. From 1998-2002, when the total cases of wild forest fire in the state stood at 20,695, over 255,545 acres of forest were lost in the process. On the average, the forest producing areas of the state experienced 4,140 cases of wild fires with the loss of 51,113 acres of forestland in the period. While a breakdown of the trend reveals there were more cases of forest fires in the year 2000 and 2001 than the other years, the number of forest fires in 1998, and 1999 seemed identical. Furthermore, when Hurricane Katrina made landing in August of 2005, the 1.7 million acres of forestland and 9% of the overall forest acreage in the state located in the Gulf coast counties on the path of the disaster saw severe destruction [22].
3.5.2. Economic Elements
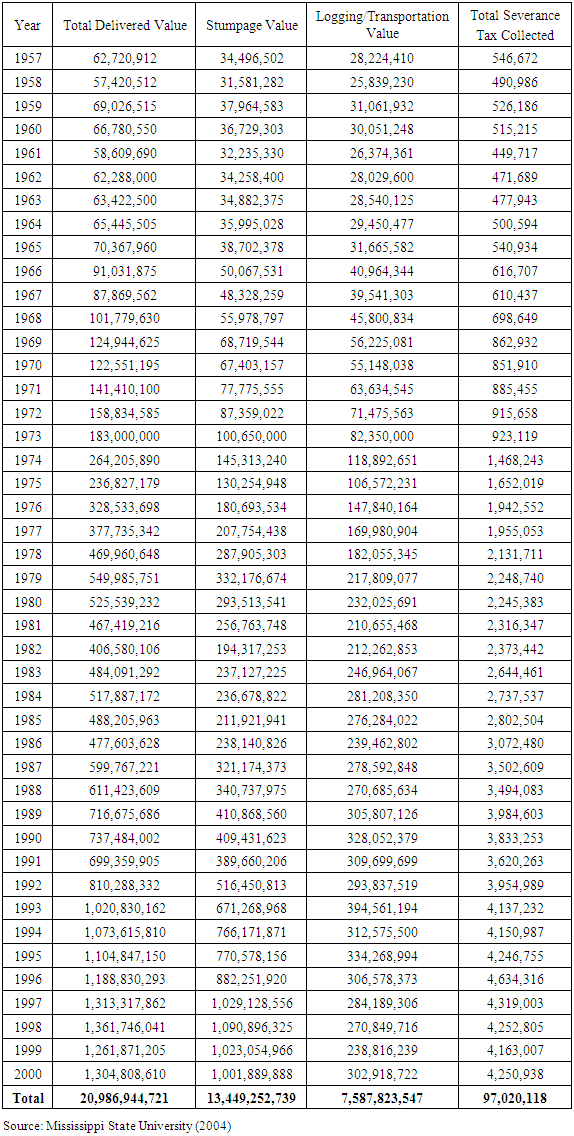
Another way of looking at the factors associated with changes in the forest acreage of the state of Mississippi is by putting the results into economic context. The historical summary of the economic trends listed in Table 9 contains information on the total delivered value, stumpage value, logging and transportation value and total severance tax collected from 1957-2000. The significance of the variables and their relationship with changing trends in forest cover is obvious, in 1957-1969 when total acreage of all forest types plummeted to -301.7 acres at a rate of -1.8%, the total delivered value rose by 99.2%. This represents an increase of $62,223,713 million dollars. As the study area experienced a loss of -689.3 thousand acres (-4.0%) in 1957-1977 fiscal years, the economic variable of total delivered value of forest products showed an increase of 502%. This represents a monetary equivalent of $315,014,430 million dollars. The economic pressure exerted on forestland areas in the state prompted by the enormous growth in the sector is further manifested with the billion dollar-marks reached in 1993 and 1994 in the delivery of forest products into the market place. Because of the economic benefits of the resource, the total severance tax collected in the same period grew by 50.8% from 1957-1969 and by 659% in 1957-1994. The same pattern holds for the periods of 1994-2000 as well. Under these settings, those who profited from the enormous monetary returns of the crop were induced into extensive harvesting due to favorable policies thereby putting pressure on forestland cover in the state. Table 9. E conomic Trends Associated with Changes in Forest Acreage (Harvest History) in Dollars
 |
| |
|
3.5.3. Demography and Urbanization
More so, the growth in population and rapid pace of urban sprawl and road constructions in areas adjacent to the forest producing regions may have altered the composition of forest types and total acreage in the state with encroachments into forest habitats. Considering the dynamic and continually fluctuating nature of Mississippi’s woodland, the key elements behind the change remains the impacts of human activities. With the state’s 2017 population estimated at 2.99 million inhabitants, the bulk of the rising population occurred in areas adjacent to the large metropolitan centers of the state. The areas comprised of Desotto County near Memphis, Tennessee, the counties near to the central Mississippi metro areas of Hinds, Madison and Rankin as well as the localities at Hattiesburg and the Mississippi Gulf Coast. At that pace, the emergent landscape form reflects a combination of forest and urban land cover repeatedly near to one and another [17].
4. Discussion
In the context of the analysis so far, it is clear that despite Mississippi’s land size, it boosts of massive strips of forests land types with significant environmental and monetary benefits for the state. With that, the forest ownership distributions among the various classes of operators consist of those under private and state control. Amongst the non-state category, family owned forest operations held the top spot with 12,146 thousand acres while business operatives followed up with 5,174 thousand acres. For the public category, the federal government kept possession of 1,834 thousand acres compared to the over 230 thousand acres of land listed under both state and local authorities. Considering the classification of information pertaining to the distribution of overall ownership concentration among different operatives across the state of Mississippi, 88.26% of that remains clearly in private hands with the remaining 11.73% controlled by public entities. Notwithstanding the predominance of private operations, the state of Mississippi still saw notable variations in acreages among the different forest types during the early years from 1957-1994 and the later periods of 2003-2015. While the trend has been evolving over time in the study area through a mix of gains and declines in forestland areas, one of the regular glitches facing Mississippi forests in the last several years encompasses the dangers emanating from the forest fire eruptions as shown by the rates and the number of acres destroyed. This seems compounded by several socio-economic and physical forces in the state. In view of that, the paper provided detailed analysis of forestland use trends using a mix-scale approach of temporal-spatial techniques connected to descriptive statistics and GIS based on economic, and forest data sets at the state and regional levels in Mississippi. Just as forested land area dropped from 19.79-19.51 million acres between 2003 to 2015, both forest land areas and pine forests showed declines of -1.41 to -15.4%. At the same time, hardwood and oak pine timber alongside regenerating land in Mississippi grew by 0.95 to 23.30%. Being a state where timber ranks highly amongst the most valuable agricultural crops within Mississippi’s counties. In the 1997 fiscal year alone, 83% of the counties in the state listed timber as a vital portion of local agricultural business.In addition to that, forestland distribution along the regions of the state not only provided some interesting dimensions on the available woodland stocks among the individual zones as shown in the enquiry, but the paper profiled the inventory of some portions of Mississippi in 2010. Taking into account all categories from forested acres and the total in the various regions, the central Mississippi area surpassed the other zones with about 2,272,126 - 3,422,037 acres. In spite of the elegant picture on regional timber inventory posted so far, the livelihood of their counties remain very vulnerable to the hazards posed by forest wild fires and southern pine beetle disease. From 1998-2002, Mississippi timber sector experienced 20,695 incidents of wild fires at an average of 4,140 cases. From the environmental and economic costs of forest fire and the damages attributed to debris burning practices and incendiary activities, it is clear that these elements occurred at higher levels in terms of frequency and forestland areas burned.Seeing the proficiency of GIS mappings in showing clusters of areas with vast forestlands, fading and active wood mills, stewardship plans and those threatened by fire, it did pinpoint areas affected by the dispersal of southern pine beetle disease across the state over the years. The problems militating against the management of forestland in the state stems from various socio-economic, ecological and physical elements associated with the state’s timber. Considering the increasing changes and distribution patterns as indicated in the size of forest types, forestland use trends, forest wildfire risks, regional timber stock, and forest ownership categories under private control, family and government hands. The investigative capability of mix-scale tools of descriptive statistics and GIS stayed remarkably proficient in pinpointing the spatial concentration of forestland trends throughout Mississippi. This required taking into consideration the extent and nature of existing timber legacy areas, land under forests, operating and lost mills, the years of fire outbreaks and the dispersal southern pine beetle diseases and regional forest distribution statewide. With the percentage of forest areas fully clustered along the upper northeast and lower north central areas, the gradual spread of forest stewardship management plans showed more presence all through the northeast and southeast portions of the state. Using GIS in that way to analyze the nature of forestland trends, regional forest composition, fire outbreaks, the operations of forest mills, and the adoption of plans throughout the state at the regional level as well as their patterns, advances current knowledge of the importance of timber resource inventory in sustainable forest management. This offers a template for analyzing opening and closing accounts of renewable resources in terms of shortfall and availability, and the distribution levels as well as the inherent threats statewide and regionally. In light of the observations made earlier in the research pertaining to forest ownership concentration, regional forest area composition, forest areas, timber mills operations and the adoption of forest action plans across various regions in the state and the threats of fire outbreaks and southern pine beetle diseases to woodland. The significance of highlighting these predictors did standout as timely effort given the economic contribution of forests, the slight gains and increasing declines in forest type acreages over time, the physical size of forestland and the dominance of family owned timberland statewide and the changes. Considering that, the efficiency of GIS in the enquiry comes from its capacity in highlighting the scale and spatial configurations of forest land use indicators. The research further proffered solutions ranging from forest plans, community involvement and social forestry, reforestation and monitoring programs, forest accounting and geo info systems to mitigate the threats to the forest sector. See Appendix A for details of the recommendations.
5. Conclusions
This part of the study highlights the closure of the research with timely insights on forestland under the following headings. (a) changes in forest indicators; (b)forest resources in abundance; (c) changes linked to many elements; (d) mix-scale model quite effective.Amongst the several interesting conclusions that came out of this enquiry as demonstrated from the analysis, the study area of Mississippi experienced some notable changes in forest acreages under the various forest types in the form of declines. Taking a cue out of the comparisons and the available information in spite of some gains that may be attributed to reforestations efforts by some operators, it is evident that the forest acreage has been dropping in the state. While the results of the temporal analysis indicates that the sector may have benefited from some recovery in acreages over the years, there exists a mix of gains and declines in the forest types total land area in Mississippi. Accordingly, the trends associated with declines seem to have been evolving over the years and there is a spreading of that in the state’s forest inventory. At that, the estimated loss of -688,300 acres in the period of 1957-1977 stood out as the highest. With average losses for 1957-1969 and 1969-1977 estimated as 344,650 acres, the combined losses in forest acreage in the years that were analysed stood at 1,378,600 acres. In all these, the results also showed declines for all forest types and pine in 1957-1969 and by 1957-1977, the trend continued as the area of hardwood and pine and the combined forest size saw some drop-offs as well. During the later years of 2003- 2015, forestland area dropped from 19.79-19.51 million acres. The state experienced further skids in pine forests land areas, which plunged, from the appraised values of 6.62 -5.6 million acres by the same period of 2003-2015. With the significance of forestry sector in the economy, detecting the level of changes in the form of declines likely to deplete timberland reserves and the benefits of the forest ecology, the enquiry, therefore ushered in a major step forward for tracing the scale of emerging deficits through enhanced strategies. Essentially, decision makers in that setting are better placed than ever with opportunities to assess the attributes and forms of the changes by looking at their effects with readiness. As the path to sustainable management, and better conservation practices, the temporal display of these losses, increases the ability of managers in tracking the rates and size of changes in forestland areas, and the thresholds for identifying critical periods deemed vulnerable to depletion. This should enable the state, the communities and regions develop sound approaches for lessening the impacts and threats of forests land declines. In so doing, the research adds a risk monitoring assessment side, which is vital in appraising forest depletion dangers and protecting timber dependent communities and the ecosystem from common exposures. Seeing that the deficits in forestland inventory as presented herein if unknown raises volatility levels in timber markets and revenue-earning potentials of counties, the ecological services of the lost areas does amplify the threats of degradation state wide. In the process, the study provided efficient ways of identifying potential challenges to sustainable forest management and this has a major upside.Outlining the vast potentials in forest assets in the study area as demonstrated in this research remains a major improvement from previous research. Building on that, the enquiry displayed the state’s huge tracts of timberland covered with several forests type stretching through many of the counties and regions with a notable environmental and economic benefit for communities in an unprecedented way. Mississippi’s millions of acres in forestland across regions and counties serve, also as refuge for biodiversity and as a carbon sink for greenhouse gases. With such vastness, over the years, the forestry sector in Mississippi maintained a prominent part as vital element of the state’s economy. Considering its huge timber assets, the state not only posted identical levels of gains measured at over the million- acre mark within multiple periods in the early years from 1957-1994. Further, along these lines, the regional component of the state’s forest assets reiterates the vast abundance in timber estimated in the millions of acres. In fact in the fiscal year 2010, central Mississippi not only contained largest tract of forestland measured at over 2-3 million acres. This numbers surpassed the acreages for the southern and northern zones of the state. Added to that, the forest percentage of total land areas across counties from central to the northern region of the state in 2010 ranged from high to medium levels much of the time. These potentials as revealed in the enquiry stands as major boost to timber market speculators and the forest dependent regions and counties whose revenue generation hinges on continual harvest. Taking into account the present level of timberland in some periods in Mississippi and the spectra of abandoned mills clustered across the regions, info on the available tracts as shown in his paper reaffirms the essence of periodic display of the state of forest assets state wide. Given Mississippi’s profile as an agricultural state with abundance of forest resources, highlighting the gains in acreages and surplus rates fundamental in its overall economy and those of the regions and counties remains quite promising to sustainable timber management. Indicating such capacities in timber management to the benefit of Mississippi exemplifies novel ways of undertaking certain aspects of forest accounting germane to the wellbeing of regions and counties. Building on the robust nature of forest inventory as presented in this study, great opportunities exists for a gradual revival of fading wood mills scattered all over the state in a way that would spur market potentials and continual access among producers.In keeping with the objectives of the research and the outcomes, the identification of various factors influencing changing trends in forest use garnered full attention. For that, much of the things that transpired in the harvest, marketing and declines in timberland acreages over time in the study area did not happen in isolation, they are associated with elements located in the larger forest sector of Mississippi. In tracing socio-economic elements and physical and environmental variables especially the threats of fire outbreaks, southern pine beetle disease, population change and market volatility or demands in a state rich in biodiversity and abundant timber landscape. The results does stand out as an important study contribution to knowledge with major points stressing the threats of southern pine beetle, thousands of fire incidents gutting vast areas of woodlands crucial to the economy and the surrounding ecology of the regions and counties of Mississippi. The same point holds for the dangers posed to forestland assets by population encroachment prompted by urban sprawl within the forest regions of the state. Knowledge of the threats of spatial dispersion of these stressors serves the needs of managers charged with the task of creating conservation measures tailored at monitoring areas at risk. Without these opportunities, decision makers will encounter arduous challenges in alleviating the threats ravaging the forest landscape. In view of the fact that the different elements implicated in the declines in woodland areas and the problems of forest wildfires triggered by bush burning and incendiary events in the study area did not garner full attention before. The role of these elements in inhibiting ecological-economic benefits of the sector given the shortfalls in the size of woodland through harvest and fire outbreaks deserves timely response from management agencies in charge of preserving timberland assets. From that, there are now ample possibilities to augment open space conservation with focus on timberland using the index designed in this enquiry. Accordingly, this research not only serves a concrete use, but the estimation of different scopes of change in the forest farm structure that went unspotted previously in the state might surface as a main concern for policy makers. The capacity of this enquiry to reveal factors responsible for declines or increases in woodland activities in the state of Mississippi shows state and regional analysis can provide instruments for augmenting sustainable woodland management central in the state’s forest policy. The assessment herein of linkages between variations in the forest landscape and the various elements is also an indication of the research capacity in detecting the predictors of change.The effective applications of fitting techniques comprising GIS and descriptive statistics under a mix-scale approach in this enquiry indicates that the study produced a proficient methodology in the analysis of forest trends, potentials and changes. From the use of the mix-scale approach, the study results evidently show that change in the form of gains and declines in woodland areas had occurred. The development and application of these techniques in the research did highlight the practicability of the methodology at the state level. The utilization of these techniques in the enquiry coupled with the outcomes originating from them, thus, contributes to our knowledge of forestland analysis and the viability of the sector. These devices are not only the rudiments of future schemes for combatting the challenges of forest management, but they remain the contours to future use in Mississippi. While the paper showed the role of mix-scale model as efficient instrument for assessing forest landscape variability, the descriptive statistics part of the approach using secondary data was crucial in stressing the portraits of change (gains or declines) and the capacities of the forest sector of Mississippi. With the precision to which forest statistics index gauged acreage decline and recovery levels of the crop across time, it is evident that descriptive statistics analysis was effective in tracking forest trends in the state over the years with the output of information useful to sectorial planning.Seeing its significance, GIS was contributory in picturing the extent of spatial dispersal involving changing trends in woodland distribution and activities within. Without such a temporal-spatial model, policy makers would have no chance of instituting credible policy improvements vital for effective woodland management, sustainable harvesting and conservation in the state. Considering the analytical proficiency of GIS in tracking timberland distribution patterns, management action plans within regions. Dissecting the dispersion of forestland use predictors as well as stressors such as southern pine beetle disease and fire outbreaks and the other elements of change is crucial in managing monetary and ecological assets of Mississippi’s forest landscape. From the extent of change in the forestland inventory in the state, the appropriate use of GIS in such situation remains central in pinpointing affected zones with relevance to decision makers bent on evaluating the indices. The exhibition of spatial info, comprising of scopes related with the distribution of forest legacy areas, conservation practices (management plans), physical and ecological predictors of forest fire and diseases, in pictorial form is particularly essential given its potential as a means of communication. For example, GIS maps are crucial in displaying to land managers which areas or woodland variables are vulnerable to volatilities linked with depletion. Being an area with many counties and regions heavily dependent on forest economy in vibrant ecosystems, the GIS maps provided preamble for managers for weighing spatial fluctuations in acreage coverage, management plans, forest operations, levels, composition rates, and probable ecological risks to forestland. Just as GIS mapping of forest cover provides valuable option for decision makers and resource managers for gauging the problems posed by extensive harvesting in the respective counties of the state. It enables them to formulate effective strategies for dealing with the problems confronting fading wood mills and areas with fluctuating forest cover. The implication of the outcome as shown herein poses numerous queries for future research and policy making that merits timely responses in the state, and they encompass the following: what form will the extent of forestland change assume in future years? Which new elements will drive such change? How will the state of Mississippi contain the mounting threats to forest management? How will Mississippi adapt to the changing temporal spatial trends unfolding in the forest sector? In what way will future policy influence forestland ownership and conservation practices? Given their importance to several facets of imminent strategies and welfare of communities in the state, managers must contend with how to frame the right responses to these enquiries in their policies. In view of that, existing plans can draw from this research utilizing these queries as a model to future analysis of forestland use operations and potentials with emphasis on how change influences income generation capacity of counties by limiting sustainable use of forest landscape. The benefit of the research is that it provided a set of pathways through which planners can build on as they design strategies suitable for their state to ensure sustained yield, access to forest landscape and sustainable use. Identifying these risks augments the ability of managers and government entities in focusing on forest districts at risk and those in need of intervention in the event of volatilities in the forest ecosystems.
Appendix - A
4.1. Recommendations To address some of the concerns identified in the current research, four recommendations anchored in sustainability are presented as part of the solutions.4.1.1. Forest Management PlansSeeing the growing pressure mounted on the state’s forestland areas and the adoption of management plans by only 5.0% of the operators, it is hereby recommended that forest landowners prepare woodland management plans. Since the path to successful forest management is a written management plan in which landowners delineate their objectives, record their current forest resources, and plan activities to accomplish their objectives in accordance with available resources. The management plan, once in place, must be adhered to unless circumstances justify changes. Such a plan not only has the potential of improving the management practices of operators, but it provides records of the state of the resource and response mechanisms for dealing with potential problems. Thus, a management plans stands as an essential document that landowners are constantly developing, implementing and reviewing. The other benefits of the plan are that they can contribute to good wildlife management, a healthy industry and employment. 4.1.2. Community Involvement and Social ForestryThe forest association of the State of Mississippi should continue to support an active community involvement in matters associated with the future harvesting of forest products in the area and the way it affects the natural environment. Although, the potentials for conflicts are abound due to different approaches to forest harvesting and management, the sector will benefit immensely from active community involvement from various groups whose welfare and the environment are impacted upon by the decisions made by forest landowners. Community participation of this nature should serve also as a forum for articulating proactive dialogue on conservation between underserved landowners such as minorities, women, aboriginals and government for the purposes of sustainability. In a state where ownership concentration of forest falls mostly under the control of private operators and state entities, involving others within the social strata in decisions dealing with the management of timber under the aegis of social forestry model in communities will add a novel dimension in the use of the resource. This would entail the desire to ensure the management, protection and afforestation of areas in Mississippi facing the threats of forest fire and deforestation with the purpose of promoting rural, social and ecological sustainability. 4.1.3. Reforestation and Monitoring ProgramsThe study area of Mississippi prides its self as a major forest producing area with forest accounting for the sizable proportion of revenues in dozens of counties. Yet, in the last several decades, the three major forest types of hardwood, pine and oak pine have come under extensive harvesting with major impacts on the total forest acreage. The occurrence of deforestation in tropical nations provides the state of Mississippi an opportunity to learn from the difficult experiences of timber producing nations of the world who went from being major exporters to importers. Such a trend indicates that lack of reforestation and monitoring program may come to haunt the sector in the near future. Accordingly, an effective reforestation program and monitoring should take the form of regular tree planting exercises capable of strengthening future access to the crop in the forest producing areas and the market place. In that light, this paper recommends the formulation of statewide reforestation and monitoring program within the forest producing regions of Mississippi. The state of Mississippi should also designate those regions facing severe cases of wild fires and clear cutting as special districts for reforestation and monitoring with some form of incentives and tax concessions for landowners.4.2.4. Forest Accounting and Geo Info SystemThe forest sector of the state of Mississippi lacks an integrated forest accounting and information system capable of tracking the acreage trends within the state’s forest ecosystem. The proposed forest information index should describe changes in spatial patterns of timber resource use and in the flows of wood material, as well as economic values in both the national and state economy. The core of forest accounting, i.e. the basic tables of wood material accounting, consisting of wood stock balance is an estimate of the annual changes taking place in the forest growing stock as consequence of biological tree increment, natural loss, and timber felling. It also includes data on forestry, the forest industries, other industries, and final consumption analyzed in accordance with the standard industrial classification used in national accounting. Analyzing the spatial dimensions of acreage trends from a forest accounting standpoint-using GIS not only helps in addressing management challenges facing the sector, but also it is critical to achieving the long-term economic and ecological needs of the users by computing and mapping the interactions between forestry, the environment and economic variables [23]. The design of such an integrated information system will offer decision makers access to the appropriate temporal-spatial data for monitoring the pressures mounted on the resource [24].
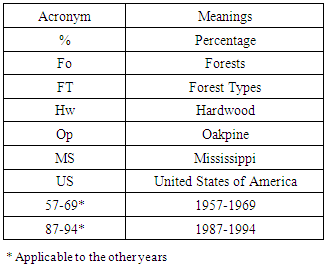
Acronyms
References
| [1] | Mississippi Forestry Commission. (2017). Protection Management Information Annual Report. Jackson, MS: State Forester’s Office. 1-13. |
| [2] | Mississippi Forest Association (MFA). (2003). Mississippi Forestry Facts: Promoting Sustainable Forestry In The Magnolia State. Jackson, MS: MFA. |
| [3] | Mississippi Society of American Foresters. (2000). MSAF Position Statement on Regeneration Harvesting and Forest Health on Mississippi National Forest. Jackson, MS: MSAF. |
| [4] | United Nations. (2017 a). Protection of Forest Fundamental to Security of Humanity’s Place on Earth. New York, NY: UN Economic and Social Development, Department of Economic and Social Affairs. Retrieved On 16th December 2017 From https://0x9.me/LiJal. |
| [5] | United Nations. (2017 b). United Nations Strategic Plan For Forests 2030. UN Forum on Forests Secretariat: Retrieved On 16th December 2017 From http://www.un.org/esa/forests/wp-content/uploads/2017/09/UNSPF-Briefing_Note.pdf –.pp1-2. |
| [6] | United Nations. (2017 c). UN General Assembly Forest Instrument-Resolution. New York, NY: UN General Assembly. Retrieved On 16th December 2017 From http://www.un.org/esa/forests/documents/un-forest-instrument/index.html. |
| [7] | United Nations. (2015 a). International Arrangement On Forests. UN Economic and Social Development Department of Economic and Social Affairs Retrieved On 16th December 2017 From http://www.un.org/esa/forests/documents/international-arrangement-on-forests/index.html. |
| [8] | United Nations. (2015 b). Global Objectives on Forests Retrieved On 16th December 2017 From http://www.un.org/esa/forests/documents/global-objectives/index.html.UN Economic and Social Development | Department of Economic and Social Affairs. |
| [9] | Munn, I. A. and D. Cleaves. (1999). In: Abt, K. L. and R. C. Abt. Southern Research Station, Research Triangle Park, NC. Proceedings of the 1998 Southern Forest Economics Workshop. |
| [10] | Merem, E. C. (2016). Assessing The Environmental Impacts of Agricultural Subsidy In the Mississippi Delta Region Using GIS. International Journal of Agriculture and Forestry, 6:1: 1-21. |
| [11] | Merem, E. C. (2015). GIS Assessment of Farm Landscape Change in South Carolina Lower Region. International Journal of Agriculture and Forestry. 5:2: 92-112. |
| [12] | Merem, E. C. 2014. Assessing Agricultural Landscape Change In Northern Mississippi Region. World Environment, 4:2: 43-60. |
| [13] | Merem, E. C. (2012a). Tropical Landscape Change and the Role of Agroforestry In Southern Nigeria. British Journal of the Environment and Climate Change. 2:3: 285-319. |
| [14] | United Nations (2017d). Landmark Target Set To Increase World’s Forests by 120 MN Ha By 2030. New York. NY: UN Economic and Social Development, Department of Economic and Social Affairs. Retrieved On 16th December 2017 From http://www.un.org/esa/forests/news/2017/01/vision-for-forests-in-2030/index.html. |
| [15] | United Nations (2017e). More Sustainably Managed Forests Would Help Meet Energy Needs of 1/3 of World Population. Retrieved On 16th December 2017 From http://www.un.org/esa/forests/news/2017/03/idf2017-un-press-release/index.html. |
| [16] | American Forest and Paper Association. AFPA. (2017). Mississippi State Industry Economic Impact. Washington, DC: American Forest and Paper Association. Retrieved On 16th December 2017 From http://forestryimpacts.net/reports/mississippi/MS.pdfhttp://forestryimpacts.net/reports/mississippi/MS.pdf. |
| [17] | Mississippi Forestry Commission (2016). 2015-2016 Forest Inventory North Region Mississippi. Jackson, MS: MFC 1-15. |
| [18] | Henderson, J.E., I.A. Munn. (2013). The Economic Impact of Forestry and the Forest Products Industry on Mississippi’s Congressional Districts. Forest and Wildlife Research Center, Research Bulletin FO 449, Mississippi State University. 12. |
| [19] | Daniels, B. (1999). The Importance of Forest Management and Timber Harvests in Local Economies A Mississippi Example. Southern Perspectives 3:2:6-7. |
| [20] | Fickle, J. (2001). Mississippi Forests and Forestry. Jackson, MS: University Press of Mississippi. |
| [21] | Mississippi Forest Commission. (2010). Mississippi Assessment of Forest Resources and Forest Resource Strategy. Jackson, MS: Mississippi Forest Commission. |
| [22] | Glass, P. (2006). Initial Estimates of Hurricane Katrina Impacts on Mississippi Gulf Coast Forest Resources. Jackson, MS: Mississippi Institute For Forest Inventory. |
| [23] | Merem, E. C. (2012b). Using GIS and Climate Risk Information Systems to Analyze The Vulnerability of Coastal counties in Louisiana and Mississippi. Resources and Environment. 1:1: 1-18. |
| [24] | Mississippi Forestry Commission (MFC). (2002- 2017). Protection Management – Information. Annual Report-s, Jackson, MS: MFC. |

 Abstract
 Reference
 Full-Text PDF
 Full-text HTML