-
Paper Information
- Next Paper
- Paper Submission
-
Journal Information
- About This Journal
- Editorial Board
- Current Issue
- Archive
- Author Guidelines
- Contact Us
International Journal of Agriculture and Forestry
p-ISSN: 2165-882X e-ISSN: 2165-8846
2018; 8(1): 16-25
doi:10.5923/j.ijaf.20180801.04

An Artificial Neural Network-Based Model for Predicting Boro Rice Yield in Bangladesh Using AVHRR-Based Satellite Data
 Abstract
 Reference
 Full-Text PDF
 Full-text HTML
Kawsar Akhand, Mohammad Nizamuddin, Leonid Roytman
The City College of New York, Department of Electrical Engineering, New York, USA
Correspondence to: Kawsar Akhand, The City College of New York, Department of Electrical Engineering, New York, USA.
| Email: |  |
Copyright © 2018 Scientific & Academic Publishing. All Rights Reserved.
This work is licensed under the Creative Commons Attribution International License (CC BY).
http://creativecommons.org/licenses/by/4.0/

Rice is the staple food of Bangladesh and plays a crucial role in its agro-based economy. Due to the ever-increasing population and decreasing agricultural land area, rice production has become a key issue for the Bangladeshi economy because the sector is under pressure from increasing food demand to maintain food security for its large population. This study demonstrates the successful application of Artificial Neural Network (ANN) and remote sensing satellite data in developing a reliable prediction model using Advanced Very High Resolution Radiometer (AVHRR) sensor-based vegetation health indices (the Vegetation Condition Index (VCI) and Temperature Condition Index (TCI)) and statistical yield data to predict Boro rice yield, the main rice variety in Bangladesh. We compared the predicted yield data with the actual Boro rice yield statistical data. The results obtained from this model are highly promising given that the error of prediction is less than 10%. This model is fundamentally important to the government, agricultural stakeholders and policy makers for monitoring food security and for planning crop production and trade.
Keywords: Prediction Model, Artificial Neural Network, Remote Sensing, Vegetation Health, Rice Yield
Cite this paper: Kawsar Akhand, Mohammad Nizamuddin, Leonid Roytman, An Artificial Neural Network-Based Model for Predicting Boro Rice Yield in Bangladesh Using AVHRR-Based Satellite Data, International Journal of Agriculture and Forestry, Vol. 8 No. 1, 2018, pp. 16-25. doi: 10.5923/j.ijaf.20180801.04.
Article Outline
1. Introduction
- An accurate and timely method of crop yield prediction can help to ensure an uninterrupted flow of goods and services among the producing, processing, and marketing sectors of agriculture while minimizing the uncertainties accompanied with production, prices, trade and reservation. Bangladesh is one of the highly populated countries globally; close to 160 million people live on a land mass of 147,570 km2, where agriculture plays a pivotal role in growing its economy, improving food security, reducing poverty, generating employment and bringing prosperity to its citizens. Agriculture is the single largest contributor to its economy and makes a significant contribution to the nation’s employment and Gross Domestic Product (GDP)-around 45% of the total labor force is employed in this sector and contributes about 17% of the country’s GDP [1]. Bangladesh is essentially an agro-based developing country where people’s livelihood and economic progress is predicated on agriculture, because around 76% of its total population lives in rural areas and 90% of the rural population is directly or indirectly dependent upon agriculture which is the main source of their income [2]. Rice is the main agricultural crop and the primary staple food of Bangladesh; almost 90% of the population depend on rice for their carbohydrate demand and is widely cultivated all over the country throughout the year. Rice accounts for 94% of all the food grains produced annually-about 75% of the total cropped area and more than 80% of the total irrigated area is planted to rice [3]. Bangladesh has acquired a respectful position among major rice producing and consuming countries-it is the fourth highest rice producer and consumer globally. Despite the lack of resources and only a few potential initiatives, the country has successfully achieved self-sufficiency in rice production [4]. Therefore, rice production has a strong interconnection with its sustainable economic development and overall national progress.In Bangladesh, there are three major rice varieties namely, Boro, Aman and Aus cultivated in three different seasons, their respective contribution to the total annual rice production is 55%, 39%, and 6%, respectively [1]. Boro is the dominant rice variety, accounting for more than half of the nation’s total rice production. Based on the agro-climatic properties of different rice crop along with the seasonal variability of temperature, moisture, and rainfall, the cultivation season of Boro rice is from December to May, Aman rice cultivation season is between July and December, whereas the cultivation season of Aus rice is April to August [5]. Rice plant is a type of grass that requires high temperature and adequate moisture for its growth and development. It is best suited for an area with high humidity and temperature, prolonged sunshine hours as well as an assured supply of water [6]. The favourable temperature and rainfall required throughout the life span of a rice crop ranges from 21 to 37°C and 1000-1500 mm, respectively. Bangladesh has witnesses three main seasons from a climatic standpoint– a hot and humid summer from March to May, a hot and humid monsoon season from June through October, and a cooler and drier winter from November through February. The annual average rainfall varies from 1,500 mm to 5,000 mm; similarly, the temperature varies from 12 to 35°C, whereas humidity varies from 65 to 90% [7]. Therefore, there is a strong correlation between weather conditions for rice cultivation and Bangladeshi weather. Importantly, the climate of Bangladesh is favourable for rice cultivation. Boro rice season starts during winter particularly when the duration of days is shorter during the month of December-February and ends during summers in the month of April-May. It is a two season-crop (winter and summer). To facilitate production, planting should ideally be completed before 7TH January [5]. During Boro rice growing season from January to May, the monthly average maximum temperature, minimum temperature and average humidity ranges from 25.2°C to 33.2°C, 12.5°C to 24.5°C and 71% to 79%, respectively. Every crop has an optimum temperature range for its growth. For Boro rice crop that facilitates maximum photosynthesis under Bangladesh’s climatic condition ranges from 25 to 30°C [8]. Temperature has a significant impact on Boro rice production. For example, overly hot and overly cold conditions are known to adversely affect crop production [9]. The life cycle of Boro rice crop is approximately 140-160 days, depending on the varieties of rice. It is divided into three phases: vegetative, reproductive and ripening phase. The vegetative phase assumes significance because it is characterized by the development of tillers and plant population. This phase denotes a critical stage of Boro rice life cycle because tillers are developed in the months of January and February when the temperature remains below 20ºC, which is less than minimum optimum temperature and causes the plants to suffer from cold injury. Because of low temperature and cold injury, the emergence and development of tillers takes place slowly. However, 90% of the Boro rice production depends on the 1st and 2nd steps of tillers [5]. The period of vegetative stage is from January to March. January and February represent the cold and dry winter seasons in Bangladesh, but March is a hot and humid summer season. After overcoming the cold injury, in March Boro rice plants commence the rapid development of tillers and leaves, resulting gradual increase in plant height also getting preparation for the reproductive phase. Therefore, February and March are critical months for healthy and dense vegetation development in addition to better production of Boro rice.The weather condition of an area such as temperature, humidity, precipitation, sunshine and atmospheric carbon dioxide plays an important role in determining its agriculture production [8]. Healthy vegetation is paramount for better rice production, which is closely related to both photosynthesis and Normalized Difference Vegetation Index (NDVI). Notably, NDVI is widely used as a measure of plant productivity, an indicator of the environmental resources and a determinant of ecosystem potentiality [10]. As the most widely used vegetation index that reflects vegetation properties, NDVI is calculated from the visible and near-infrared light reflected by vegetation. Healthy vegetation absorbs most of the visible light reaching it, reflecting a large portion of the near-infrared light. Therefore, NDVI values are much higher for vegetation as compared to bare soil, cloud and water [10]. NDVI and Brightness Temperature (BT) characterize healthy or unhealthy vegetation. The Vegetation Condition Index (VCI) and the Temperature Condition Index (TCI) characterize the moisture and thermal conditions of a particular area, respectively, derived from NDVI and BT [11]. For a given area, the VCI and TCI values have a very strong correlation between these indices and agricultural crop yields during the critical period of crop growth [12]. A high value of VCI corresponds to unstressed and healthy vegetation whereas a low TCI value corresponds to unhealthy vegetation due to thermal stress [13]. For the purpose of this study, we selected VCI data for weeks 5-8 within the month of February because during this period vegetation is more responsive to moisture and optimize plant population. Meanwhile we chose TCI data for weeks 9-12 within the month of March since this period is important for the formation of healthy vegetation; during this period, vegetation responds more favorably to temperature. Moreover, the data selection period (February & March) is known as the critical period of Boro rice life cycle since better production mainly depends on this period.Bangladesh’s weather stations network is currently not sufficient to adequately collect timely, accurate weather information for efficient crop monitoring and yield well before the harvesting period. It is very difficult to generate useful weather information about agriculture i.e., crop field development, greenness, and other healthy activities only for 35 surface observatories. Meanwhile remote sensing technology makes it easier to acquire information about an object or an area without being direct contact or physically interfering with that object or area. In addition, remote sensing technique makes it possible to collect real-time weather data from dangerous and inaccessible areas. Moreover, satellite data are available in a cost-effective, regular, accurate and timely manner. Therefore, remote sensing technology has been widely used in making predictions relating to crop yield. Remote sensing data are also available for applications and will continue to provide Earth observations. Furthermore, remote sensing techniques are capable of identifying and monitoring crop growing stages, crop vigor, biomass, crop classes and crop yield predictions, also making inferences about the status of plants as well as their environmental conditions on an almost real-time basis [14].The performance of a particular model depends on a number of factors, such as the volume of data, selection of model, the methods of validating results and the measures used for comparison. Statistical methods have traditionally been used for making prediction and classification. To this end, regression models are not perfect in forecasting complicated situations such as non-linear and extreme values data because of the linear relationship between the parameters. On the other hand, ANN is highly applicable on complex relations and scenarios where there is a strong nonlinearity between different parameters and crop production variables. Therefore, Neural Networks (NNs) methods have emerged as a very important tool for a wide variety of applications including making forecasts about crop production in areas where traditional statistical techniques have previously been used [15]. ANN refers to a mathematical model that processes information using a way in which the biological neural system such as the brain processes information [16]. Owing to its intellectual characteristics, ANN can be used to develop a model to forecast crop yield. In addition, ANN entails self-learning, compatibility and flexibility capabilities. The study aims to develop a reliable prediction model in order to predict Boro rice yield before harvest using ANN and AVHRR sensor based real time acquired satellite data. The model delivers a great performance based on the error of prediction and accuracy.
2. Materials and Method
2.1. Data
- Boro rice yield statistical data and remote sensing satellite data for the same period (1988-2011) were used in this research.
2.1.1. Boro Rice Yield Data
- Boro rice yield data were collected from Bangladesh Bureau of Statistics’ (BBS), which published ‘the yearbook of Agricultural Statistics’, and the ‘Rice Database’ of Bangladesh Rice Research Institute (BRRI) of the People’s Republic of Bangladesh [1, 17]. BBS is a governmental authority that conducts core statistics of agricultural crop and is also responsible for accumulating, compiling and disseminating crop statistics for the entire national system. On the other hand, BRRI engages with the research and development of rice production. The BBS regularly publishes official statistical data on significant aspects of grain production such as crop type, cultivation area, production, yield etc. in their publication “the Yearbook of Agricultural Statistics” to address the users’ needs. Therefore, it can be used as a reliable reference guide by policy-makers, planners, economists, researchers, international agencies and educationists in equal measure. There are two types of agricultural statistics: structural and annual statistics are conducted in Bangladesh. According to the Food and Agriculture Organization (FAO) guidelines, structural statistics is generated by collecting data through a full count/sample census, normally at an interval of 10 years. Similarly, annual agricultural statistics are generated by collecting data through annual/seasonal sample surveys. The annual statistical Boro rice yield data from 1988-2011 were used for this research and were calculated by dividing total Boro rice production (in tons) by the sown area (hectares) [1].
2.1.2. Remote Sensing Satellite Data
- National Oceanic and Atmospheric Administration (NOAA) operational polar orbiting environmental satellite mounted Advanced Very High Resolution Radiometer (AVHRR) sensor-based remote sensing satellite data were used in this study. AVHRR is an instrument (sensor) flown on satellite that measures solar energy reflected/emitted from the Earth’s surface in several visible as well as infrared bands. Satellite data were presented by weekly Normalized Difference Vegetation Index (NDVI) and Brightness Temperature (BT) collected from the NOAA Global Vegetation Index (GVI) dataset from 1998 to 2011. The GVI products are widely used as satellite data products for monitoring the vigor and density of green vegetation, estimating crop acreage, detecting plant stress and classifying land cover. The GVI was developed from AVHRR-observed reflectance/emission in visible (VIS, 0.58-0.68μm, Ch1), near infrared (NIR, 0.72-1.00μm, Ch2), and infrared (IR, 10.3-11.3μm, Ch4) wavelengths. Meanwhile the GVI dataset was developed by sampling 4 km2 Global Area Coverage (GAC) data to 16 km2 spatial resolution along with daily observations to seven day composite [12, 18]. NDVI was calculated by pre- and post-launch calibrated VIS and NIR reflectance as follows:
 | (1) |
2.1.3. Development of Vegetation Health Indices
- Vegetation health indices were developed from the fundamental properties of green vegetation, the reflection and emission of solar radiation in visible (VIS), near-infrared (NIR) and infrared (IR, ch4) of spectral channels. Healthy vegetation reflects less radiation due to high chlorophyll absorption of solar radiation within the VIS channel and reflects more radiation due to the scattering of light by leaf internal tissues and water content in the NIR channel. In addition, it emits less thermal radiation due to the transpiring canopy is cooler in the IR spectral band [5]. As a result, NDVI becomes large and BT remains small for healthy vegetation; this scenario reverses for unhealthy vegetation [19]. Vegetation health indices Vegetation Condition Index (VCI) and Temperature Condition Index (TCI) of a particular area were developed from its NDVI and BT using some processing and algorithms. The details of these methods and algorithms to calculate NDVI and BT from VIS, and NIR as well as IR spectral bands and GVI from NDVI, BT, are presented in Kogan [12, 20, 21]. This paper briefly mentioned some methods which include: (a) elimination of temporal high frequency noise (clouds, Sun and sensor angular effects, etc.) from NDVI and BT annual time series; (b) calculation of the mean annual cycle; (c) calculation of climatology from multi-years of data; and (d) estimation of medium-to-low frequency fluctuations NDVI and BT (departure from climatology) associated with weather variations. VCI characterizing moisture condition and TCI characterizing thermal conditions in response to weather impacts were calculated using the following equations:
 | (2) |
 | (3) |
2.2. Artificial Neural Network
- An Artificial Neural Network (ANN) simulation tool was used to develop a prediction model for this study. A nonlinear auto regressive with exogenous (external) input, or NARX time series, Neural Network was used for early predictions and the model development. An ANN refers to an interconnected group of “nodes” known as “neurons”, “neurodes”, “processing elements” or “units” - the basic building block to form a network which functions in the same manner as human central nervous systems. Fundamentally, ANNs are referred to as a “black box” approach. Similar as ‘black box’ technology, ANN has the ability to learn input–output correlation by training the input to produce the expected output [22]. NN training is accomplished in order to perform a particular task by adjusting the weight and bias values between the elements. As a consequence of adjusting or training the network, a particular input (target) leads to a specific output [23]. Figure 1 demonstrates that neural network performs adjustment process until the output matches the target based on a comparison between them.
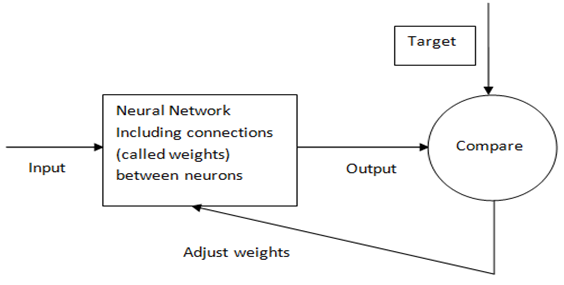 | Figure 1. Artificial Neural Network (ANN) basic principle diagram |
2.3. Proposed Model
- The proposed model is a multi-layer feed-forward back-propagation ANN used in order to develop a Boro rice yield prediction model for Bangladesh, as illustrated in figure 2.
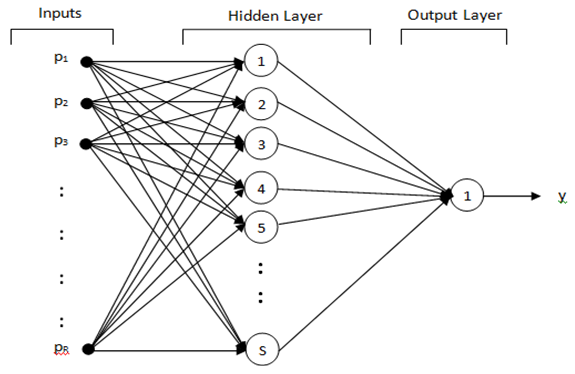 | Figure 2. Feed-forward back propagation ANN with layers and connections |
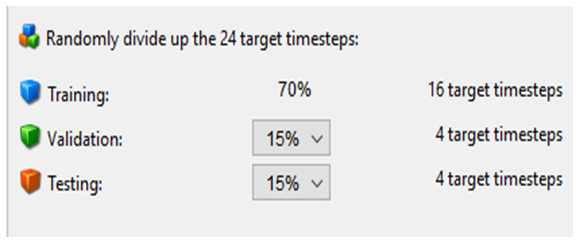 | Figure 3. Simulation window of Data division for training, validation and testing |
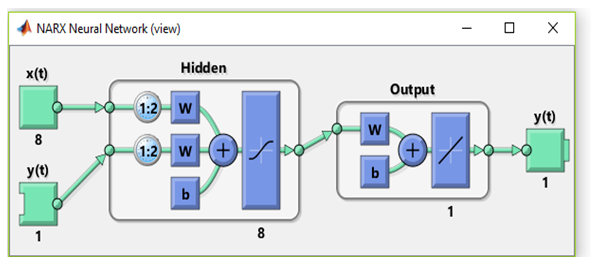
 The selection of neurons for the hidden layer is one of the main challenges in designing an ANN. The number of neurons in the hidden layer impacts the learning capability, complexity, generalization, and accuracy of the problem. Therefore, the selection of an appropriate number of neurons for the hidden layer suffices to ensure the complexity of the problem. However, if this becomes too large, it may lead to the over-fitting of the training set and loss of generalization ability. Hence, trial and error method is the ideal way of selecting hidden neurons. The proposed model, which reflects a time series prediction model, is composed of two types of inputs: (a) weekly VCI & TCI time series data and (b) Boro rice yield time series data. Here, y(t) in equation ‘4’ refers to the Boro rice yield time series whereas x(t) signifies the weekly VCI & TCI time series. The values of Boro rice yield time series are forecasted using this time series as well as VCI & TCI time series. This type of prediction is called nonlinear auto regressive with exogenous (external) input, or NARX. It can be written as:
 | (4) |
 | Figure 4. NARX Neural network Boro rice yield prediction model simulated diagram |
|
3. Results and Discussion
3.1. Performance Analysis (Validation)
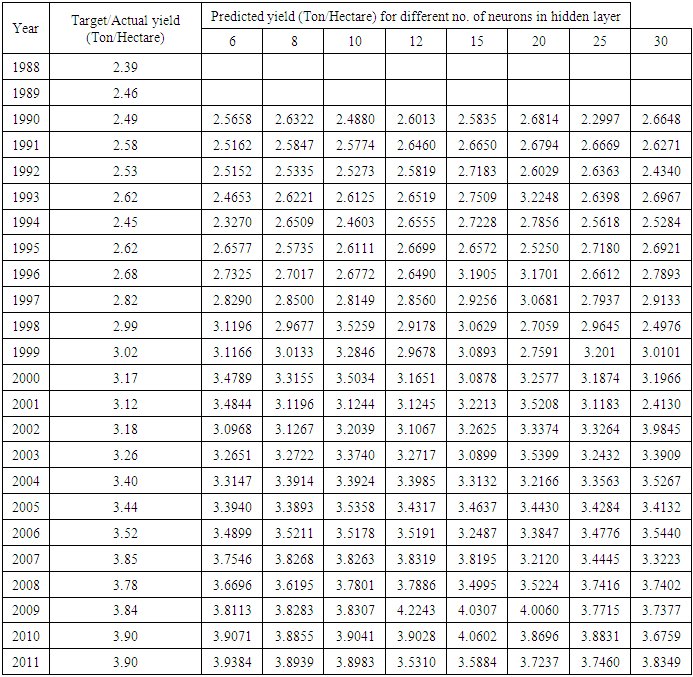
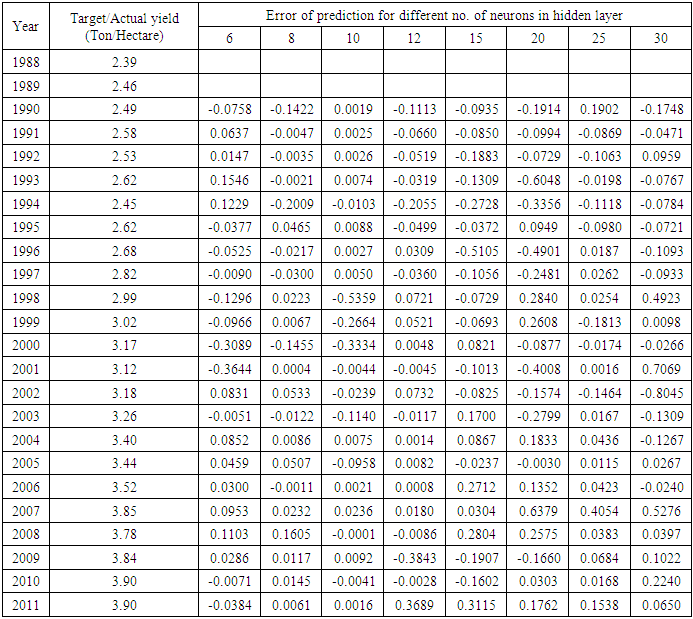
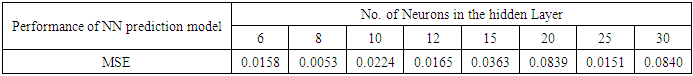
- The performance of the proposed feed-forward ANN prediction model is evaluated and selected using the error of prediction for different neurons within the hidden layer, as illustrated in table 2. With a view to determine the best performance, the Mean Square Error (MSE) - which is the average squared error between the actual (ya) and the predicted (yp) data - is calculated for different hidden neurons using the following equation and the result shown in table 3.
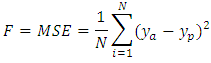 where N represents the number of samples 22 (1990-2011) shown in column 1, ya denotes the actual Boro rice yield shown in column 2, yp is the predicted Boro rice yield shown in column 3-10 in table 1 and ey = (ya - yp) refers to the error between the actual and predicted Boro rice yield, as shown in column 3-10 within table 2. The performance of NN (based on MSE) for different hidden neurons is illustrated in table 3; it is seen that optimum outcome occurs for 8 hidden neurons which was selected for our proposed model to predict Boro rice yield in Bangladesh. The model performance assumes significance because the final mean square error is small.
|
|
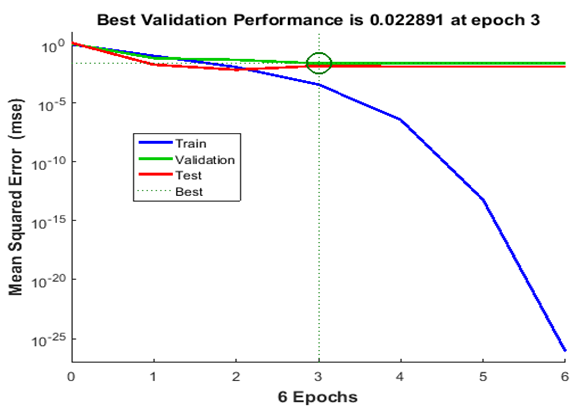 | Figure 5. Neural Network training performance plot with best validation performance |
3.2. Data Relationship Analysis
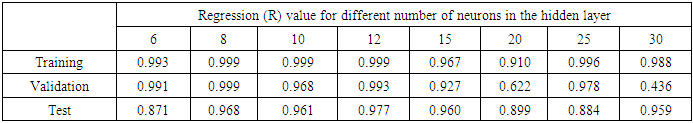
- Regression value generated by ANN simulation during network training is a good indicator to determine the strength of the relationship between Boro rice yield actual data and the corresponding predicted data. It was ascertained whether network training signified the perfect target and predicted values were the same, but it happened rarely during practice. Regression plot shows the relationship between target and output of the network. In our proposed model, regression plots for training, validation, testing and all data sets represented by four axes are illustrated in figure 6.
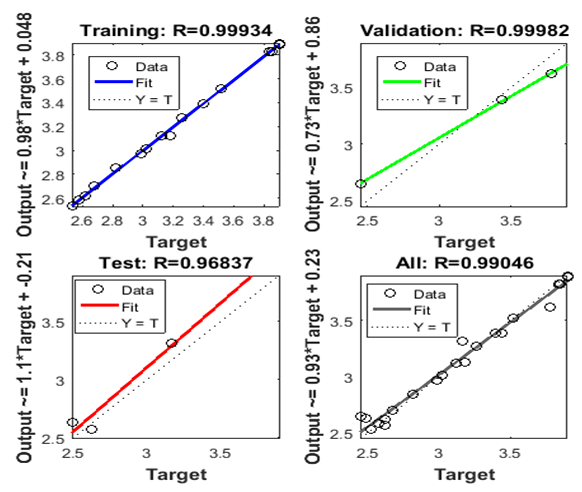 | Figure 6. Model regression plots for training, validation, test and all data |
|
3.3. Model Accuracy Analysis
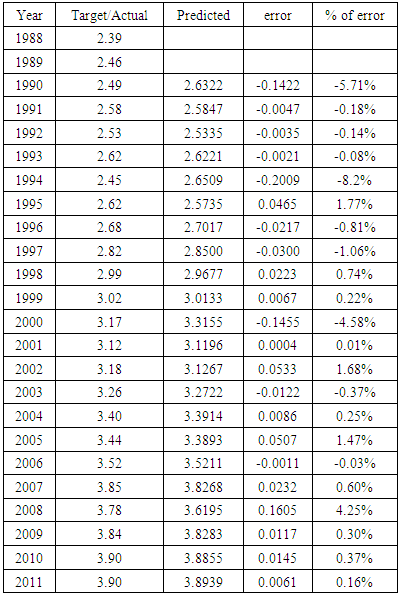
- The accuracy of our model was evaluated based on the comparison between actual and predicted data. To select the optimal model, we tested ANN for varying number of neurons (6, 8, 10, 12, 15, 20, 25 & 30) in the hidden layer and calculated the error of prediction as shown in table 2. We selected 8 hidden neurons for our model because the MSE was lowest in comparison to others, as shown in table 3. To determine the accuracy of the selected model, we calculated the percent error of prediction between the actual (target) Boro rice yield statistical data and the predicted data (NN simulated output). We calculated the percentage error of prediction using the following equation, the result shown in table 5.
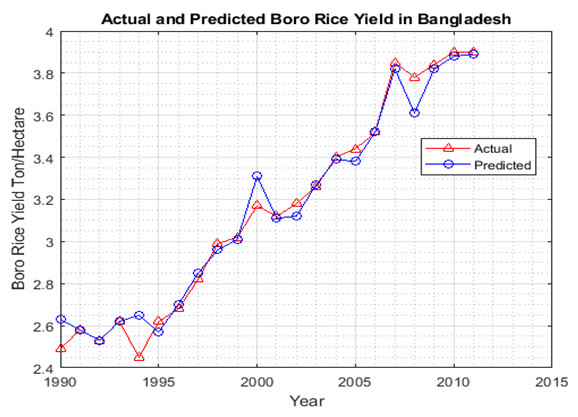
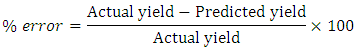 The accuracy of the model is examined by using data from table 5. Column 5 of table 5 shows that the percentage error of prediction for each of the 22 years (from 1990 to 2011) is very small. The maximum error is 0.2009 (8.2%), whereas the minimum error is 0.004 (0.01%). In addition, the percentage error of prediction for each year is less than 10% and 90% of these relative errors are less than 5%. These interpretations about the actual outcomes indicate that the proposed model has a high level of accuracy for predicting Boro rice yield in Bangladesh. Therefore, we can safely conclude that the ANN based prediction model is highly promising. In order to compare the target and predicted data in a more efficient manner, a graph is plotted using the two types of data. Figure 7 shows a graphical comparison of the predicted and actual Boro rice yield in Bangladesh. This graph represents a high degree of similarity between the predicted and actual values, which clearly indicates a high level of accuracy. Therefore, the credibility of ANN-based Boro rice yield prediction model being a potential simulation tool that can be used to produce a reliable and accurate yield prediction is reinforced; furthermore, this model can be applied for other crops as well. Hence, it is proven that ANN has a strong prediction capability.
|
 | Figure 7. Graphical comparison of the predicted and actual Boro rice yield in Bangladesh |
4. Conclusions
- The agriculture and rice sector in Bangladesh has remarkable profound impact on the food and livelihood security of its population. Reliable and timely yield prediction is an important source of information that enables the government, entrepreneurs and farmers to take preventive measures, avoid unpleasant situations, minimize the risks, and make well-informed decisions. This study developed a feasible prediction model to predict Boro rice yield in Bangladesh using ANN as a simulation tool and AVHRR sensor-based vegetation health indices characterizing both moisture condition (VCI) and thermal condition (TCI) as predictor variables. In order to develop an appropriate model, a different number of neurons within the hidden layer were tested, and it was found that the hidden layer with eight neurons generated the optimal prediction value. It was seen that increasing the number of neurons in the hidden layer did not contribute better prediction. This research showed that Boro rice yield prediction can be enhanced using the ANN and satellite data product VCI & TCI at approximately two to three months before the harvest at a prediction error of less than 10%. Therefore, this prediction model can serve as an important tool for planners, policymakers, economists, analysts, academics, educationists, researchers, NGOs as well as other stakeholders. This model is potentially applicable for other rice producing countries worldwide where remote sensing and statistical data are available for use.