International Journal of Agriculture and Forestry

p-ISSN: 2165-882X    e-ISSN: 2165-8846

2017;  7(3): 57-66

doi:10.5923/j.ijaf.20170703.01


Genetic Structuring of Four Tectona grandis L. f. Seed Production Areas in Southern India

Sreekanth P. M.1, Balasundaran M.2

1Department of Biotechnology, Cochin University of Science and Technology, Kochi, Kerala, India

2Environmental Biotechnology, Tropical Institute of Ecological Sciences Ecological Research Campus, Kottayam, Kerala, India

Correspondence to: Sreekanth P. M., Department of Biotechnology, Cochin University of Science and Technology, Kochi, Kerala, India.

Email:

Copyright © 2017 Scientific & Academic Publishing. All Rights Reserved.

This work is licensed under the Creative Commons Attribution International License (CC BY).
http://creativecommons.org/licenses/by/4.0/

Abstract

Teak (TectonagrandisL. f.) is a tree species indigenous to India and other South and East Asian countries. It produces high-value timber and is easily established in plantations. Reforestation requires a constant supply of high quality seeds. Seed production areas (SPA) of teak are improved stands used for collection of open-pollinated quality seeds in large quantities. Information on the genetic diversity of major teak SPAs in India is scanty. In this study we analyzed the genetic structure of four important seed production areas of Kerala State in south India by employing amplified fragment length polymorphism markers using ten selective primer combinations on 80 samples (4 populations x 20 trees). The gene diversity of the SPAs varied from 0.18 (Konni SPA) to 0.22 (Wayanad SPA). The percentage of polymorphic loci ranged from 61.3 (Parambikulam SPA) to 72.9 (Nilambur SPA). The mean combined gene diversity index (HT) of all four SPAs was (HT = 0.2395; SE 0.0100; p < 0.0001). Analysis of Molecular Variance (AMOVA) based on the two genetic clusters indicated that majority of genetic variation (75%) occurred within populations, while the variation between the two clusters was 25%. Nei’s genetic differentiation (GST = 0.17) Bayesian estimates (FST = 0.1433 SE 0.0436; P < 0.0001) supported the AMOVA partitioning and provided greater genetic diversity within seed production areas. A UPGMA dendrogram was prepared and showed that all twenty samples from each of Konni and Parambikulam SPAs clustered into two separate groups, respectively. However, five Nilambur genotypes and one Wayanad genotype intruded into the Konni cluster. The higher gene flow estimated (Nm = 2.4) reflected the inclusion of Konni origin planting stock in the Nilambur and Wayanad plantations. Evidence for population structure investigated using 3D Principal Coordinate Analysis of FAMD software 1.30 indicated that the pattern of clustering was in accordance with the origin of SPAs. The AFLP fingerprinting was capable of identifying the geographical origin of planting stock and thereby revealing the occurrence of errors in genotype labeling.

Keywords: AFLP, Teak, Genetic structure, Seed production area

Cite this paper: Sreekanth P. M., Balasundaran M., Genetic Structuring of Four Tectona grandis L. f. Seed Production Areas in Southern India, International Journal of Agriculture and Forestry, Vol. 7 No. 3, 2017, pp. 57-66. doi: 10.5923/j.ijaf.20170703.01.

1. Introduction

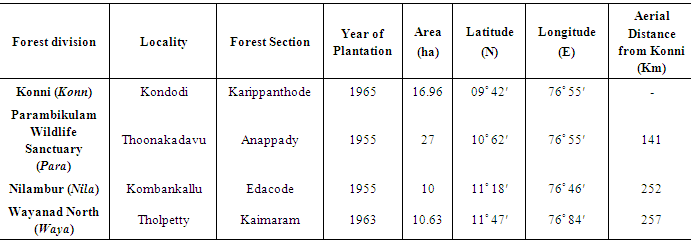
Teak (Tectona grandis L. f.) is indigenous to India and other South and East Asian countries. This species produces high-value timber, is fast growing and is easily established in plantations. These factors make teak one of the most promising species for sustainable production in the tropics [1] [2]. Teak is widely planted in commercial plantations in areas of its original range of tropical Asia and as an introduced species in Africa, Central and Latin America. Teak plantations account for 5 to 8 percent of the total forest area in the tropics [3] and comprise 90 percent of the quality hardwood plantations raised for timber production [4]. Presently, about 1.5 million ha of teak plantations exist in India and around 50,000 ha are replanted annually [5]. After completion of one rotation period, teak plantations are clear-felled and then replanted with seedlings raised from improved seed sources, such as seed orchards and seed production areas (SPAs). A seed orchard is a plantation of selected clones or progenies protected from pollen contamination from outside the orchard, and managed to produce abundant and easily harvested seed crops [6]. Generally, seed production areas are stands of suitable provenances raised from seeds of a reasonably large number of unrelated trees and managed specifically for seed production. But the quickest and the most common method adopted to establish a seed production area is to convert an existing stand of good growth and genetic quality [7]. Such SPAs are highly relevant for long-rotation crops like teak since they assure immediate availability of adequate quantities of seeds.
In India, the first teak plantation was planted along the banks of river Chaliyar in Nilambur, Kerala, south India, during 1842 (Fig. 1). About 2.28 ha of this original plantation still exist as a permanent preservation plot. At present, 75,300 ha of teak plantations are spread over various forest divisions of Kerala, including Wayanad, Nilambur, Parambikulam, Achenkovil, Konni, Ranni and Malayattoor [8]. There is no record of origin of planting stock, but it is likely that earliest teak plantations originated from seeds collected from nearby natural forests. The harvestable age of teak ranges from 50 to 60 years in different forest divisions. An average of 1000 ha of teak plantations are clear felled and replanted each year after reaching harvestable age in Kerala. Since seed availability from clonal seed orchards is extremely poor, the nursery stock (stump/root trainer seedlings) is raised using seeds collected from plantations converted to SPAs [9]. An SPA of teak is usually referred to as a phenotypically superior stand comprising vigorously growing trees, upgraded by thinning and culling infected and poorer phenotypes, and then managed to produce abundant seeds. So far 5,000 ha of SPAs have been established in India [10], of which, about 1250 ha are in Kerala [11].
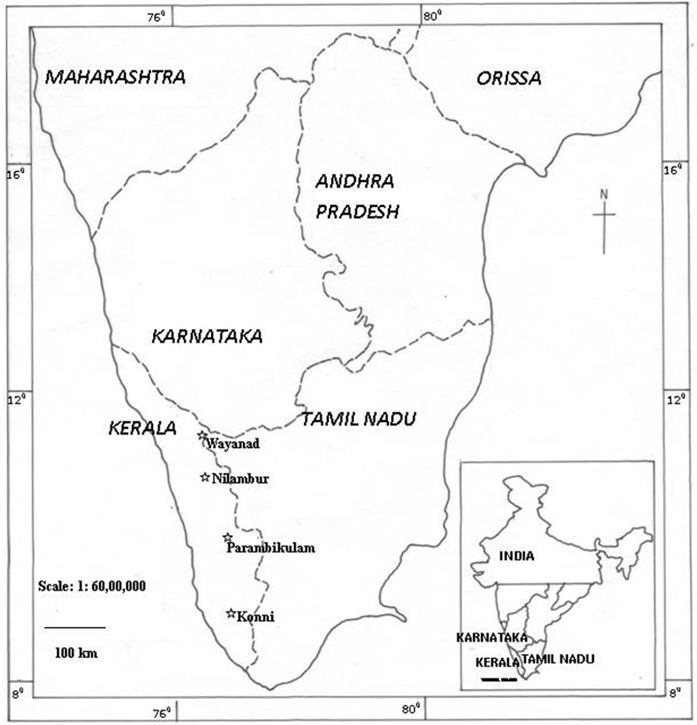
Figure 1. Map showing the location of the four seed production areas of Kerala selected for AFLP analysis
The average productivity of teak plantations in Kerala is 2.423 m3ha-1year-1 for a 53 year rotation period as compared to the expected 4.98 m3ha-1year-1 at the same age if properly maintained [5]. One of the reasons for this low productivity could be poor-quality planting stock raised from poor-quality seeds. The teak SPAs located in different climatic regions of Kerala, showed considerable variation in edaphic factors which might also influence the performance of SPAs. Prabhu [12] reported that quality nursery stock raised from source-identified improved seeds resulted in increased production of teak plantations. Maintenance of genetic diversity in breeding populations of commercially valuable species is considered to be a priority for any breeding programme [13]. Also, trees are often introduced into highly heterogeneous natural environments; hence, genetic diversity in man-made forests is essential for their ability to counter-balance the effects of environmental changes [14]. For these reasons we studied the status of genetic diversity within and between the SPAs for teak in Kerala state on the southwest side of the Western Ghats of India.

2. Materials and Methods

Four younger SPAs (planted after 1954) located in four important geographic areas of teak plantations namely, Konni (Konn), Parambikulam (Para), Wayanad (Waya) and Nilambur (Nila) were selected for study (Fig. 1, Table 1). From each SPA, 20 trees were selected by using a line transect method. Sample trees were selected at intervals to collect 20 samples along the transect that was drawn at the broadest area of the plantation so as to obtain a true representation of the entire SPA. From these 20 trees, expanding leaves were collected for DNA extraction.
Table 1. List of Seed Production Areas (SPAs) selected from Kerala for AFLP analysis
     
DNA isolation and AFLP analysis
Total DNA was extracted from 0.5 to 1 g of fresh leaf tissues using the modified cetyl-tri- methyl ammonium bromide (CTAB) protocol of Doyle and Doyle [15]. Amplified fragment length polymorphism (AFLP) genotyping was carried out following the standard procedure described by Vos et al. [16]. The reactions were carried out according to the manufacturer’s protocol (AFLP® Analysis System 1 and Starter Primer Kit; Invitrogen Life Technologies, Inc., USA). The amount of DNA was adjusted to 250 ng for the EcoRI and MseI digestion at 37°C for 2 hours. Ligation of EcoRI and MseI adapters was done at 20°C for 2 hours. Five μL of the template DNA from a 1:10 diluted ligation mixture in TE buffer (10 mM Tris-HCl, 1 mM EDTA) was used for pre-amplification with the pre-amplification primer mix 1. Pre-amplification Primer Mix 1 consisted of an EcoR I primer (E-A), an Mse I primer (M-C), and dNTPs. Twenty cycles of amplification were carried out at 94°C for 30 seconds denaturation, 56°C for 60 seconds annealing, and 72°C for 60 seconds primer extension in PTC-100 Peltier Thermal Cycler (MJ Research, USA). The pre-amplification product was used for selective amplification with ten primer combinations: E-AGG/M-CTT, E-AAC/M-CTG, E-AAC/M-CTT, E-ACT/M-CAG, E-ACC/M-CTT, E-ACA/M-CTT, E-ACC/M-CTA, E-AGG/M-CAG, E-AGG/M-CTG and E-AGG/M-CAT selected out of 64 tested combinations. Primer labeling was performed by phosphorylating the 5' end of the EcoRI primer with 32P ATP and T4 kinase. Mix 1 and Mix 2 components were used for selective AFLP amplification in which, Mix 1 was composed of 5 μL of the labeled EcoRI primer and 45 μL of MseI primer. Mix 2 was made according to the protocol supplied by Life Technologies with the AFLP kit. Selective amplification was carried out using 5 μL of the pre-amplification product as the template DNA, 5 μL of Mix 1 and 10 μL of Mix 2. A touch down phase of thirteen amplification cycles was carried out initially, with the first cycle at 94°C for 30 seconds denaturation, 65°C for 30 seconds annealing, and 72°C for 60 seconds primer extension. The annealing temperature was reduced by 0.7°C each cycle during the following 12 cycles. The final 23 cycles were run at 94°C for 30 seconds, 56°C for 30 seconds, and 72°C for 60 seconds. Samples were denatured by adding an equal volume of formamide buffer (98% formamide, 10 mM EDTA pH 8.0, 0.05% bromophenol blue and 0.05% xylene cyanol) and heating at 94°C for 3 minutes. Five μL of each sample was run in a denaturing 6 percent, 0.4 mm polyacrylamide gel (1X TBE buffer) in a sequencing gel electrophoretic apparatus (Biorad, USA) at 40 A, 900 V for 2 hours. The gel was then transferred onto Whatman No.1 chromatographic paper, dried at 80°C for 2 hour on a gel drier (Biorad, USA) and exposed to X-ray film (Kodak®) overnight. Two replicates of the PCR reactions from independent DNA extractions were performed to confirm the accuracy of the AFLP analysis. Pre-amplified tomato DNA provided with the Invitrogen AFLP Starter Primer Kit as control for selective amplification was also utilized for checking the accuracy of the protocol. 30-330 bp AFLP® DNA ladder (Invitrogen Life Technologies, Inc., USA) was run on either side of the denaturing gel as the standard marker. The ladder was labeled with 32P ATP using T4 polynucleotide kinase according to the manufacturer’s protocol.
Data analysis
The developed autoradiogram was scanned using an HP Scanjet 3770 digital flatbed scanner and each scanned autoradiogram was transferred to a Kodak Digital Science 1D Image Analysis Software. Once the lanes had been marked and labeled, the loci observed on the images were compared with standard markers and I determined the molecular weight and mass of each developed amplicon. These bands were scored manually as '1' for the presence of a locus and '0' for the absence of a locus. Both polymorphic and monomorphic bands were included in the final data sets forming a binary matrix. Double reading of the AFLP profiles was also done as described by Bonin et al. [17] to limit the scoring errors of the data.
The binary matrix generated from this scoring was then used for further analysis with the software AFLP-SURV version 1.0 [18, 19]. This was used to estimate allelic frequencies at AFLP loci by applying the Bayesian approach with non-uniform prior distribution of allele frequencies [20]. This yielded unbiased estimates of allele frequency from AFLP data [20-22]. These allelic frequencies were used as input for computation of genetic diversity for each population following the method described by Lynch and Milligan [23] i.e. reducing of all loci with allelic frequencies less than 0.05. I calculated the proportions of polymorphic loci (PPL), expected heterozygosity HJ under Hardy Weinberg genotypic proportions (analogous to Nei's gene diversity H), average gene diversity within populations HW (analogous to Nei’s HS), total gene diversity (HT), the average gene diversity among populations in excess of that observed within populations HB (analogous to Nei’s genetic differentiation among populations, i.e. DST). Wright's fixation index (FST) or the proportion of total gene diversity that occured was measured as an additional estimate of genetic structure within and among species. The standard errors (SE) and total variance (Var) were computed for each genetic diversity parameters. The data matrices were grouped into the four populations and analyzed using POPGENE, Version 1.32 package for dominant markers assuming Hardy-Weinberg equilibrium, and pair- wise comparison of populations was made [24]. The relative amount of gene differentiation among populations was measured by the coefficient of Nei’s gene differentiation, GST, where GST = DST / HT. The rate of gene flow (Nm) for each locus was calculated using the formula Nm = 0.5 (1 - GST) / GST and mean value across loci was determined. The pair wise genetic distance [25] obtained were subjected to clustering using an Unweighted Pair Group Method with Arithmetic means (UPGMA). Bootstrap analysis of 10000 replicates was performed using Tools for Population Genetic Analysis (TFPGA) software [26]. Analysis of molecular variance (AMOVA) among and within populations [27] was performed using GenAlex 6.5. [28].
To quantify the genetic relationships of sampled trees across all four SPAs, AFLP data matrices from all the 80 trees were used to carry out cluster analysis using the package NTSYSpc Version 2.02 [29]. Genetic similarities based on simple matching coefficients were calculated among all possible pairs of trees using the SIMQUAL option and were then ordered into a simple matching similarity matrix. The matrix was run on a Sequential Agglomerative Hierarchical and Nested clustering (SAHN) [30] using UPGMA as the option [31].
PCoA analysis
Principal coordinate analysis PCoA [32] was performed using Simple matching coefficient (dis) similarity matrix with the software Fingerprint Analysis with Missing Data 1.30 (FAMD 1.30) to identify the number of groups based on Eigen values. This opens FAMD’s built-in 3D PCoA coordinate viewer screenshot automatically after PCoA has been performed [33].

3. Results

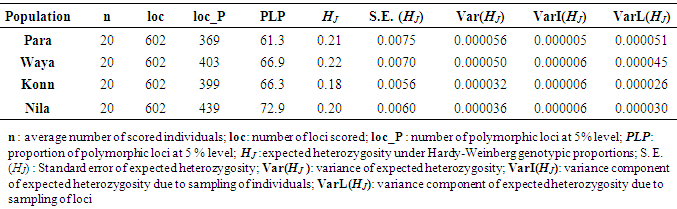
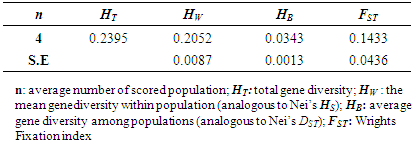
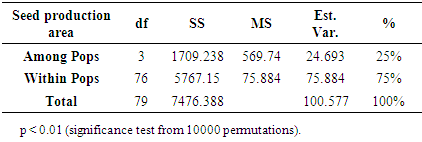
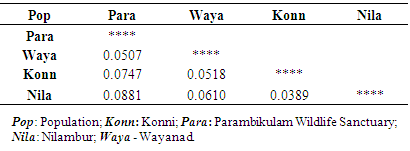
Genetic diversity within and among populations
Six hundred and two loci were scored for statistical analysis. The percent of polymorphic loci (PPL) ranged from 61.3 (Parambikulam) to 72.9 (Nilambur). Nei’s gene diversity (H) or expected heterozygosity (HJ) ranged from 0.18 (Konni) to 0.22 (Wayanad) (Table 2). The average gene diversity within populations (HS = 0.2052; SE 0.0087; p < 0.0001), the total gene diversity (HT = 0.2395; SE 0.0100; p < 0.0001) and Wrights Fixation index (FST = 0.1433 SE 0.0436; P < 0.0001) were calculated for overall set of populations. The relative magnitude of Nei’s genetic differentiation among subpopulations, GST, was 0.17 indicating that 17 percent of total gene diversity was recorded among the four SPAs while the remaining 83% was recorded within the SPAs. The indirect measure of gene flow estimated from the GST value was 2.4. Results from three analyses (Bayesian FST = 0.1433; Nei GST = 0.17 and AMOVA (Table 4) showed greater variability within the seed production area.
UPGMA dendrogram and PCoA
UPGMA clustering showed that Konni and Nilambur SPAs are separated with least genetic distance (0.0389), Parambikulam and Nilambur SPAs showed the greatest genetic distance (0.0881) (Table 5). An UPGMA dendrogram was constructed to group the four SPAs based on genetic distance. The dendrogram separated Nilambur and Konni SPAs from Parambikulam and Wayanad SPAs. Bootstrap support values are provided at the corresponding node for each cluster (Figure 2).
The cluster analysis comprising 80 trees revealed a unique dendrogram. The dendrogram divided 80 genotypes into two main clusters. The first cluster was shared between genotypes from Parambikulam to Wayanad; the genotypes of the SPAs formed their own sub clusters based on their geographic location. The second cluster was shared between Nilambur and Konni SPA genotypes but with mixing of genotypes from two geographic areas in one sub-cluster. One of the clusters consisted of 15 genotypes, all from Nilambur SPA, while the second cluster comprised of five genotypes from Nilambur (N2, N3, N9, N12, and N14) and one from Wayanad (W5) in addition to all 20 genotypes from Konni. This showed that these five genotypes from Nilambur and one from Wayanad might have actually originated from Konni. Bootstrap support values are provided at the corresponding node for each cluster (Figure 3). The PCoA revealed the genetic relationships between populations used in this study (Figure 4). The scale plot obtained for PCoA analysis showed similar genetic structuring of populations based on the origin of genotypes of the SPAs.
Table 2. Genetic diversity parameters of four seed production areas of Kerala
     
Table 3. Population genetic structure of four seed proction areas of Kerala
     
Table 4. Analysis of molecular variance (AMOVA) using AFLP markers for four seed production areas of teak in Kerala
     
Table 5. Nei's unbiased measures of genetic distance coefficients of the four seed production areas
     
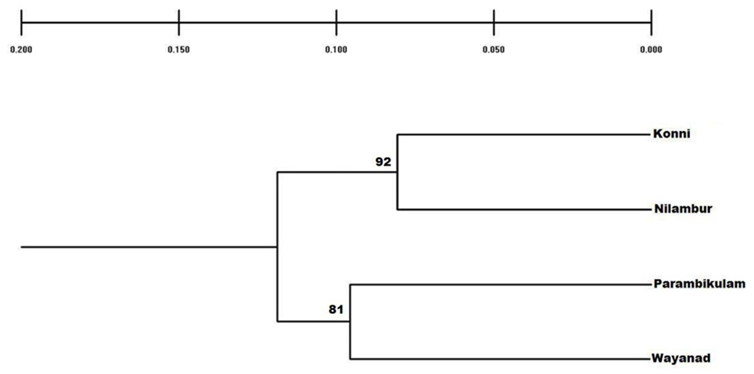
Figure 2. Dendrogram constructed based on Nei’s (1978) genetic distance coefficients of the four seed production areas of teak. Numbers at the nodes represent bootstrap values generated by 1000 replications
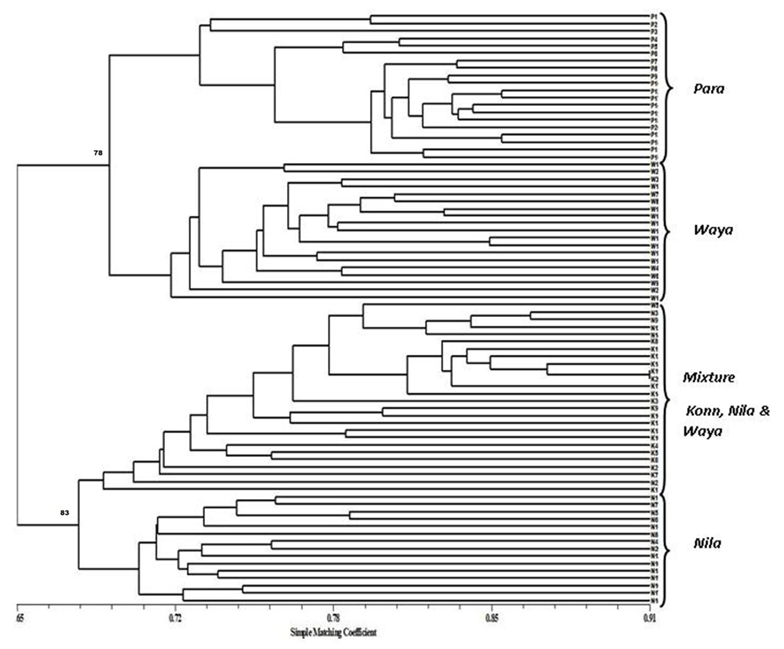
Figure 3. UPGMA dendrogram of genetic relationships of 80 genotypes from the four seed production areas of teak. Numbers at the nodes represent bootstrap values generated by 1000 replications. (Para: Parambikulam SPA; Waya: Wayanad SPA; Konn: Konni SPA; Nila: Nilambur SPA
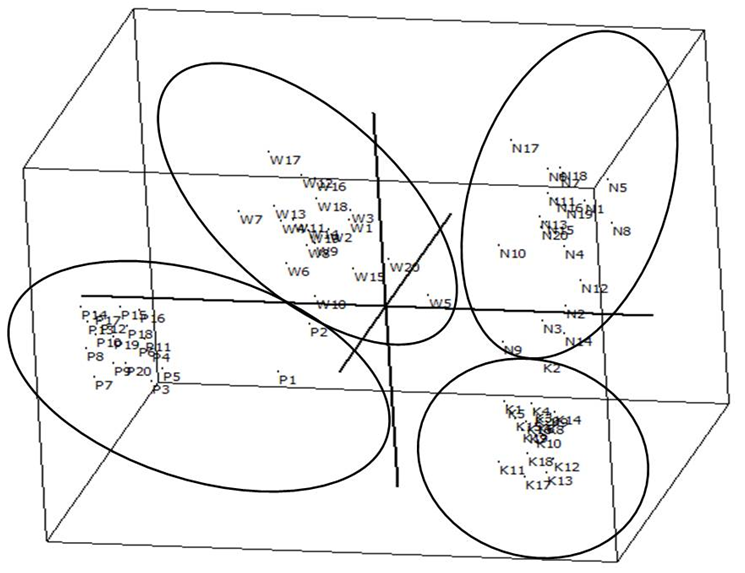
Figure 4. 3D principal co-ordinate analysis (PCoA) of 80 genotypes of the four seed production areas performed using FAMD 1.30 software

4. Discussion

Ten AFLP primer combinations showed a total of 602 loci. The dominant markers of 100-200 number provides consistent estimate to evaluate the genetic diversity parameters [34]. Sample sizes above ten individuals are required to estimate marker-based within-population diversity [35, 36]. AFLP markers 238.1 ± 227.9 employed to an average of 14.0 ± 14.8 populations and 14.5 ± 9.0 individuals per population efficiently perform within and between population genetic diversity analysis in plants [37]. The present investigation was based on four important seed production areas each with 20 individuals i.e. 20 ± 0.0 individuals per location (Table 1) used to analyze the preliminary genetic diversity data within and between the teak seed production areas of Kerala.
A similar study conducted using AFLP markers on teak trees growing in natural forests of the same geographic regions reported the genetic diversity of the four provenances from which the SPAs might have originated [38]. The genetic diversity indices of all four natural forest teak populations were higher than those for the SPAs that were established in the respective geographic region of the Western Ghats. The total gene diversity index of the four SPAs was 0.2395 ±0.0201, lower than the total gene diversity of the nine natural teak populations (0.2644 ±0.0178) reported in the previous study which covered geographic regions from two additional states of Karnataka and Tamil Nadu. Since teak is a cross pollinated species, reduction in genetic diversity in a randomly mating population could exert adverse impacts not only on seed production but also on crop productivity. Surendran et al. [39] considered selective culling of inferior phenotypes from a seed stand as a ‘negative selection’ sufficient for 5-10% genetic gain. However, studies have not been undertaken of the potential or realized genetic gains from negative selection in teak SPAs or the impacts on seed production caused by reduction in genetic diversity of SPAs. The overall gene diversity index value for Kerala SPAs is lower than the values from other wind pollinated, woody long lived tree species [40]. Examples are Populus tremuloides (0.30), P. grandidentata (0.35) and Quercus petrea (0.298) [41]. Using RAPD analysis Prabhu [12] reported that genetic diversity was low in teak SPAs of Kerala located beyond my study area. The reason for the low diversity in teak SPAs could not be identified. The plantations might have been raised using seeds of a couple of mother trees of narrow genetic base. Such progenies are likely to show inbreeding depression and poorer performance than their parents [7].
Genetic differentiation and gene flow among population
Nei’s genetic differentiation (GST = 0.17), Wrights fixation index (FST = 0.143) (Table 3), and AMOVA (Table 4) all showed greater genetic diversity within SPAs than between SPAs. Genetic diversity status of plus trees of teak have been studied using biochemical (isozymes) and molecular (RAPD/AFLP) markers in recent years (Kertadikara and Prat, [42]; Kjaer and Suangtho, [43]; Changtragoon and Szmidt, [44]; Nicodemus et al. [45]; Shrestha et al. [46]; Sreekanth et al. [38]. These studies confirmed that teak is an out-breeding species and revealed maximum genetic variation within as opposed to between populations. Higher levels of population differentiation (between-population diversity) have also been reported in other tropical tree species screened using RAPD markers as in Gliricidia sepium (40%) (Chalmers et al. [47] and in Swietenia macrophylla (20%) (Gillies et al. [48], both of which are entomophilous and extreme outbreeders like teak. Generally long-lived and outcrossing species tend to be more genetically diverse and have less genetic differentiation between their populations [49].
Clustering and PCoA of individual genotypes from SPA
The pattern of clustering of the individual genotypes was in accordance with the geographic origin of SPAs as determined in the previous study on natural teak populations [38]. All 20 samples from Konni and from Parambikulam SPAs clustered into respective groups clearly justifying their respective geographic origin. However, five genotypes namely, N2, N3, N9, N12 and N14 from Nilambur and one Wayanad genotype, W5, intruded into the Konni cluster. I could not able trace the origin of the seed as there was no information available from the forest offices. Records such as Plantation Journal were also unavailable for reference. The depths of genealogy within SPAs depend on several population genetic parameters, including effective population size, natural selection and recombination. Genes such as immunity genes (Klein et al. [50], and self-incompatibility [51] are highly prone to lineage sorting due to over dominant selection. In such cases, it is much less likely to maintain shared haplotypes between species based on geographical location [52]. The indirect estimate of gene flow obtained from the AFLP marker study was Nm = 2.4. This is substantial when compared to teak in the natural forests (Nm = 1.5) of the Western Ghats [38]. By definition gene flow is the movement of genes from one generation to another or from one place to another through pollen movement or through seeds. Geographic variation of natural teak populations has been detected in Kerala [38]. Seed transfer guidelines should be developed on the basis of genetic information and data from provenance trials. The level of genetic diversity is also crucial to ensure the long-term success of a restoration project [53]. If commercial plantations are derived from a few superior trees / plus trees, their genetic diversity tends to be low. If the gene flow from seed production area into native plantations is severe, the distinct gene pools of native forests will be destroyed [54]. Seeds used for plantations may be collected from a few seed trees that reveal capable phenotypes and are grown in nurseries [55, 56], avoiding the selection pressure on seed establishment. In the UPGMA clustering and PCoA analysis Konni clustered with Nilambur by virtue of their genetic similarity even though these locations are geographically far apart. The seed production areas are often established in close proximity to native inter-fertile conspecific populations using seeds from non-local and sometimes distant sources. One of the possible negative concerns of this planting policy is artificial genetic homogenization, the increase in the genetic similarity between the introduced and native gene pools with time via gene flow [57]. Especially in native populations of relatively small size, the human-mediated inflow of non-local genes may eventually swamp locally adapted genotypes. This process has rarely been assessed in natural ecosystems. This study showed the utility of AFLP fingerprinting in identifying the origin of planting stock and thereby revealed the occurrence of the mistake of genotype identity. Similar mislabeling errors were detected by using AFLP markers to study a clonal seed orchard of teak established in 1985 at Kulathupuzha in southern Kerala [58]. These seed production areas are major provenances in Kerala for the quality and quantity of seeds and often established in close proximity to reserve forests. Since there is no record on the origin of seeds during the establishment of these seed production areas the genetic composition of these commercial plantation was genetically different from that of natural populations, gene flow from commercial plantations into native forests would pose serious problems.

ACKNOWLEDGEMENTS

The authors acknowledge the financial support provided by the Department of Biotechnology, Government of India (S.O.No.BT/PR/2302/AGR/08/161/2000). We are thankful to the Forest Departments of Kerala for giving permission for the collection of leaf materials.

References

[1]  Keogh R. “Teak 2000: A Consortium Support Model for greatly increasing the contribution of quality tropical hardwood plantations to sustainable development”. IIED Forestry and Land Use Series No. 9, 26, 1996.
[2]  Katwal, R P S. “Teak in India: status prospects and perspectives”. In: K.M. Bhat, K K N Nair, K V Bhat, E M Muralidharan, Sharma J K. (eds), “Quality timber products of teak from sustainable forest management”. Kerala Forest Research Institute, India and International Tropical Timber Organization, Yokohama, pp 1–17, 2005.
[3]  Ball J B, Pandey D, Hirai S. Global overview of teak plantations. In: T. Enters, C.T.S. Nair, (eds), “Regional Seminar on Site Technology and Productivity of Teak Plantations’, Chiang Mai. Thailand, p 17, 1999.
[4]  Granger A. “Future supplies of high grade tropical hard woods from intensive plantations”. J of World For Res Manag 3: 15-29, 1998.
[5]  Subramanian K, Mandal A K, Rambabu N, Chundamannil M, Nagarajan B. “Site technology and productivity of teak plantations in India”. In: Site, Technology and Productivity of Teak Plantations (ed. Enters T. Nair C.T.S) FORSPA Publication No. 24/2000, FAO, Bangkok. pp. 51-68, 2000.
[6]  Feilberg L, Soegaard B. “Historical review of seed orchards”, Forestry Comm. Bull. No.54. Her Majesty’s Stationery Office, London, 1975.
[7]  Evans J, Turnbull J W. Seed Collection, Supply and Storage. In: Plantation Forestry in the Tropics, 3rd edn, Oxford University Press, p 138, 2004.
[8]  Rao D. S, Singh M, Shivaraju B. Teak management in Kerala. In: C. Chand Basha, C. Mohanan C. Shankar S. (eds), Proceedings of international teak symposium. KFD and KFRI publication, pp. 32-37, 1997.
[9]  Prabhu N H. “Root trainer in forest nurseries: Kerala experiment. In: Bhaskar V Chalapathi M. V (eds), Proceedings of Regional workshop on Dissemination of inniovative technologies in nursery and regeneration of degraded forests and wasteland”. Bangalore. pp. 45-52, 1998.
[10]  Mandal A K, Sharma R. and Gupta B N. Establishment and management of seed production areas. TFRI Publication No. 5, Tropical Forest Research Institute, Jabalpur, India, 1997.
[11]  Prabhu N H. “Teak in Kerala state, India: Past, Present and Future”. In: Bhat KM, Nair, K K N, Bhat, K. V, Muralidharan, E. M., and Sharma J. K. (eds), Proceedings International Conference on Quality Timber Products from Sustainable Forest Management. Kerala Forest Research Institute, Peechi, Kerala, India, pp. 54-62, 2005.
[12]  Prabhu N H. “Studies on seed production areas of teak (Tectona grandis L.f.) in Kerala for their seed quality and Nursery performance”. Ph. D Thesis, Faculty of Silviculture, Forest Research Institute Deemed University, Dehradun, Uttarakkand, 2007.
[13]  Hamrick J L Allozyme diversity of natural stands versus seed orchard loblolly pine. Paper presented at the 23rd biennial meeting of Canadian Tree Improvement Association, Ottawa, pp19–23, 1991.
[14]  Gregorius H. R. The attribution of phenotypic variation to genetic or environmental variation in ecological studies. In: Genetic effects of air pollutants in forest tree populations (ed. Scholz F., Gregorius H.R. and Rudin D.). Heidelberg: Springer Verlag, pp 1–16, 1989.
[15]  Doyle J J. and Doyle J L. Isolation of plant DNA from fresh tissue. Focus 12:13–15, 1990.
[16]  Vos P, Hogers R, Bleeker M, Reijans M, Vande Lee T, Hornes M, Frijters A, Pot J, Peleman J, Kuiper M. and Zabeau M. “AFLP: a new technique for DNA fingerprinting”. Nucleic Acids Res 23:4407–4414, 1995.
[17]  Bonin A, Bellemain E, Bronken Eidesen P, Pompanon F, Brochmann C, and Taberlet P. 2004. How to track and assess genotyping errors in population genetics studies. Mol Ecol., 13: 3261–73.
[18]  Vekemans X. AFLP-SURV version 1.0. Distributed by the author. Laboratoire de Ge´ne´tique et Ecologie Ve´ge´tale, Universite´ Libre de Bruxelles, Belgium. Available: http://www.ulb.be/sciences/lagev/aflp-surv.html. Accessed 2011 Aug 16, 2002.
[19]  Vekemans X, Beauwens T, Lemaire M, Roldan-Ruiz I. “Data from amplified fragment length polymorphism (AFLP) markers show indication of size homoplasy and of a relationship between degree of homoplasy and fragment size”. Mol Ecol 11: 139-151, 2002.
[20]  Zhivotovsky L A “Estimating population structure in diploids with multilocus dominant DNA markers”. Mol Ecol 8: 907-913, 1999.
[21]  Krauss S L. “Accurate gene diversity estimates from amplified fragment length polymorphism (AFLP) markers”. Mol Ecol 9:1241-1245, 2000.
[22]  Meudt H M and Clarke A C. "Almost forgotten or latest practice? AFLP applications, analyses and advances". Trends Plant Sci. 12: 106–17, 2007.
[23]  Lynch M and Milligan B G. “Analysis of population genetic structure with RAPD markers”. Mol Ecol 3:91-99, 1994.
[24]  Yeh F C, Rongcai Y Boyle T. Popgene V.1.31: Microsoft Window-based Freeware for population genetic analysis. A join project development by University of Alberta and Centre for International Forestry Research, 1999.
[25]  Nei M. “Estimation of average heterozygosity and genetic distance from a small number of individuals”. Genetics 89: 583- 590, 1978.
[26]  Miller M P. “A Windows program for the analysis of allozyme and molecular population genetic data (TFPGA)”. Department of Biological Sciences, Northern Arizona University, Flagstaff, USA, 1997.
[27]  Excoffier L, Smouse P E. Quattro J M. “Analysis of molecular variance inferred from metric distances among DNA haplotypes: application to human mitochondrial DNA restriction data”. Genetics 131: 479–491, 1992.
[28]  Peakall R, Smouse P E. “GENALEX 6: genetic analysis in excel. Population genetic software for teaching and research”. Mol Ecol Notes 6: 288–295, 2006.
[29]  Rolf J. “NTSYS-pc, Numerical Taxonomy and Multivariate Analysis System, Version.2.1” Exeter, New York, 2000.
[30]  Sneath P H A, Sokal R R. “Numerical taxonomy’. W.H. Freeman, San Francisco, California, 1973.
[31]  Sokal R, Michener C M. A statistical method for evaluating statistical relationships. Univ. Kansas. Sci. Bull. 38: 1409-1438, 1958.
[32]  Gower J C. “Some distance properties of latent root and vector methods in multivariate analysis”. Biometrika 53: 325-338, 1966.
[33]  Schluter P M, Harris S A. Analysis of multilocus fingerprinting data sets containing missing data, Mol Ecol Notes: 6: 569-572, 2006.
[34]  Mariette S, Le Corre V, Austerlitz F, Kremer A. Sampling within the genome for measuring within-population diversity: trade-offs between markers. Mol. Ecol. 11: 1145-1156, 2002.
[35]  Bussell J D. “The distribution of random amplified polymorphicDNA (RAPD) diversity amongst populations of Isotoma petraea (Lobeliaceae)”. Mol. Ecol. 8: 775–789, 1999.
[36]  Isabel N, Beaulieu J, ThÈriault P Bousquet J. “Direct evidence for biased gene diversity estimates from dominant random amplified polymorphic DNA (RAPD) fingerprints”. Mol. Ecol. 8: 477–483, 1999.
[37]  Nybom H D. “Comparison of different nuclear DNA markers for estimating intraspecific genetic diversity in plants”. Mol. Ecol.13:1143-1155, 2004.
[38]  Sreekanth P M, Balasundaran M, Nazeem P A Suma T B. “Genetic diversity of nine natural Tectona grandis Lf populations of the Western Ghats in Southern India”. Conserv Genet, 13: 1409-1419, 2012.
[39]  Surendran C, Seghal R N, Paramathma M. “Text Book of Forest Tree Breeding”. Indian Council of Agricultural Research, New Delhi, 2003.
[40]  Hamrick J L Godt M J W. Allozyme diversity in plant species. In: Plant population genetics, breeding and germplasm resources (ed. Brown A. H.D., Clegg M. T., Kahler A. L. and Weir B.S.). Sinauer, Sunderland, Massachusetts, pp. 43-63, 1989.
[41]  Degreef B L, Triest S, Cuyper B D, Slycken V J. “Assessment of intra-specific variation in half-sibs of Quercus petrea (Matt.) Liebl. plus trees”. Heredity 81: 284-290, 1998.
[42]  Kertadikara A W S, Prat D. “Isozyme variation among teak (Tectona grandis L.) provenances. Theo and Appl Genet, 90: 803-810, 1995.
[43]  Kjaer E D, Suangtho V. “Outcrossing rate of teak (Tectona grandis L.)”. Silvae Genet 44: 175-177, 1995.
[44]  Changtragoon S, Szmidt A E. “Genetic diversity of teak (Tectona grandis Linn. F.) in Thailand revealed by Random Amplified Polymorphic DNA (RAPD). In: IUFRO conference on Tropical Species Breeding and Genetic Resources, Forest Genetics for the Next Millennium. Durban, South Africa, pp 82-83, 2000.
[45]  Nicodemus A, Nagarajan B, Narayanan C, Varghese M, Subramaniaan K. “RAPD Variation in Indian teak populations and its implications for breeding and conservation”. In: K. M. Bhat, K. K. N. Nair, K. V Bhat, E. M. Muralidharan and Sharma, J. K. (eds), Quality timber products of teak from sustainable forest management. Kerala Forest Research Institute, India and International Tropical Timber Organization, Yokohama, pp 321–330, 2004.
[46]  Shrestha M K. Volkaert, Straeten D. V. D. Assessment of genetic diversity in Tectona grandis using amplified fragment length polymorphism markers. Can J For Res 35:1017–1022, 2005.
[47]  Chalmers K J, Waugh R, Sprent J I, Simons A J Powell W. “Detection of genetic variation between and within populations of Gliricidia sepium and G.maculata using RAPD markers”. Heredity 69: 465-472, 1992.
[48]  Gillies A C M, Navarro C, Lowe A J, Newton A C, Hernandez M, Wilson J. Cornelius J P 1999. Genetic diversity in Mesoamerican populations of Mahogany (Swietenia macrophylla), assessed using RAPDs. Heredity 83: 722-732.
[49]  Hamrick J. L. and Godt H. J. W. 1996 Conservation genetics of endemic plant species. In: Conservation Genetics: Case Histories from Nature (ed. Avise J.C. and Hamrick J. L.) Chapman and Hall, New York, USA, pp. 281-304.
[50]  Klein J., Sato A. and Nikolaidis N., 2007. MHC, TSP and the origin of species: from immunogenetics to evolutionary genetics. Annu Rev Genet. 41:281–304.
[51]  Castric V. and Vekemans X. 2004. Plant self-incompatibility in natural populations: a critical assessment of recent theoretical and empirical advances. Mol Ecol 13:2873–2889.
[52]  Duminil J, Brown R P, Ewedje Eben-Ezer B K, Mardulyn P, Doucet J L Hardy O J. Large-scale pattern of genetic differentiation within African rainforest trees: insights on the roles of ecological gradients and past climate changes on the evolution of Erythrophleum spp (Fabaceae). BMC Evol Biol 13: 195, 2013.
[53]  Hufford K M Mazer S J.O “Plant ecotypes: genetic differentiation in the age of ecological restoration. Trends Ecol Evol 18:147–155, 2003.
[54]  Steinitz O, Robledo-Arnuncio J J Nathan R. Effects of forest plantations on the genetic composition of conspecific native Aleppo pine populations. Mol Ecol 21:300–313, 2012.
[55]  Larsen J. B. Ecological stability of forests and sustainable silviculture. Forest Ecol Manag, 73: 85–96, 1995.
[56]  Olden J D, Poff N L, Douglas M R., Douglas M E Fausch K D. Ecological and evolutionary consequences of biotic homogenization. Trends Ecol Evol. 19: 18–24, 2004.
[57]  Perevolotsky A. and Sheffer, Forest management in Israel – the ecological alternative. Israel J Plant Sci, 57:35–48, 2009.
[58]  Sreekanth P M, Balasundaran M 2012. AFLP diversity of teak clonal seed orchard. Indian J of Genet and Plant Breed, 4: 484-487, 2012.