-
Paper Information
- Paper Submission
-
Journal Information
- About This Journal
- Editorial Board
- Current Issue
- Archive
- Author Guidelines
- Contact Us
International Journal of Agriculture and Forestry
p-ISSN: 2165-882X e-ISSN: 2165-8846
2016; 6(5): 169-180
doi:10.5923/j.ijaf.20160605.01

Quantification of Carbon Stock and Tree Diversity of Homegardens in Rangpur District, Bangladesh
 Abstract
 Reference
 Full-Text PDF
 Full-text HTML
M. S. Jaman 1, Hossain M. F. 1, Md. Shariful Islam 1, M. G. J. Helal 1, Mahbuba Jamil 2
1Department of Agroforestry and Environmental Science, Sher-e-Bangla Agricultural University, Dhaka, Bangladesh
2Department of Agriculture Extension, Dhaka, Bangladesh
Correspondence to: M. S. Jaman , Department of Agroforestry and Environmental Science, Sher-e-Bangla Agricultural University, Dhaka, Bangladesh.
| Email: |  |
Copyright © 2016 Scientific & Academic Publishing. All Rights Reserved.
This work is licensed under the Creative Commons Attribution International License (CC BY).
http://creativecommons.org/licenses/by/4.0/

Homegarden systems are suggested to hold a large potential for carbon (C) sequestration, especially for climate change mitigation and adaptation under changing environment. This is because of the multifunctional ecosystem services of homegardes for storing carbon. In this research total above and below ground carbon stock and tree species diversity were quantified in homegarden around four villages of two Upazilas of Rangpur district situated in northern part of Bangladesh. A total 64 homegardens were sampled on size, diameter at breast height (DBH) of trees and tree height. Using allometric equations, mean above and below ground biomass carbon stocks (AGB+BGB) was found 53.53Mg ha-1. Mean carbon stock per unit area was higher in small homegarden (69.15 Mg ha-1) compared to medium (47.96 Mg ha-1) and large (39.93 Mg ha-1) homegarden respectively. In total 1671 trees were sampled and 32 different tree species were identified and recorded. The Shannon Wiener index was used to evaluate the tree diversity per homegarden and it ranged from 1.00 to 2.2 with a mean value of 1.64. These results imply that homegarden can serve as an important ecological tool in terms of carbon sequestration and conservation of tree species diversity. However, specific homegarden management plan is necessary for increased carbon sequestration potentiality and conservation of species diversity should be encouraged for further investigation in this region.
Keywords: Homegarden, Carbon sequestration, Species diversity
Cite this paper: M. S. Jaman , Hossain M. F. , Md. Shariful Islam , M. G. J. Helal , Mahbuba Jamil , Quantification of Carbon Stock and Tree Diversity of Homegardens in Rangpur District, Bangladesh, International Journal of Agriculture and Forestry, Vol. 6 No. 5, 2016, pp. 169-180. doi: 10.5923/j.ijaf.20160605.01.
Article Outline
1. Introduction
- A homegarden can be defined as an intensive land use system that combine diverse farming components such as annual and perennial crops, domestic animals, occasionally fish that are provide environmental services, employment opportunities and household needs [47]. Homegarden also referred as a household or homestead farm, multi strata tree garden, analogue forest, compound farm, village forest garden and household garden [28]. Rapid deforestration and heavy industrialization increase the amount of greenhouse gas in the atmosphere thus necessary forest management has been focused on altering deforestration and forest degradation targeting to get benefit from reducing emission from deforestration and forest degradation (REDD+) program in response to climate change. Homegarden has its immense important in climate change mitigation and green house gas minimization through enhance carbon sequestration [46]. Multiple arrangement of plant and relatively high species diversity prevent environmental degradation [32] provide economic benefits and maintain a sound and sustainable ecology [26]. It is well established that maintenance of ecosystem and conservation of biodiversity is necessary for welfare of the human being [5]. Almost 75% of terrestrial biomes have altered its characteristics due to various anthropogenic activities. Fragmentation of land, overexploitation and habitat degradation have a great contribution to the loss of biodiversity around the world. Most of the agroforestry systems (e.g. multipurpose trees, silvopasture) have a great potentiality for carbon sequestration and homegarden are unique in this respect [24]. With about 158 million people on 14.7 million ha land area Bangladesh is a densely populated and a developing country of the world and developing countries are mainly suffer from negative impact of global warming. Under UNFCCC (United Nations Framework Convention on Climate Change), countries are negotiating REDD+ which main aim is conservation of forest, sustainable management of forest land and increase forest carbon stock by provide incentives [11]. In Bangladesh homegarden represent a well established land use system which are maintained by at least 20 million household and represent one possible strategy for conservation of biodiversity [21, 22]. Not only that homegarden also provide some potential ecosystem service such as carbon sequestration, soil conservation, preserving of water and air quality [45]. Natural forest of Bangladesh are shrinking at an alarming rate because of unprecedented anthropogenic pressure. For this reason to meet future challenges of land and water scarcity, to ensure food security, to conserve biodiversity and to provide daily needs of rural people homegarden could be the prime example. However there is still lack of quantitative data and very little information available on homegarden in respect of their carbon content, carbon sequestration potential and species diversity specially in northern homegarden in Bangladesh. Although carbon sequestration potential in homegarden has been subject of scientific interest [39]. Therefore, this study focused on assessing the amount of biomass carbon (Above and Below ground) and tree diversity around the homegardens of four selected village in Rangpur district.
2. Material and Methods
2.1. Location of the Study Area
- The study was conducted at four villages (Manoharpur, Radhakrishnopur, Basantopur and Nandanpur) of two upazilas (administrative unite) in Rangpur district, located in the northern part of Bangladesh. The area covers 2370.45 sq km, which is in between 25°18' to 25°57' N latitudes and 88°56' to 89°32' E longitudes. Among the studied villages 1st two are in Rangpur sadar upazila and the rest two of them belong to Badarganj upazila. An area of 330.33 km2 from 25°39' to 25°50' N latitudes and 89°05' to 89°20' E longitudes belongs to Rangpur sadar upazila. Where as Badarganj upazila occupies an area of 301.29 km2 and located between 25°32' to 25°46' N latitudes and 88°56' to 89°10' E longitudes (Photo 1). The experimental site can be defined as tropical wet and dry climate. The climate is generally marked with monsoon, high temperature, considerable humidity and heavy rainfall. The hot season commences early in April and continues till July. The maximum mean temperature observed is about 32 to 36°C during the months of May, June, July and August and the minimum temperature recorded in January is about 7 to 16°C [3]. The highest rainfall observed during the months of monsoon and it is 1378.6 mm with an average annual rainfall is about 1587 mm [4]. Soil composition of the study area mainly alluvial soil (80%) and the remaining 20% is barind soil [43].
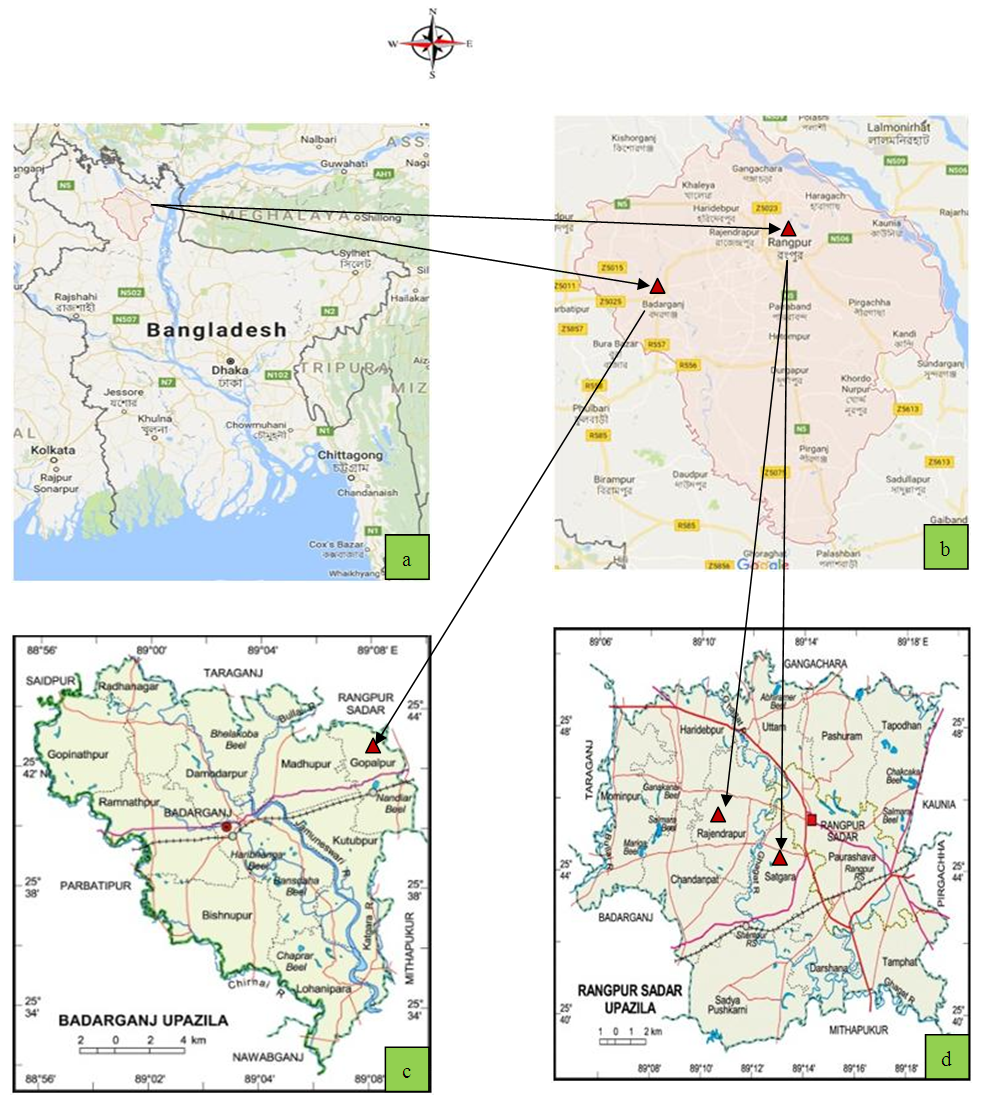 | Photo 1. Stepwise location of the study area where (a) Bangladesh (b) Rangpur district (c) Badarganj Upazila (d) Rangpur Sadar Upazila |
2.2. Sampling Procedure
- This study was conducted in Rangpur district which consist of 8 upazila. Out of 8 upazila, 2 upazila namely Rangpur Sadar and Badarganj was randomly selected. Rangpur Sadar and Badarganj Upazila consists of 12 unions (Lowest unit of local self government) and 10 unions respectively. Satgara and Rajendropur are the two union from Rangpur Sadar and Gopalpur union from Badarganj Upazila were randomly selected. Finally two village namely Manohorpur and Radhakrishnopur were selected where 1st one from Satgara union and 2nd one from Rajendrapur union. On the other hand two villages namely Basantopur and Nandanpur were selected from Badarganj Upazila where both of them are from Gopalpur union (Photo 2). There were total 1244 homegardens in four selected villages where the number of homegardens in Manoharpur (120), Radhakrishnopur (231), Basantopur (405) and Nandanpur (488). Out of 1244 homegardens, a sample of 15%, i.e., 186 homegardens were primarily selected to avoid the difficulty of the study. Finally 64 homegardens from 186 homegardens were randomly selected in order to capture a representative mixture of size of homegardens which also provide the cost effective approach to describe two major complementary works (1. Carbon stock computation and 2. Tree diversity assessment).
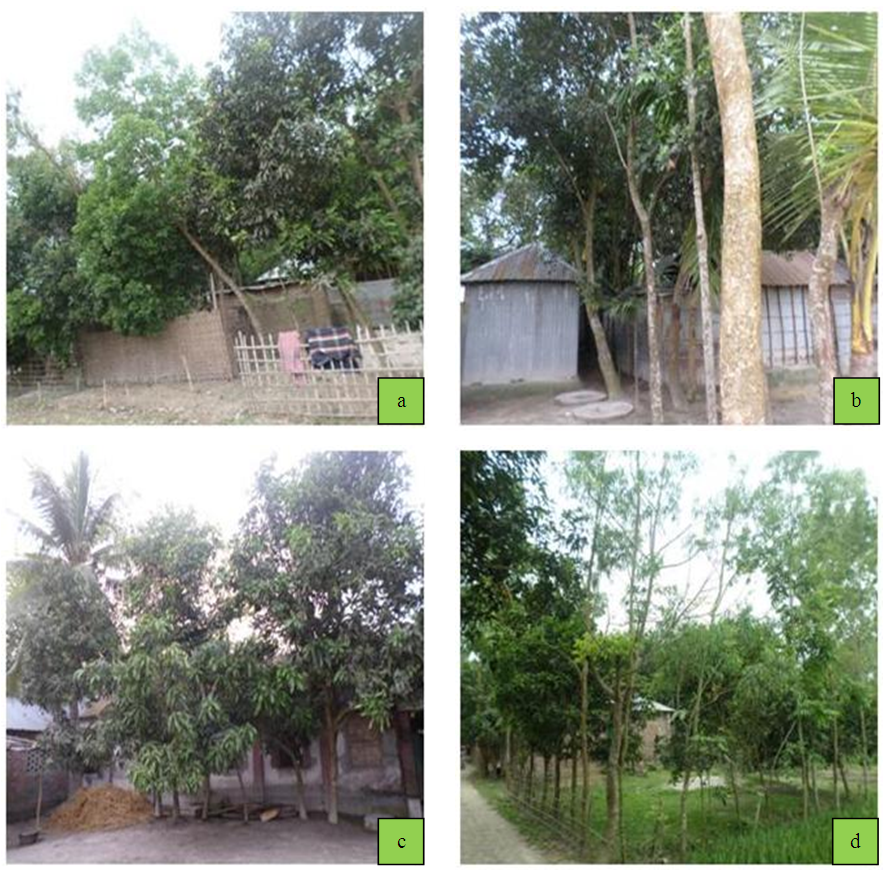 | Photo 2. Photograph showing (a) homegarden of Radhakrisnopur village (b) homegarden of Basantopur village (c) homegarden of Manahorpur village and (d) homegarden of Nandanpur village |
2.3. Homegarden Plot Survey
- All perennial trees and palms with a diameter at breast height of ≥ 2 cm were identified and recorded to species level or by local name and botanical name. For individual tree species DBH (Diameter at breast height) were measured by using DBH tape and height of palm species were measured by 50 meter long measuring tape. For comparison, the homegardens were categorized into three size group namely small (0.01-0.03 ha), medium (0.03-0.05 ha) and large (> 0.05 ha). Allometric equation developed by Chave et al. (2005) was applied for individual trees for determining the tree biomass [8]. Wood density for every species was collected from secondary data such as FAO list of wood densities for tree species from Tropical Asia and [49], global wood density database. No climbers were counted due to difficulty in differentiating stems.
2.4. Ecological Indices
- Tree species diversity of the homegarden was determined by the Shannon Wiener diversity Index (SWI). Species density (number of species per unit area) was measured by dividing the total number of plant species of an homegarden by the total area of that homegarden.
2.4.1. Tree Diversity Measurement
- Tree species diversity was measured by Shannon-Wiener diversity index (SWI) for its suitability for estimating diversity of tree species [51]. It characterizes the proportion of species exorbitance in the population is higher when all species are equally abundant and the lower when the sample population contained one species. The proportion of species (i) relative to total number of species (Pi) was calculated and then multiplied by the natural logarithm (Ln Pi). The resulting product is summed across species, and multiplied by-1 [31].
 Where, ∑=Summation. pi = Proportion of total sample represented by species i. (Total no. of individual species i, divided by total no. of plant species found in a sample community). H = Shannon index.n = No. of species.
2.4.2. Tree Biomass
- Tree biomass quantification is a tiresome job using the destructive method, particularly in tropical and subtropical regions because of the presence of numerous species and individuals in multiple layers. For this reason, common allometric equations have been developed for make this job easy [52]. Taking this point into account, for aboveground carbon estimation Chave et al. (2005) allometric equation was applied, as it covers a wide geographical and diameter range of vegetation of all types ……………………….[8].
2.4.3. Above Ground Biomass
- To measure the above ground biomass, following equation has been used:AGB = ρ x exp (-1.499 + 2.148 x ln (DBH) + 0.207 x (ln (DBH))2 - 0.0281(ln (DBH))3 [8] ρ = Wood density (g cm-3):1.499, 2.148………………0.207 and 0.0281= Constant
2.4.4. Below Ground Biomass
- Below ground biomass was estimated using the model equation suggested by Cairns et al. (1997) as the most suitable and practical method.BGB = exp (-1.0587 + 0.8836 x ln AGB)Where; BGB = Belowground biomass, ln = Natural logarithm, AGB = Aboveground biomass, -1.0587 and 0.8836 are constant.
2.5. Palm Biomass
- Palm species such as Cocos nucifera, Areca catechu, Phoenix silvestris are most common species found in the selected homegardens in Rangpur distict. The following allometric equation was used to calculate above ground biomass of different palm species but these data were removed for further analysis and not presented here.Above ground biomass calculation for palm:AGB = 6.666 + 12.826 x (HT0.5) x ln (HT) …… [6]Where,HT = Height of the trunk in meters (for palms this is the main stem, excluding the fronds)ln = Natural logarithm
2.6. Conversion of Biomass to Carbon
- Tree biomass was converted to carbon assuming that carbon accounted for 50% of the biomass [6]. Almost all carbon measurement projects in the tropical forest the total biomass was multiplied by 0.5 to compute actual tree carbon content as 50% of wood’s total biomass is considered to be carbon [8].Carbon (Mg) = Biomass estimated by allometric equation x 0.5.
2.7. Data Analysis
- Collected field data were processed and analysed using SPSS-11.5 version software and MS excel 2007. One-way ANOVA and t-test has been done to find out the significant differences among biomass carbon and tree diversity at 0.05% level of significance. Regression analyses were used to test the relationship among different variables.
3. Results
3.1. Above Ground and Below Ground Biomass Carbon (AGB and BGB)
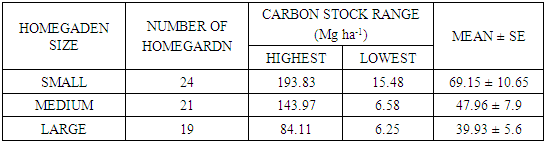
- Tree and palm species of the selected homegarden were measured based on DBH (Diameter at breast height) and height. Data was computed using selected equations and found significant differences. The above and below ground biomass (AGB+ BGB) carbon for the 64 sampled homegarden ranged from 6.25 to 193.83 Mg C ha-1. Mean carbon stocks per unit area was higher in small homegarden (69.15 Mg C ha-1) where area of the small homegarden was (0.02-0.03 ha.) and total number of small homegarden was n=24 compared to medium (47.96 Mg C ha-1., 0.03-0.05 ha., n=21) and large (39.93 Mg C ha-1., >0.05 ha., n=19) size homegarden (Table 1). The variation in carbon content of individual homegarden may be because of differences in homegarden species composition, age of species, site characteristics, and holding sizes in different physiographic zones such as midlands, highlands and river basin area of Rangpur district. Size of gardens was a major factor affecting C stocks per unit area and it decreased in the order of small > medium > large (Figure 1).
|
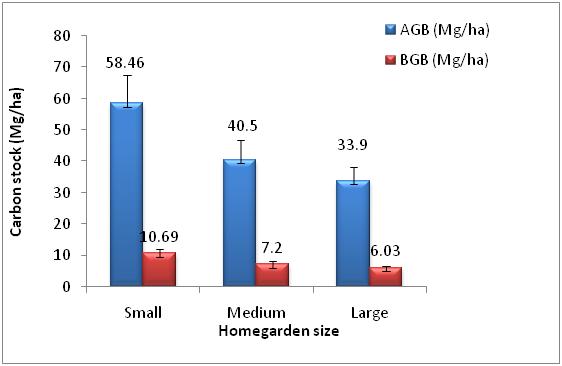 | Figure 1. Above and below ground carbon stock at various homegarden in Rangpur district. Error bar show the standard error |
3.2. Relationship between Stand Structure of Trees and Carbon Stocks
- A regression analysis was used to determine the relationship between mean DBH (Diameter at breast height), basal area and stem density with carbon stock.
3.2.1. Mean DBH
- The relationship between mean DBH and carbon stock were estimated and presented (Figure 2). The result of mean DBH and carbon showed that the relationships between these two factors were significant and positive where R2 value was 0.182. This figure also indicates that mean DBH of tree species are weekly correlated with carbon stock.
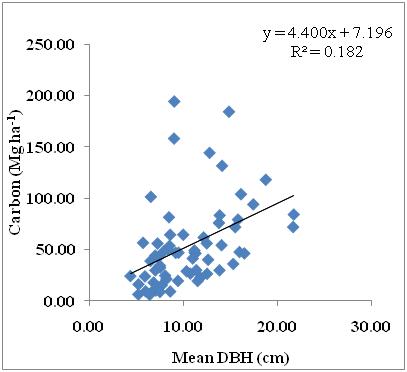 | Figure 2. The relationship between mean DBH and total carbon stock (Mg ha-1) per area |
3.2.2. Basal Area
- The relationship between basal area and carbon stock were estimated and presented (Figure 3). The figure indicates that basal area of tree species are significantly correlated with carbon stock where R2 value was 0.917. That is increasing basal area of tree species carbon content increase as well.
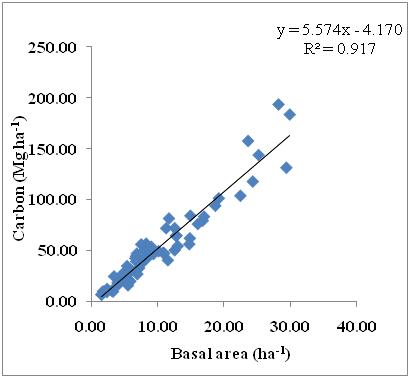 | Figure 3. The relationship between Basal area and total carbon stock (Mg ha-1) |
3.2.3. Stem Density
- The relationship between stem density and carbon stock were estimated and presented (Figure 4). The figure indicates that stem density of tree species are not strongly related with carbon stock where R2 value was 0.258.
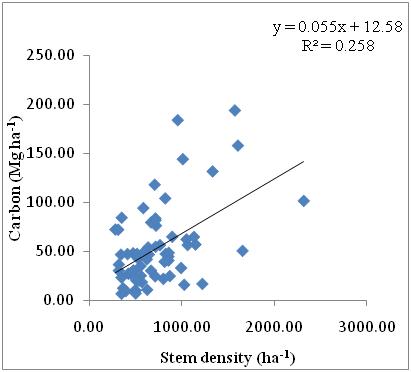 | Figure 4. The relationship between stem density (ha-1) and total carbonstock (Mg ha-1) |
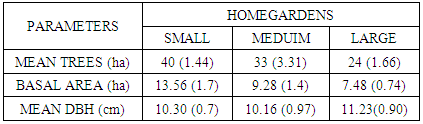
3.3. Vegetation Characteristics
- Vegetation characteristics such as mean number of trees per hectare, basal area, mean DBH (Diameter at breast height) of 64 sampled homegarden with their standard error are showed (Table 2). From this findings it was estimated that average number of tree (40 nos. ha−1) and basal area of (13.56 m2 ha−1) were higher in small homegarden rather than medium (33 nos. ha−1, basal area of 9.28 m2 ha−1) and large (24 nos. ha−1, basal area of 7.48 m2 ha−1) homegardens, respectively. But only differences is that the mean DBH of large homegardens (11.23 cm) is comparatively higher than small (10.30 cm) and medium (10.16 cm) homegardens because DBH of palm species like Areca catechu and Cocos nucifera were not measured except height.
|
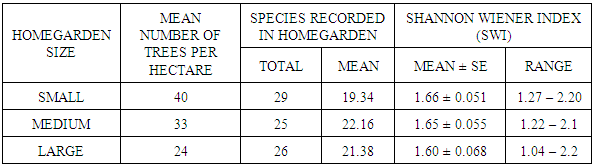
3.4. Species Diversity
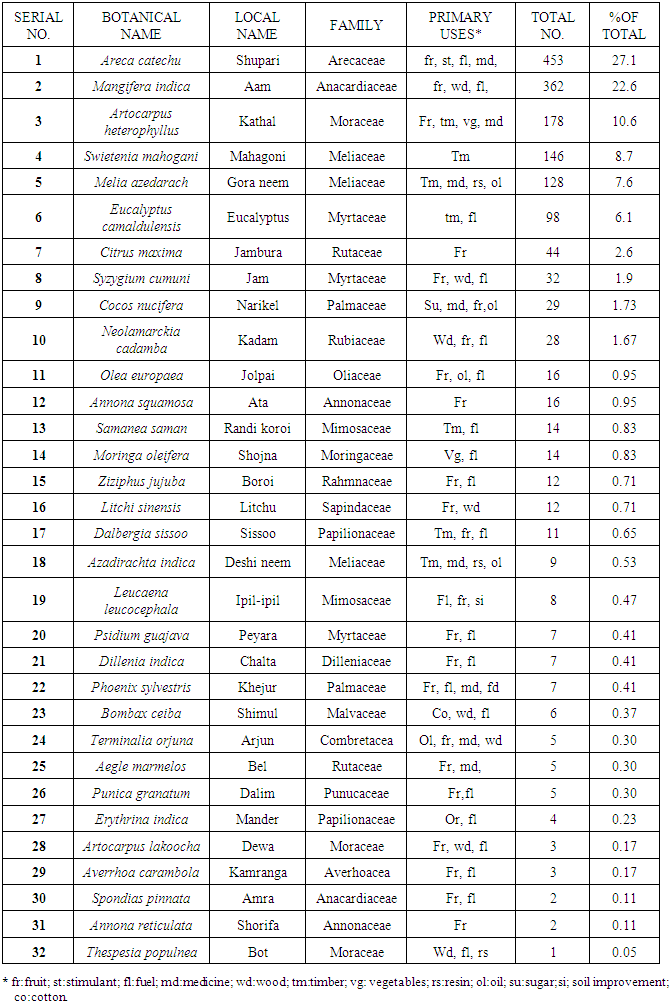
- In total, 32 different tree and palm species were found from 21 families in the selected homegardens and total 1671 trees were measured. The most common plant was found betel nut which was 453 nos. (n=453) which is 27.10 % of the total plant population followed by Mango (n =362, 21.66%), Jackfruit (n =178, 10.65%), Mahagani (n= 146, 8.73%), Gora neem (n=128, 7.66%) and Eucalypyus (n=98, 5.86%) (Table 5). Tree diversity described by the Shanon-Wiener diversity index (SWI) showed a variation between 1 and 2.2 with a mean value of (1.64±0.03) where small size homegardens had the highest mean diversity of trees (1.66±0.05) followed by medium (1.65±0.05) and large (1.60±0.06) homegardens, respectively (Table 3).
|
3.4.1. Relationship between Tree Diversity and Biomass Carbon
- A regression analysis was done to find out the relation between diversity of trees and carbon stocks (Figure 5). The figure indicates that tree diversity and biomass carbon are the two variables significantly related with each other where R2 value was positive and significant (R2 = 0.66). Small size homegarden had high tree diversity contained higher amount of carbon per unit area compared to medium and large home garden and the values are gradually decreased in the order of small > medium > large homegarden.
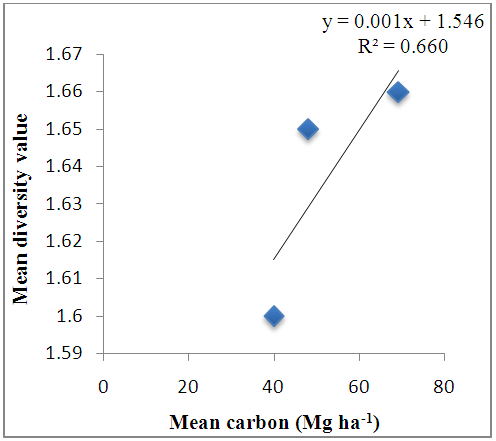 | Figure 5. The relationship between diversity of trees and carbon stocks of various Homegardens in Rangpur district |
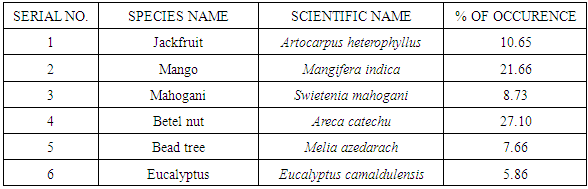
3.4.2. Dominancy of Species and Their Uses
- Homegardens of selected study area composed with various tree species. The species, their predominance in homegardens and primary uses are given (Table 5). Tree species in the homegardens are used for mainly fruit, fuel, and timber purposes. Non wood products and services such as vegetables, oil, medicines, resins etc. are provided by different tree species. Among 32 plant species major six species found in dominancy than others and the highest percent of occurrence was found Areca catechu > Mangifera indica >Artocarpus heterophyllus > Swietenia mahogany > Melia azedirach >Eucalyptus camaldulensis (Table 4).
|
|
3.5. Major Species and Their Contribution to Carbon
- Among 32 species from 21 different families, it is clearly mentioned that six major species like Betel nut, Mango, Jackfruit, Mahagani, Gora neem and Eucalyptus are the most common and dominant species found in the sampled homegarden. In this study betel nut was found the most dominant species but less dominant in case of its carbon content (453 nos.) carbon contained (15.59 Mg) followed by Mango (362 nos., 26.7 Mg) Jackfruit (178 nos., 29.71 Mg), Mahagani (146 nos., 17.24 Mg), Gora neem (128 nos., 5.65 Mg) and Eucalyptus (98 nos., 6.4 Mg) at various homegardens (Figure 6). In this study it is also observe that 6 species contained 78% carbon while other 28 species contained only 22% carbon.
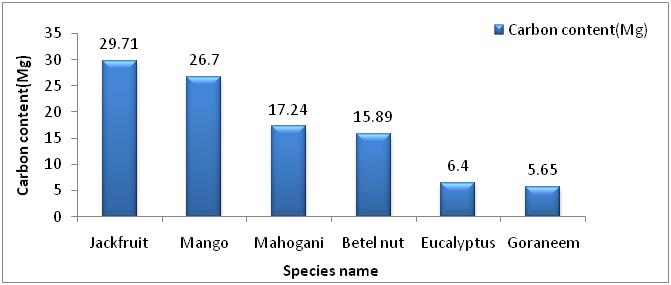 | Figure 6. Major six tree species and their carbon content of various homegardens in Rangpur district |
4. Discussion
4.1. Above and below Ground Carbon Stock (AGB and BGB)
- The findings of this study is that the average carbon stock (AGB + BGB) of standing homegarden trees (DBH > 2cm) was 53.53 Mg ha-1; n=64 which ranging from 6.25 to 193.83 Mg ha-1 and it is expressed earlier that small homegarden had higher amount of carbon (69.15 Mg ha-1) than medium (47.96 Mg ha-1) and large (39.93 Mg ha-1) homegardens respectively. The average carbon stocks presently reported are lower than Javanese homegarden (58.6 Mg ha-1) as well as mature (>35-year old) agroforests (101 Mg ha−1) and secondary forests of Sumatra (86 Mg ha−1), Indonesia but higher than AGB (13 Mg ha-1) ranged from 1 to 56 Mg ha-1; (n=45) in the homegarden of Moneragala district, Sri Lanka [31] and Sumatran homegarden (35.3 Mg ha-1) [16, 38]. Woodlots in Palakkad district, Kerala, India, also showed C stocks range from 7.8 to 163.2 Mg ha−1 [19, 33]. The variability among the homegardens in this respect may be because of differences in garden composition, site characteristics, management practices, and holding sizes in different physiographic zones such as midlands, highlands of Rangpur district. Size of the homegardens was a major factor affecting carbon stock per unit area and it is gradually decreased in the order of small > medium > large homegarden. This result is also similar that was reported by Saha et al. (2009) in the homegarden of Thrissur, Kerala, India [40]. Another study was accomplished in central Kerala, India where the average standing carbon stocks of homegarden ranged from 16 to 36 Mg ha-1 [24]. Dissanayake et al. (2009) estimated the AGB carbon stock in homegardens in Kandy 90 Mg C ha-1 and Matale districts 104 Mg C ha-1 [10]. Premakantha et al. (2014) reported that homegardens in Nuwara Eliya district of Sri Lanka contain 77 Mg C ha-1, [34] and E. Rana (2011) also reported that in Kathmandu, Nepal the community forest contain 240 Mg ha-1 [36]. Cacao agroforest in Sulawesi, Indonesia contain carbon stocks ranged from 82 to 211 Mg C ha-1 reported by Michael Kessler et al. (2012) which is comparatively higher than the homegarden of Rangpur district of Bangladesh. The resultant variation due environmental, geo-morphological factors and management practices of individual homegarden.
4.2. Tree Diversity and Density
- Tree diversity maintenance and its conservation practices are the major issue of biodiversity conservation is now become a growing concern for all over the world specially the third world country like Bangladesh because it has a potential role of maintaining healthy environment, vigor of the biosphere, minimize the earth temperature rising and regulate a balance ecosystem functioning. For exploring the tree diversity Shannon Wiener diversity index (SWI) was used. The mean value has found SWI: 1.64; n=64 ranged from 1.04 to 2.20 is lower than that of found by APN (Asia-Pacific Network for Global Change Research) (2012) in the homegardens of the Keeriyagaswewa village (SWI: 2.13; n = 59) located in the Sri Lankan dry zone, Siwalakulama village (SWI: 1.77; n = 30), Pethiyagoda village (SWI: 1.99; n = 59) [2], and the homegarden of Chao Pharaya basin, Thailand ranged (1.9-2.7) [13] but higher than that of Meegahakiula area SWI: 1.55–1.77; [41], Vihiga (0.74) and Siaya (0.86) district in western Kenya [15]. The estimated SWI is also higher than the mean SWI found in homegardens of two villages in West Bengal, India and six villages in Dhaka Division, Bangladesh [2] but lower than that of Thrissur, Kerala’s homegardens (1.45-3.14) in India [40]. Mean Shannon-Wiener diversity indices in tropical homegardens have been reported to vary broadly from 0.93 in rural Zambia [9] to almost 3.0 in West Java, Indonesia [17]. The Shannon Wiener diversity index (SWI) value of the present study is higher than that of fruit species diversity (0.99) found in coastal homestead Bangladesh [44] and fruit (0.799) and timber (0.798) species diversity of haor homestead [30]. In the present study of Rangpur district small homegarden has found the highest tree diversity (1.66) followed by medium (1.65) and large (1.60) which are comparatively higher than that of diversity found in small (0.64), medium (0.41) and large (0.46) homegarden in central kerala state, India [18]. In a previous study covering 252 homegardens throughout the state of Kerala also reported similar diversity values (0.606, 0.441, and 0.459 respectively, for small, medium, and large holdings) that are also lower than that of present study value [24]. This study only considers trees and palm species. The overall SWI would have been higher if all plants were included. In this study regression analysis has found a positive relationship between tree diversity with above and below ground carbon stock where as the relationship between tree diversity and homegarden size also found similar result that found by (Kumar, 2011) and (Pushpakumara et al. 2012) [24, 35]. The only difference is that they found slightly negative relationship between tree diversity and above ground carbon stock. Tree density is an important factor to store carbon as it directly relates to the carbon sequestration [37].Tree density of the study area varied from 385.3 to 1629.5 per hectare (11-77 trees per homegarden). Regression analysis showed a positive but not so strong relationship between tree density and carbon stock where R2=0.258 (Figure 4). Another study was conducted in Borneo, Southern Asia shown very weak relationship between tree density and aboveground carbon stock where the value of R2 was 0.049 [42]. Similarly an old aged forest of Costarica and Central America found tree density 462 to 504 trees per hectare where above ground carbon stock (AGB) was 139 to 138 Mg ha-1 respectively that are comparatively lower than the present study result. Considering the relationship between tree density and biomass carbon stock it is indicated that tree density is not a strong determinant factor of aboveground carbon stock. Above ground carbon stock correlated with basal area.
4.3. Species Composition
- The most important attribute of homegarden is species composition. Species composition is closely related to tree density of individual homegarden. This study found 32 different tree species within 21 different families. The number of tree species in this study area was slightly smaller than those found in homegarden of Sandwip upazila (76 spp.) of Chittagong district [27], coastal area’s homegarden of Potuakhali district (57 spp.) [44], district of Tangail (52 spp.) and district of Ishurdi (34 spp.) but higher than that of Bhola (31 spp.), Borguna (30 spp.) [29], Patuakhali (20 spp), Rajshahi (28 spp.), and the other part of Rangpur district (21spp.) [1]. Millat-e-Mustafa identified 92 perinnial plant species in different part of the country [25]. The present study was conducted considering whole homegarden area in one plot so uniform counting of tree species was possible but little variation also occurred from one homegarden to another because homestead need and choice of the family influenced the distribution of tree species. This study also explored that Areca catechu (27.10%), Mangifera indica (21.66%) and Artocarpus heterophyllus (10.65%) are the most important and common fruit species followed by the timber yielding species such as Swietenia mahogany (8.73%) and Melia azedirach (7.66%) that are also found in Sylhet Sadar upazila and Potuakhali district [44], Azmirigonj upazila of Habigonj district (33.33% fruit and 28.57% timber) [30] and Char Gobadia of Mymenshing district (10 fruits and 6 timber) [50]. The homegarden owner are specially concentrate on fruit and rapidly growing timber species because of their subsistence and cash need.
5. Conclusions
- The present studied homegardens of Rangpur district represent a wide range of biomass carbon, tree species diversity and species composition which gives comparatively significant result than the homegardens of many different ecological zone. There were differences between small, medium and large homegardens in terms of their plant-stand characteristics such as trees and tree-species density, and overall tree species diversity. Homegardens with higher number of species retained more carbon in their biomass compared to those with lower number. Tree density and tree diversity were found higher in small homegardens. The carbon estimates found here are reflecting the differences in tree density, tree diversity and management practices between individual homegardens. Smaller homegardens hold a higher carbon content and tree diversity than medium and large homegardens. The finding of present study revealed that homegardens should be established by maintaining proper species composition model focusing on diversity of tree species so that it sequester substantial amount of carbon and contribute to the global climate change.
ACKNOLEDGEMENTS
- We acknowledge Ministry of science and technology, Bangladesh for financing this research. Special thanks and deepest respect must go to Dr. Ferzana Islam, Chairman, Department of Agroforestry and Environmental Science, Sher-e-Bangla Agricultural University for her valuable suggestion and cooperation during the period of article preparation.