-
Paper Information
- Previous Paper
- Paper Submission
-
Journal Information
- About This Journal
- Editorial Board
- Current Issue
- Archive
- Author Guidelines
- Contact Us
International Journal of Agriculture and Forestry
p-ISSN: 2165-882X e-ISSN: 2165-8846
2016; 6(2): 80-85
doi:10.5923/j.ijaf.20160602.04

Climatic Data and Rainfed Land Evaluation, the Case of Maichew, Northern Ethiopia
 Abstract
 Reference
 Full-Text PDF
 Full-text HTML
Molla Mekonnen Alemu
United Nations Development Programme, Freetown, Sierra Leone
Correspondence to: Molla Mekonnen Alemu, United Nations Development Programme, Freetown, Sierra Leone.
| Email: |  |
Copyright © 2016 Scientific & Academic Publishing. All Rights Reserved.
This work is licensed under the Creative Commons Attribution International License (CC BY).
http://creativecommons.org/licenses/by/4.0/

Climate has a complex set of inter-related variables whereby a simple change in one variable or element could initiate a change on other elements. Climate change related risks lie at the very interface of different systems that has many variables which needs to be considered in a collective way. Agricultural activities like crop production, animal production, forestry and fishery can be considered altogether as a system under the umbrella of agriculture and climate also the other system. These two different systems are dependent on each other in one way or another where one system cannot be approached in an independent way in terms of development approach across locations as they are closely related to affect sustainable growth and development of nations. Scientific evidence shows that climate change is affecting agriculture in various ways. Nevertheless, as we develop the understanding of how for instance different crops respond to the climatic variable in a given environment could help to develop the resilience against the deleterious effects of climate change on the environment in general and humans in particular. This study is therefore aimed at characterizing climatic data for rainfed land evaluation in Maichew district, norther Ethiopia.
Keywords: Climatic, Land Evaluation, Rainfed
Cite this paper: Molla Mekonnen Alemu, Climatic Data and Rainfed Land Evaluation, the Case of Maichew, Northern Ethiopia, International Journal of Agriculture and Forestry, Vol. 6 No. 2, 2016, pp. 80-85. doi: 10.5923/j.ijaf.20160602.04.
Article Outline
1. Introduction
- Rural communities are the primary prone people to the negative impacts of climatic variability on agricultural practices, the very weather dependent activity of humans (Hansen, 2002). In many cases, the vulnerability to climate change is high in the least developed countries as they are facing manifold forms of disaster like flood, drought, pest and diseases outbreaks, etc. The production of staple crops lies at the center of many Governmental policies and strategies and the maximization of crop yields has increasingly become among the primary priorities in the context of climate change effects and weather uncertainties (Sivakumar, 1988; Bazzaz and Sombroek 1996). Increased knowledge and information sharing on the influences of climatic factors on agricultural production systems is an important task. Amidst of using improved technologies like irrigation, improved varieties, drought resistant varieties, etc., the impact of climatic variation is causing a huge impact in developing as well as developed countries. The sustained reliance of agriculture on climatic factors like water, temperature, light, etc., and the constant dependence of the world’s major population on agricultural livelihoods along with the substantial and increased trends of climate change have all together created a crying need of a holistic and integrated approaches which can mitigate the impacts on agricultural productivity and production (Cynthia and Diana, 1992).Apart from these, the complete dependence of many subsistence farmers on traditional agricultural systems, poor extension services and packages, weak access to improved agricultural technologies and others quadrupled the impact of climate on the wellbeing of many rural communities. As a result of this, the shift to improved and adaptive varieties, crop production management activities, the development of crops cycling criteria for the optimum use of water resources are some of the vital issues that needs to be considered by agricultural development stakeholders. This will also require a better understanding of the seasonal weather and climatic variabilities (Sivakumar et al., 2000).
2. Objectives
- The aim of this study is to explore if and how improved understanding of the seasonal cycle of climate can be used for the benefit of local agricultural production in a typical area.
3. Methodology
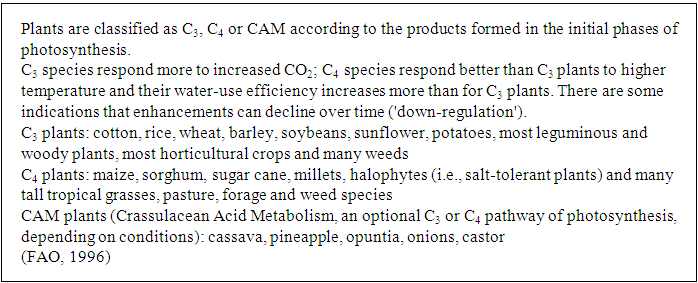
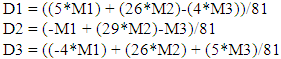
- Climatic data for two decades (1994 – 2015) was collected from the Meteorological Agency of Ethiopia. For the review of climate change and its impact on current agricultural production and productivity, different books, journals and lecture notes were reviewed. Apart from these, researcher’s field level observations were also used as an input for the compilation of the article. For the analysis of the climatic data the equation developed by Gomez (1983) was utilized for the whole computation.Climate, landscape, soil, and at times socio-economic data can be used as a basis for the comparison of productivity of different kinds of land, as well as for comparing and analysing the performance of different land uses on a specific location. The land evaluator can set the minimum data set and then analyse the suitability of the land for a selected crop variety with suitable crop cycle length by making use of the algorithm of Gommes (Ann and Eric, 2014). Then the computed result of the climatic data of Maichew district was compared with the specific climatic requirements of the C3, C4 and CAM plants which is summarized in box 1 and with some other literature reviews.
4. Results and Discussion
4.1. Site Description
- Maichew is a district town located in the Southern Zone of Tigray Regional State of Ethiopia at 12°46'N latitude and an elevation of 1200 - 2478 meters above sea level. It is located at 665 km north of Addis Ababa, the capital of the country. According to Ethiopia’s agro-ecological setting, Maichew and its surrounding environments are classified under the Weinadega (semi-temperate zone). The major livelihood of the community is coming from subsistence agriculture with an average size of 0.75 hectare cultivated land. Teff, barley, wheat, horse bean, sorghum, finger millet and chickpea are the major crops of the area (Shishay and Messay, 2014).
4.2. Climatic Variables
- According to FAO (1993) climate ‘constitutes a complex of inter-related variables. On average, through a set of regulatory mechanisms, a smooth change in one variable triggers smooth changes in most others. With the exception of possible qualitative and abrupt variations, such inter-relations are independent of atmospheric carbon dioxide (CO2). The latter and other greenhouse gases play a part largely through their effect on the radiation balance of the atmosphere’.There exists however, a weak linkage among cloudiness and wind while there is a strong correlation among, evaporation, temperature and rain which in turn demonstrates the probable escalation of the hydrological cycle (Figure 1).
 | Figure 1. Some relationships among major climate variables (average temperature (Temp.); water vapour pressure (Vap.); rainfall (Rain); wind speed (Wind); cloudiness (Clouds); and evapo-transpiration potential (ETP) (FAO, 1995b) |
|
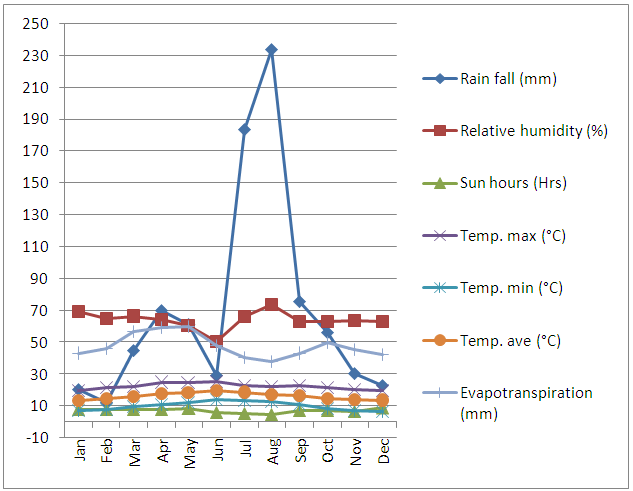 | Figure 2. Graphical representation of the climatic data, Maichew |
4.3. Characterization of Climatic Data for Maichew
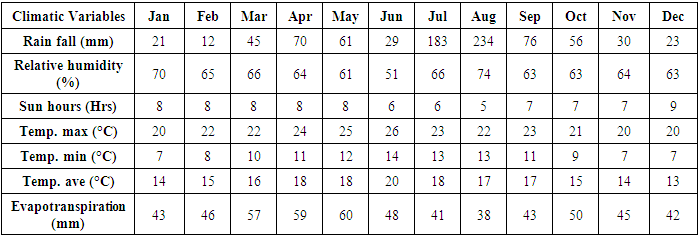
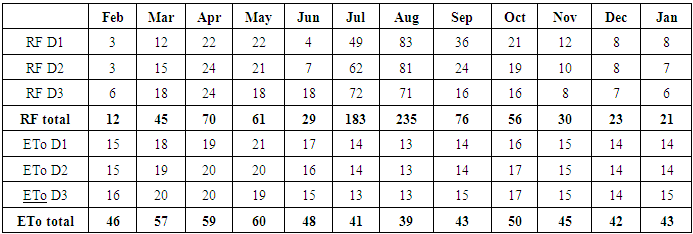
- The climatic data (1994 – 2015) which is composed of temperature, relative humidity, evapotranspiration, n-sunshine hours and rainfall was obtained from meteorological agency and is organized, averaged and tabulated in Table 1. From the data it is possible to articulate as the monthly precipitation distribution in Maichew is not uniform throughout the year; however, rainy periods frequently occur in both summer and winter, comparatively with no dry periods throughout the year, the rainfall being heavy in the summer months. The average temperature of the area ranges from 7-26°C.
|

|
4.4. Proposed Crops to be Grown in Maichew
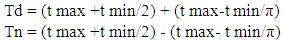
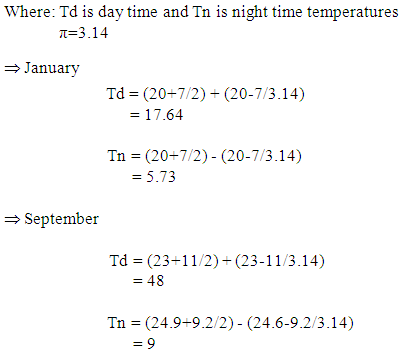
- Temperature is one of the main variables that govern the growth and development of crops. Corn (a C4 crop), for instance requires a minimum temperature of 10°C, an optimum minimum temperatures of 18°C and a maximum of 33°C. Other C4 crops like sorghum also have an absolute minimum temperature of 7 - 10°C, and an optimum maximum range of 33 to 40°C. Other C3 crops like wheat, soybean and alfalfa on the other hand have absolute minimum temperature that ranges 2 - 5°C and an optimum maximum of 23 - 33°C. In general, for cereal crops and for most of the C3 crops the minimum base temperature is 7°C. The photosynthetic rate of C4 plants like maize, in dry and hot weathers is two to three than C3 crops (e.g. Bluegrass). C4 crops can also perform well in areas of which are dominated by high rate of temperature and light intensity and limited amount of precipitation. On the other hand C3 crops are well adapted to cooler climates while CAM crops can adapt well in an arid environmental setting (Steven and James, 2011). Thus, these temperature thresholds can be used to evaluate the suitability of an area for a certain crop. The intensity, amount and timing of precipitation are also some of the critical element which can determine the suitability of an area for crops to be grown.With the help of these explanation and box 1 the qualitative land suitability analysis for the different groups of crops (C3, C4 and CAM) was done for Maichew area by comparing the actual climatic requirements of the crops. The length of growing period of Maichew is also greater than 130 days (Figure 3) which can accommodate the growing period requirement of many crops.
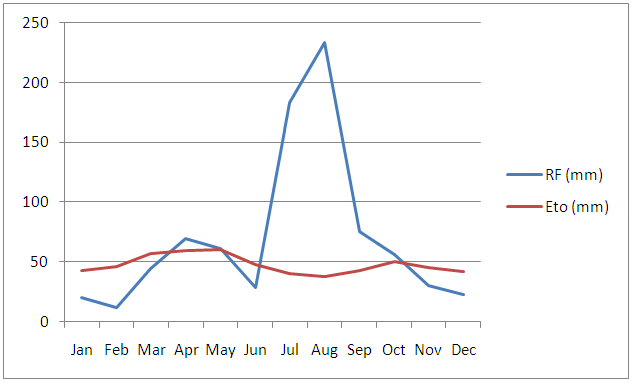 | Figure 3. Graphical representation of rainfall and evapotranspiration data, Maichew |
5. Conclusions
- If planning of agricultural development is to be successful, improved estimates of probable climatic characteristics and timing are critical. Hence a comprehensive analysis of rainfall, temperature, relative humidity, and etc. data is a crucial component in the management of agricultural production. Based on the computation of the climatic data, it is possible to say as C3, C4 and CAM plants can be grown in the Maichew area. Strategic crop production management is needed by analyzing the time series, start of rainy season and water balance of the long historical data for the prediction of a season to be wet or dry. Thus, this kind of information has to be used to assist farmers in selecting the appropriate crops that can best suit the agroecology of their localities. Special attention should also be given to evaluate the probabilities of extreme events (droughts, floods) and their effects on plant growth and yield.