-
Paper Information
- Next Paper
- Paper Submission
-
Journal Information
- About This Journal
- Editorial Board
- Current Issue
- Archive
- Author Guidelines
- Contact Us
International Journal of Agriculture and Forestry
p-ISSN: 2165-882X e-ISSN: 2165-8846
2016; 6(2): 59-68
doi:10.5923/j.ijaf.20160602.01

Modelling Soil Carbon from Agriculture and Forest Areas of Zimbabwe
 Abstract
 Reference
 Full-Text PDF
 Full-text HTML
Lizzie Mujuru1, Marcel R. Hoosbeek2
1Department of Environment Science, Bindura University of Science, Bindura, Zimbabwe
2Department of Soil Quality, Wageningen University, Wageningen, The Netherlands
Correspondence to: Lizzie Mujuru, Department of Environment Science, Bindura University of Science, Bindura, Zimbabwe.
| Email: |  |
Copyright © 2016 Scientific & Academic Publishing. All Rights Reserved.
This work is licensed under the Creative Commons Attribution International License (CC BY).
http://creativecommons.org/licenses/by/4.0/

Land management practices that increase soil organic carbon (SOC) contribute to climate change mitigation. Climate models validated with local data can be used as decision support tools for predicting the long term climate change mitigation potential of different land management scenarios. This study assessed the suitability of Rothamsted carbon model (RothC) to estimate carbon (C) sequestration potential of land management practices in Luvisols and Arenosols of Zimbabwe. The objectives of the study were to: compare measured SOC and simulated C in miombo woodlands, tillage and fertility treatments and their potential for future soil C storage; assess the sensitivity of Roth C model to temperature rise and compare equilibrium levels estimated using RothC with the levels estimated using the Langmuir equation. After establishing the baseline soil organic carbon (SOC) content for 1850, a 200-year simulation was run for seven management scenarios: A- conventional tillage (CT), B-ripping (RP), C - no tillage using a direct seeder (DS), D - Natural forest (NF), E- conventional tillage with no fertility amendments (control), F - conventional tillage with nitrogen fertiliser (N Fert) and G - conventional tillage with N fertiliser plus cattle manure (N Fert + manure). The total SOC decreased during the initial simulation period in all seven scenarios because the C input in all five scenarios was lower than that required to maintain the baseline 1800 SOC level. Annual rates of carbon sequestration were in the range of 0.001 to 0.02 Mg ha-1 yr-1 and 0.001 to 0.006 Mg ha-1 yr-1 in clayey and sandy soils respectively over the period 2010-2050. The highest C accumulation on clayey soil was under combined N Fert + manure whereas on sandy soils DS had highest accumulation rate. Under the changing climate scenario (1.5°C rise in temperature) the potential for additional C storage is limited in all land management practices on sandy soils whereas on clayey soils DS and NF are enhanced. Results show a stronger positive relationship between measured MaHF and HUM +IOM (R2 = 0.98) than between light fraction (LF) C and resistant plant material (RPM). Results have shown that linking RothC model with measured soil data, can be useful for estimating the potential C sequestration resulting from land management practices in Zimbabwean agro ecosystems.
Keywords: RothC, Soil carbon pools, Modelling, Climate change, Tillage, Fertilisation
Cite this paper: Lizzie Mujuru, Marcel R. Hoosbeek, Modelling Soil Carbon from Agriculture and Forest Areas of Zimbabwe, International Journal of Agriculture and Forestry, Vol. 6 No. 2, 2016, pp. 59-68. doi: 10.5923/j.ijaf.20160602.01.
Article Outline
1. Introduction
- Human activities have caused an increased atmospheric concentrations of carbon dioxide (CO2) and other heat-trapping gases. The average annual increase rose from 1.7 ppm between 1993 and 2003 to 2.1 ppm over the 2003-2012 decade. The concentration of atmospheric C rose to 393.31 ppm by March 2013 [1].Land use change has had a significant impact on global C stocks with cultivation reported to cause significant depletion of organic matter and releasing carbon dioxide (CO2) into the atmosphere [2]. Some of the major causes of CO2 release from the earth to the atmosphere are deforestation and degradation which are driven mostly by agricultural expansion and shifting cultivation [3], production of charcoal and fuel wood [4], legal and illegal timber logging [5] construction and wild fires. Agricultural activities that release C from the soil into the atmosphere include tillage and other forms of soil disturbances facilitating gaseous exchange between the soil and the atmosphere. Soil disturbances also enable the incorporation of plant materials into the soil [6]. Although agricultural activities have been identified as major sources of CO2 emissions, it is also possible to have agricultural activities that are adapted to reverse these negative effects and promote soil carbon sequestration in addition to other benefits of food security and sustainability of systems [7]. Soil C sequestration can offer a valuable offset for greenhouse gas emissions in agriculture, forestry and other land uses (AFLOU) [8]. Lal [9] stated that developing countries have the greatest potential for soil C sequestration since most of the soils are highly degraded and therefore below C saturation. Agricultural practices that reduce emissions and promote C storage can be designed to achieve sustainable land use but the need for simple, rapid monitoring methods cannot be over emphasised. A number of scientific evidence gaps are linked to the accuracy of C accounting, ascribed to a lack of data and uncertainties related to C storage and C flux models [10].Soil carbon models have been developed for prediction and provision of information on the rate of soil C sequestration or loss. Several models have been designed and reviewed by Smith et al. [11]. Among these are RothC, DNDC, CENTURY and DAISY all based on conceptual carbon pools with different turnover rates. The RothC model is among the models which have been identified by FAO [12] as a widely applicable easy to use model. The model has been applied in arable and non- arable soils [13-16] in many parts of the world although with limited applicability in Southern Africa. Changes in the rates of soil C sequestration due to changing environmental or management factors, can take several years to become apparent [17]. Therefore, future impact of agriculture activities and associated land use change can only be predicted by the use of observations in combination with models which can provide a means of evaluating the changing practices in the future. Currently, there is limited information on the potential for C sequestration in sandy and clayey soils of Zimbabwe especially on smallholder farmers’ fields despite the importance of SOC in soil biological activities which in turn affect soil physical and chemical properties. In this study, we test the applicability of the RothC model for predicting SOC in agricultural and natural forest soils of Zimbabwe. The model was run on seven selected common land management practices encompassing tillage intensities and fertility regimes. The objectives of the study were to: (1) compare estimates of soil C changes from measured and simulated C in tillage and fertility treatments, (2) assess the potential of different land management practices on future soil C storage (3) assess the sensitivity of Roth C model to temperature rise and (4) compare equilibrium levels from RothC with equilibrium levels estimated using the Langmuir equation.
2. Materials and Methods
2.1. Study Sites
- Modelling of tillage impacts was done on soils representing clayey and sandy soils from Hereford in Bindura district (17° 42΄ S; 31° 44΄ E), Nyarukunda in Shamva district (17° 00΄S; 31° 43΄E) and Murewa district latitude (17° 39' 13" S and longitude 31° 48' 30" E). A description of the sites is given by Mujuru et al. [18] and Mujuru et al. [19]. Briefly, Hereford soils are red clays varying from silty clay loam to clay, with characteristics corresponding to Rhodic Ferralsols [20, 21] and falling into the category of low activity clays [22]. Sandy soils, are derived from coarse granite covering almost 70% of Zimbabwe [23] and are classified as being in the Kaolinitic order, Fersiallitic group under the Zimbabwean soil classification, which corresponds to Ferric Luvisols [23-25] but using IPCC default classes derived from the harmonised world soils database [22] they can be classified them as Arenosols, (>70% sand and <8% clay) and are broadly referred to as sandy soils. Murewa soils are granitic sands (Haplic Arenosols) [21] which are strongly weathered having low levels of available nutrients and low nutrient reserves. These are interspaced with pockets of dolerite intrusions that give rise to small patches of relatively fertile clays (Chromic Luvisols) [20, 25]. Bindura represented clayey soils whereas Shamva represented sandy soils for tillage assessments whereas Murewa represented both clayey and sandy soils under fertility treatments.
2.2. Modelling of Carbon Sequestration Potential
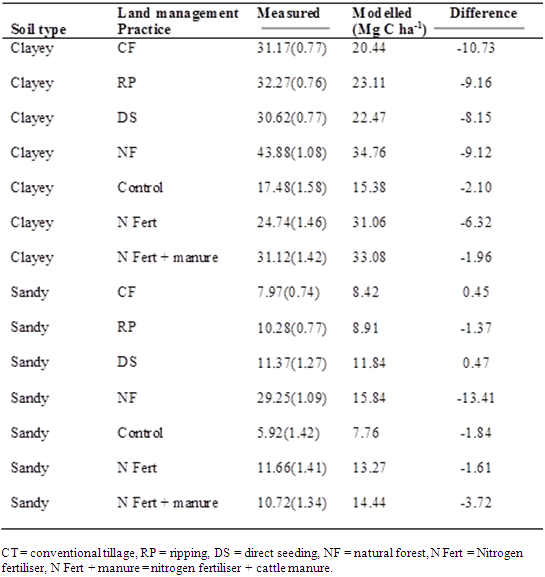
- Data for SOC for whole soil and density fractions under tillage and fertility treatments were obtained from Mujuru et al. [18] and Mujuru et al. [19] respectively (Table 1). The RothC model was applied for the prediction of SOC in each land management practice and evaluated with measured values obtained in 2010. The RothC model used in this study is based on monthly time step calculations that simulate SOC turnover over periods ranging from a few years to a few centuries [26, 27]. The model inputs were (a) climatic data (monthly rainfall (mm), monthly evapotranspiration (mm), average monthly mean air temperature (°C), Climate data were obtained from world climate database collection of meteorological data [28]. The ETO calculator [29] was used to estimate potential evapotranspiration based on temperature and rainfall of each specific location (b) Soil data (clay%, initial soil organic carbon (SOC) stock (Mg C ha-1), depth of the soil layer (30 cm), inert organic matter (IOM) (Table 1) approximated using equation (1) proposed by Falloon et al, [30] because the radiocarbon content was not known.
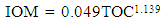 | (1) |
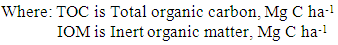 and (c) land use and land management data (soil cover, monthly input of plant residues (Mg ha-1), monthly input of farmyard manure (FYM) (Mg C ha-1), residue quality factor (decomposable plant material (DPM)/resistant plant material (RPM) ratio) [31]. Soil cover was based on whether the soil is bare or vegetated in a particular month and is indicated as either covered or fallow [31].
|
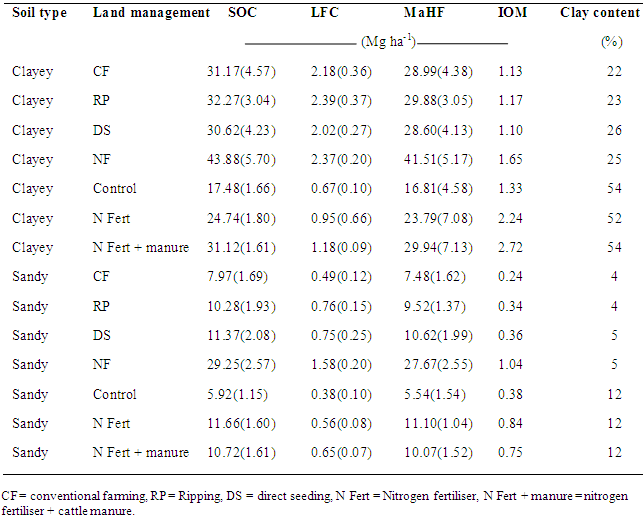
 | Figure 1. Structure of the Rothamsted Carbon Model [31] |
2.3. Comparison of Equilibrium SOC Levels from RothC and Langmuir Equation
- SOC equilibrium levels were estimated using the Langmuir equation and compared with equilibrium levels estimated by RothC model. The Langmuir equation can be used to evaluate the adsorption of light fraction C (LF C) onto mineral surfaces, and becoming mineral associated heavy fraction C (MaHF C) and is regarded as sequestered C [34]. We assumed that over time, the LF C decomposes and in part becomes adsorbed onto mineral soil particles as the MaHF C. In addition, soil minerals can randomly adsorb LF C until the MaHF has reached C saturation. Therefore, interaction between LF C and soil minerals follows adsorption and desorption processes that can be described using the Langmuir equation. Equation (2) shows the linearization used to fit the data following Yin and Cai [35] and Bolter and Hornberger [36].
 | (2) |
2.4. Data Analysis
- Relationships between mean values (± SD) for modelled and measured SOC and equilibrium C levels in each land management system were analysed using linear regression. The goodness of fit was tested using correlation coefficient (r) and root mean square error (RMSE) in addition to standard deviation. RMSE shows the percentage term for the total difference between predicted and observed values. The bias value was calculated as Yi – Xi where Yi = measured SOC or equilibrium level and Xi = modelled SOC or equilibrium level. A t-test was conducted to compare measured with modelled C. Significant differences were tested at p≤ 0.05.
3. Results and Discussion
3.1. Relationship between Measured and Modelled SOC Stocks
- The RothC model is designed to simulate soil C turnover in the soil using user estimates of the C inputs making the evaluation of the soil C turnover components easier. Inverse simulation techniques allow the determination of input needed to match the observed SOC. Running the RothC in reverse mode estimated the inputs required to attain the SOC stocks in 2010 for the seven scenarios in clayey and sandy soils. Carbon inputs on clayey soils with continuous conventional tillage, under control, N Fert and N Fert + manure in clayey homefields were higher (2.4, 4.5, 5.0 Mg C ha-1 respectively) than outfields (2.8, 3.8, 4.6 Mg C ha-1 respectively). Sandy soils followed similar trends of being higher in homefields (0.9, 1.5, 1.6 Mg C ha-1 respectively) than outfields (0.4, 1.0, 0.9 Mg C ha-1 respectively). Other models such as CENTURY do not use user defined C inputs as in the RothC model, because plant growth is simulated. The C inputs in RothC model are therefore not affected by simulation errors which can be carried over in further simulations. In sandy soils, the R2 values were lower than clayey soils probably because of the short term measurements and associated small SOC storage and capacity to change.Simulation modelling using the RothC model, showed good agreement between the simulated and observed SOC in treatments on sandy soils while on clayey soils, control, N fertiliser and a combination of N fertiliser and manure showed good agreement with small deviations (Figure 2). Highest measured SOC was found in natural forests on whilst lowest was in control treatments of both tillage and fertility treatments. Measured SOC on clayey soil was NF > RP > CF > N Fert + manure > DS > N Fert > Control whereas the modelled SOC was: NF > N Fert + manure > N Fert > RP > DS > CF > Control. The higher SOC in NF reflects the changes associated with conversion of forests to croplands. It was also clear that the cropping systems are characterised by lower SOC when compared with natural forests on similar soils [37]. Such C losses support the findings of Scholes and Hall [38] who showed that approximately 50% of SOC is lost in the first 20 years following conversion of tropical woodland, grassland or savannah. Such losses can be evident even after 5 years [9].
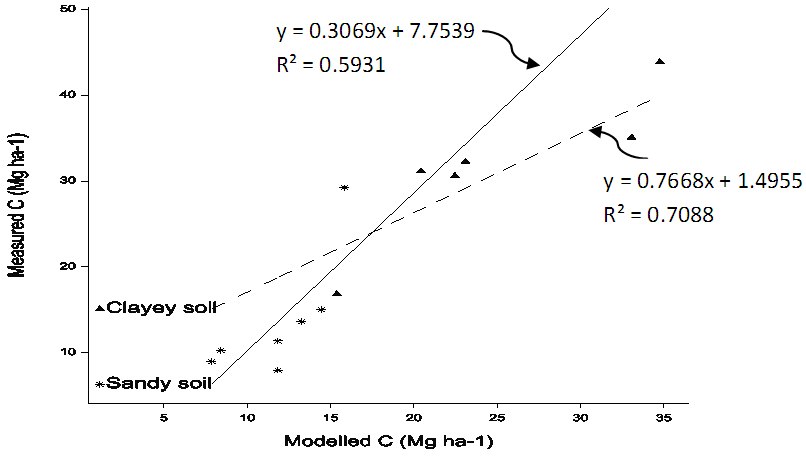 | Figure 2. The relationship between observed C stocks and modelled C stocks from RothC carbon model. * ------ = Sandy soils, ▲▬ = Clayey soils |
|
3.2. Relationship between Measured SOC Pools and Conceptual RothC SOC Pools
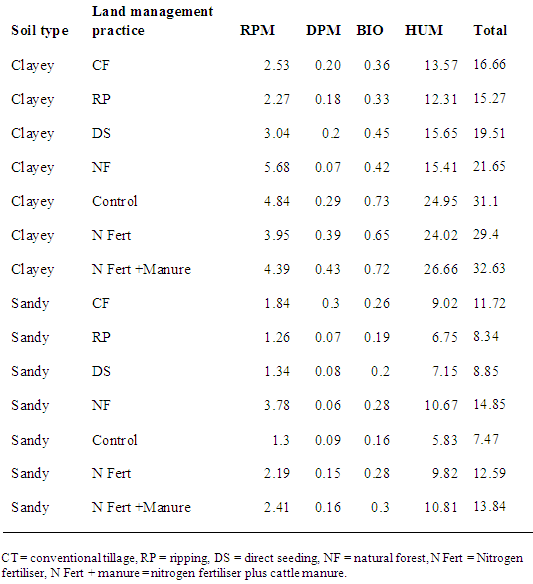
- Density fractionations were compared with model outputs of RPM+DPM and HUM+ IOM. Estimated resistant plant material carbon pool (RPM) in the RothC model and measured light fraction carbon (LFC) content were compared. The conceptual pools estimated using the RothC model for each site are shown in Table 3.
|
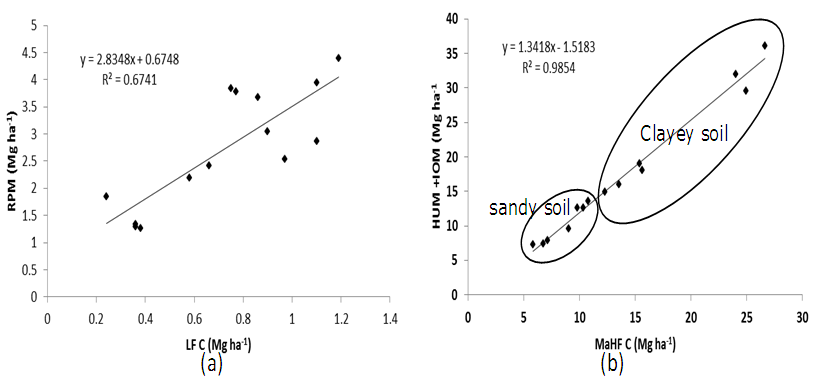 | Figure 3. Relationship between (a) measured LF C and model RPM and (b) MaHF C vs modelled HUM + IOM in sandy and clayey soils |
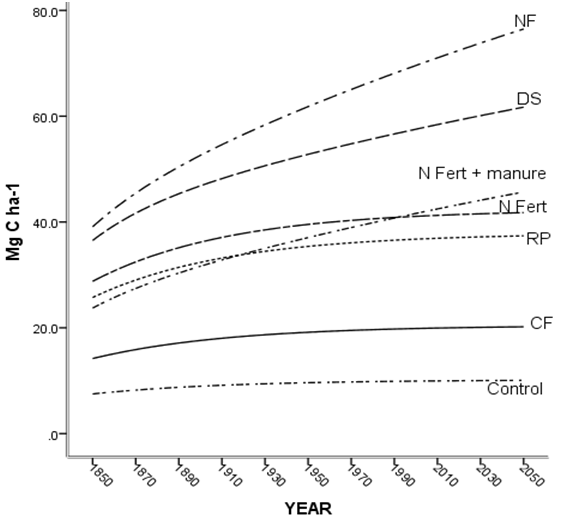
 | Figure 4. Predicted SOC in seven land management practices under current climate on sandy soils. CF = conventional farming with maize legume rotation, RP = Minimum tillage with maize legume rotation, DS = no tillage with maize legume rotation, NF = Natural forest, Control = Conventional tillage under continuous maize cropping (no fertility amendments), N Fert = conventional tillage under continuous maize cropping (nitrogen fertiliser 100 kg ha-1) and N Fert + manure = Conventional tillage under continuous maize cropping (nitrogen fertiliser + 5t cattle manure) |
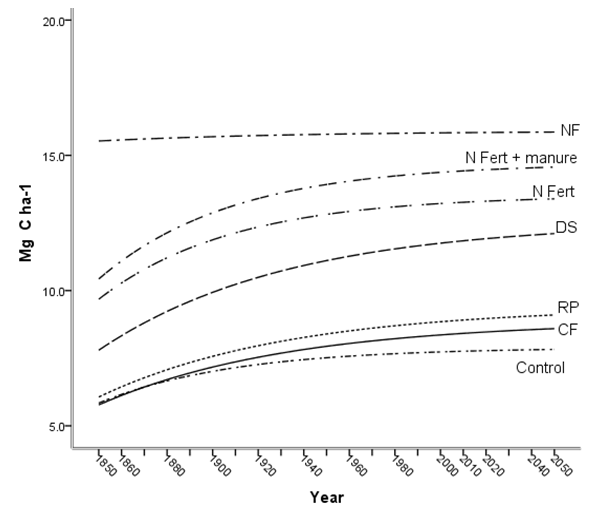
 | Figure 5. Predicted SOC in seven land management practices under current climate on clayey soils. CF = conventional farming with maize legume rotation, RP = Minimum tillage with maize legume rotation, DS = no tillage with maize legume rotation, NF = Natural forest, Control = Conventional tillage under continuous maize cropping (no fertility amendments), N Fert = conventional tillage under continuous maize cropping (nitrogen fertiliser 100 kg ha-1) and N Fert + manure = Conventional tillage under continuous maize cropping (nitrogen fertiliser + 5t cattle manure) |
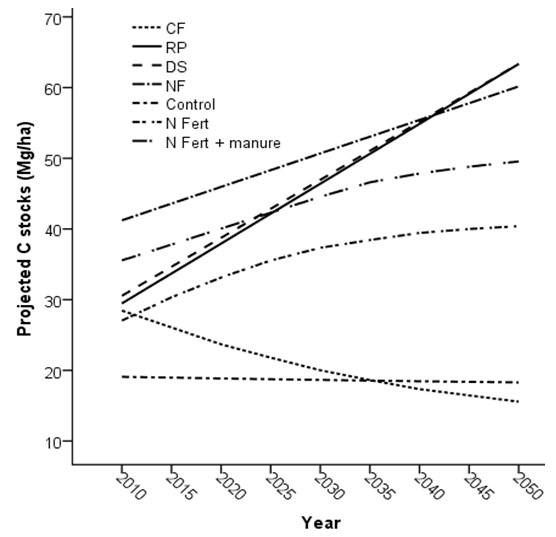
 | Figure 6. Fitted and projected SOC stocks on clayey soil up to year 2050 under temperature rise of 1.5°C. CF = conventional farming with maize legume rotation, RP = Minimum tillage with maize legume rotation, DS = no tillage with maize legume rotation, NF = Natural forest, Control = Conventional tillage under continuous maize cropping (no fertility amendments), N Fert = conventional tillage under continuous maize cropping (nitrogen fertiliser 100 kg ha-1) and N Fert + manure = Conventional tillage under continuous maize cropping (nitrogen fertiliser + 5 Mg ha -1 yr-1 cattle manure) |
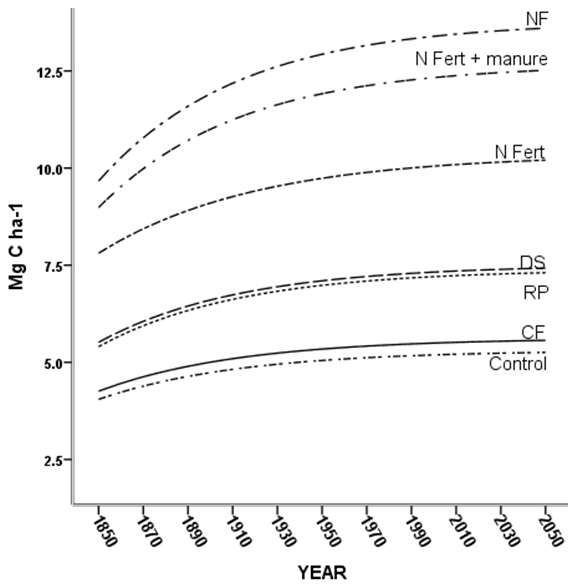 | Figure 7. Fitted and projected SOC stocks on sandy soil up to year 2050 under temperature rise of 1.5°C. CF = conventional farming with maize legume rotation, RP = Minimum tillage with maize legume rotation, DS = no tillage with maize legume rotation, NF = Natural forest, Control = Conventional tillage under continuous maize cropping (no fertility amendments), N Fert = conventional tillage under continuous maize cropping (nitrogen fertiliser 100 kg ha-1) and N Fert + manure = Conventional tillage under continuous maize cropping (nitrogen fertiliser + 5 Mg ha-1 yr-1cattle manure) |
3.3. Comparison of Equilibrium Level Estimation by Langmuir Equation vs RothC Model
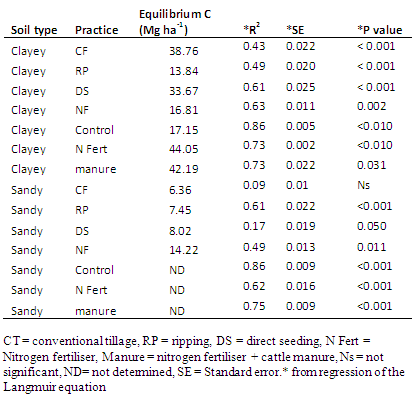
- The Langmuir equation could not estimate equilibrium levels for the three fertility systems (control, N fertiliser and N fertiliser + manure) due to poor model fit (Table 4) shown by R2 values below 0.50. A comparison of equilibrium levels estimated using the RothC model and Langmuir equation shows positive correlation between the two methods on clay soils (R2 = 0,87, P<0.01, SE = 4.86) (Figure 8). In clayey soils, measured SOC in CF, DS, N Fert and N Fert + manure were below equilibrium levels whereas RP, control and natural forest reached equilibrium. In sandy soils all systems were below equilibrium levels estimated by RothC as the Langmuir could not be applied to sandy soils due to poor model fit.
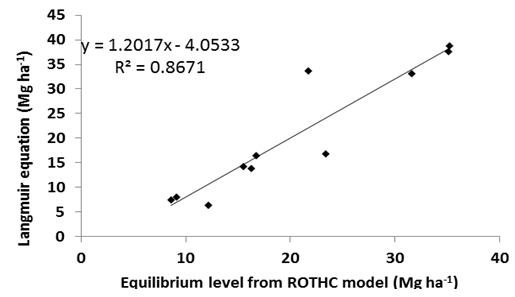 | Figure 8. Relationship between equilibrium levels estimated by RothC model and the Langmuir equation |
|
4. Conclusions
- RothC model is one of the most widely used models for the estimation and prediction of SOC stock on agricultural and forest land due to its successful evaluations in the past and the generally good availability of the input data required. The model was successfully used for estimating SOC stock under selected land management practices on clayey and sandy soils of Zimbabwe. On the basis of our results, it can be concluded that RothC 26.3 model pool of HUM + IOM is related to the MaHF measured from density fractionation and the model can be used to estimate SOC stock changes on Zimbabwean agricultural and forest soils. There was a good relationship between equilibrium levels estimated by RothC model and those estimated using the Langmuir equation. The model also showed that under current climatic conditions all systems except the natural forest on clayey soils have approached steady state. Holding other factors constant, a 1.5°C rise in temperature causes some of the systems on clayey soils to sequester more C than the current. The model is therefore sufficiently sensitive to a rise in global temperatures with sandy soils reaching an equilibrium much earlier than clayey soils. The modelling approach represents one of the most promising methods for the estimation of SOC stock changes and allowed us to evaluate the changes in SOC in the past period on the basis of measured data. However, since the data used was for short term experiments (4-9 years), results must be treated with some caution as they may require further ground validation from long-term experimental trials in addition to quantification of model output uncertainty.
ACKNOWLEDGEMENTS
- We appreciate assistance from Mr. Admore Mureva.