E. C. Merem1, J. Wesley1, P. Isokpehi1, E. Nwagboso2, S. Fageir1, S. Nichols1, M. Crisler1, M. Shenge1, C. Romorno1, G. Hirse1
1Department of Urban and Regional Planning, Jackson State University, Jackson MS, USA
2Department of Political Science, Jackson State University, Jackson MS, USA
Correspondence to: E. C. Merem, Department of Urban and Regional Planning, Jackson State University, Jackson MS, USA.
| Email: |  |
Copyright © 2016 Scientific & Academic Publishing. All Rights Reserved.
This work is licensed under the Creative Commons Attribution International License (CC BY).
http://creativecommons.org/licenses/by/4.0/

Abstract
With much of the subsidies directed at crop insurance, commodities, conservation and disasters, very little has been done in the literature to assess the changing impacts of subsidies and current efforts to mitigate the problems. While subsidy impacts in the Mississippi Delta do not operate in a vacuum, recent studies show they are attributed to a host of socio-economic and policy elements located within the larger agricultural structure. Considering the level of ecological changes in the region along with a host of issues, the impacts of agricultural subsidy in the study area merit a geo-based analysis. This paper adopts a mix scale approach of GIS based method and descriptive statistics and census data to analyze subsidy use in selected counties of the Mississippi Delta region. There is a focus on the issues, factors, mitigation efforts and future line of actions. The preliminary results show widespread dependence on subsidies and growing impacts in the form of environmental quality declines, changes in land areas and land use elements coupled with the geographic manifestation of the impacts and trends. While the impacts stem from various socio-economic and policy elements, the paper suggests the need for education, environmental considerations, policy changes and regular use of geo based analysis.
Keywords:
Mississippi Delta, GIS, Environmental impacts, Agricultural subsidy, Region, Degradation, Factors, Pollution
Cite this paper: E. C. Merem, J. Wesley, P. Isokpehi, E. Nwagboso, S. Fageir, S. Nichols, M. Crisler, M. Shenge, C. Romorno, G. Hirse, Assessing the Environmental Impacts of Agricultural Subsidy in the Mississippi Delta Region Using GIS, International Journal of Agriculture and Forestry, Vol. 6 No. 1, 2016, pp. 28-53. doi: 10.5923/j.ijaf.20160601.05.
1. Introduction
The Mississippi Delta region as a major agricultural hub is one of the most heavily farmed areas in the country and the state of Mississippi. With its vast agricultural structure, the region has for decades thrived on continual inflow of federal transfer payments and other forms of subsidies to sustain farming. Accordingly in the last several years, subsidies related to farming continue to rise among counties in the Mississippi Delta region [1]. Conceptually, agricultural subsidy refers to government assistance disbursed to farmers and agri-businesses to balance their income and manage the supply of farm commodities in order to shape the marketing of these products [2-4]. They consist of several produces including wheat, food grains, cotton, milk, rice, peanuts and others. Under the program, the Federal government provides various assistances to farmers in the form of price supports and price floor programs as well as crop insurance to ease the financial burdens of lost crops and falling prices. This also involves state procurements of surplus farm produce and safety net for domestic crop producers in case of volatility using international trade agreements. Considering the seemingly, harmful side of agricultural subsidies in the market place and the linkages to unnecessary taxes and fiscal burdens on citizens. In as much as subsidies distort trade, poor farmers and environmental quality are often impacted in the global south as well [5, 6].Most subsidies are characterized by their contentious nature due to the multifaceted effects and the infiltration of politics which relies heavily on lobbying from those representing the farm sector. In the face of that, the larger agricultural structure of the Delta region has been experiencing various forms of changes including declining land base, rise in water use, widespread applications of fertilizers and agro-chemicals and a mounting threat to the surrounding ecology. Considering that subsidy opponents criticize the over use of fertilizers and pesticides in the cultivation of fertile croplands while bringing marginal farmland into production. In the United States, excessive fertilizer use and pesticides prompted by subsidies result in unintended environmental harms. In their quest for subsidies, farmers often cultivate marginal farmland even when the fragile soil lacks the ingredients and capacity to resuscitate exhausted nutrients [1]. Regarding the costs, the US Department of agriculture disburses around $10 billion and $30 billion in cash subsidies to farmers and owners of farm land yearly. The particular amount hinges on market price for crops, the level of disaster payments and the other factors. As a result, about 90% of farm assistance is set aside for farmers of five major crops with the most notable being wheat, corn, soya beans, and cotton [7]. While over 800,000 farmers and land owners collect subsidies, the disbursed money goes mostly to producers. Aside from conventional monetary handouts, the USDA offers subsidized crop insurance marketing support and other funding and services to farm businesses. The USDA also undertakes cutting edge agricultural research and collects the much need econometric and scientific information for the sector. Such types of indirect assistance carry a price totalling $5 billion yearly at the expense of public treasury which results in $15 billion to $35 billion in farm assistance on an annual basis. With much of the subsidies in the Delta directed at crop insurance, commodities, conservation and disasters, very little has been done in the literature to assess the changing impacts of subsidies and current efforts to mitigate the problems in the study area. Apart from the rising disbursement of subsidies to the counties and changes in the larger farm structure [8], there are growing ecological risks from farm subsidy activities in the Mississippi Delta (Fig 1). This involves mounting pollution threats faced by the head waters through the extensive spraying of chemicals to boost productivity, coupled with fertilizer and pesticide run offs, high nutrient loadings and sediments from agricultural sources [9]. These threats are compounded by the magnitude of farmland declines, loss of farms [10], and presence of chemical residues on the farm fields decades after use, and the ensuing damage to the ecosystem and water resources [9]. The health impacts of subsidized agriculture which has been noted in the literature by numerous sources [11-14] also involves a correlation between subsidy and poor health [15], including obesity. Added to that are problems of structural inequality at the expense of small farms [5, 6] and the emerging ecological externalities [16-24]. Given the localized nature of these impacts, very little has been done to track the overall environmental impacts of subsidy using GIS in the Mississippi Delta. Even though GIS has found widespread applications in the literature in other related areas [25-29]. This paper will fill that void in the literature by analysing the environmental impacts of farm subsidy in the region using GIS. There is a focus on the issues, trends, impacts, factors, mitigation efforts and future line of actions. The first aim of the paper is to analyse the recent trends in agricultural subsidy disbursement. The second objective assesses the impacts government payments to farmers have on the environment in the Mississippi Delta region while the third objective examines the factors fuelling ecological risks of heavy subsidy disbursement. The fourth and last objective focuses on the identification of mitigation measures and the development of a decision support tool to guide policy makers.
2. Methods and Materials
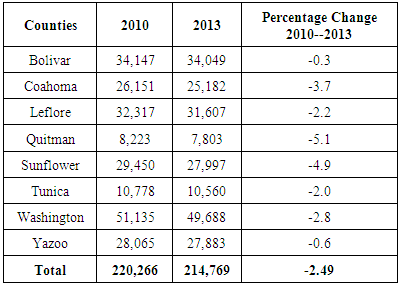
The study area in Figure 1 stretches through 5,226.67 km2 in 8 counties in the Mississippi Delta. Between 2010 through 2013, the population of the region in Table 1 dropped from 220,266 to 214,769 at a rate of -2.49% [30]. Being a heavily subsidized and intensively farmed region, the flat fertile soils produce a variety of crops including cotton, corn, and soya beans. With its rich environmental features of wildlife habitats and adjacent streams [1], the nearby head waters are vulnerable to elevated sediments and nutrients from heavily subsidized agricultural fields. 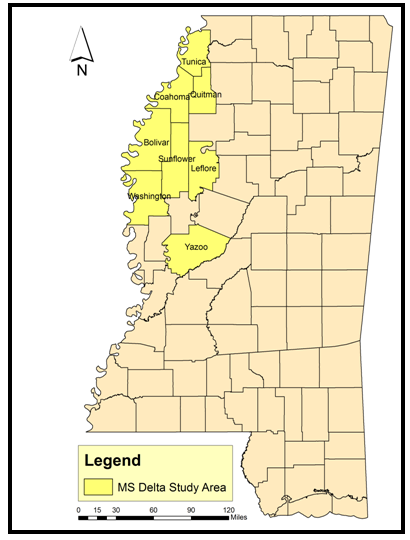 | Figure 1. The Study Area |
Table 1. The Population of the study area
 |
| |
|
Notwithstanding the increasing levels of subsidy distribution to the farmers and variations embedded in the common agricultural structure [8], environmental hazards from subsidy laden farm fields in the Mississippi Delta region continue to grow. In the region, close to about 19 watersheds between 2002 to 2012 suffered from different forms of impairment in the form of pollution threats prompted by heavy treatment of land with chemicals to boost productivity, fertilizer and pesticide runoffs, high nutrient loadings and sediments emanating from farm fields. The magnitude of these hazards is compounded by the sheer size of agricultural land disappearance, loss of farms, and the continual presence of elevated traces of chemicals on the farm fields’ decades after the actual applications coupled with the ongoing degradation of the ecosystem and water resources [9, 10]. The expectation is that a geo-spatial analysis anchored in a mix scale approach connected to descriptive statistics would provide the preambles for assessing subsidy use in the Delta.
2.1. Methods Used
The paper uses a mix scale temporal-spatial data approach involving descriptive statistics, agricultural census information and primary data connected to geographic Information Systems (GIS) to display the trends spatially. The spatial information for the research was obtained from the United States Department of Agrculture (USDA), the United States Environrmtal Protection Agency (EPA), The United States Geological Survey (USGS), as well as state agencies like The Mississisppi Department of Environmental Quality (MDEQ). Other sources include non governemntal orgnaizations such as the Environrmntal Working Group (EWG) and farm groups. All in all, the agricultural census data, subsidy information, the subsidy money and county rankings came from the USDA’ National Agricultural Statistcal Service (NASS) for the periods of 1997-2012 while the Mississippi Department of Environmental Quality (MDEQ) office of pollution controll provided state and county wide information on watershed impairment and pollution on the Delta region for 2003-2010. In the process, federal geographic identifier codes of the state were used to geo-code available information and the socio-economic and environmental variabales contained in the data sets. This information was analyzed with basic descriptive statistics, and GIS with particular attention to the temporal-spatial trends at the state and regional level. As mentioned earlier, this was made possible by the retrieval of spatial data sets of shape and grid files from the Mississippi Automated Resource Information System (MARIS) in digital form using ARCVIEW GIS. Part of the spatial data also came from land-use capability and classification maps for the study area. The statistical output of the variables from the spatial units were mapped and compared across time in ARCVIEW GIS. The relevant procedures consist of two stages.
2.2. Stage 1: Identification of Variables, Data Gathering
The initial step in this research involved the identification of variables required to analyse changes at the county level from 1995 to 2012. The variables consist of socio-economic and environmental information, including size of agricultural land in acres, the number of farms, the size of farm land treated with insecticides, market value of land and building, the size of farm land treated with fertilizer and chemicals, population size, commodity credit loan, the amount of federal transfer payments to farms, the size of cropland, the size of irrigated farm land, number of farms with fertilizer, subsidy types, the number of subsidy recipients, the percent of subsidy type, the percent of subsidy amount, the dollar value of allotted subsidy, the rankings of county and the percentage of change. These variables as mentioned earlier were derived from primary sources made up of government documents, newsletters and other documents from NGOs. This process was followed by the design of data matrices for socioeconomic and land use (environmental) variables covering the census periods from 1997, 2002 to 2007 to 2012. The design of spatial data for the GIS analysis required the delineation of county boundary lines within the study area as well. Given that the official boundary lines between the 8 counties remained the same, a common geographic identifier code was assigned to each of the area units for analytical coherency.
2.3. Stage 2: Step 2: Data Analysis and GIS Mapping
In the second stage, descriptive statistics and spatial analysis were employed to transform the original socioeconomic and land-use data into relative measures (percentages, ratios and rates). This process generated the parameters for establishing, the extent of environmental change induced by farm subsidy and the trends across the region for each of the 8 counties through measurement and comparisons overtime. While the spatial units of analysis consist of counties, watersheds, region and the boundary and locations where subsidy blossomed, this approach allows the detection of change, while the graphics highlight the agricultural landscape impacts, land-loss and subsidy trends. The remaining steps involve spatial analysis and output (maps-tables-text) covering the study period, using ARCVIEW11. With spatial units of analysis covered in 8 counties (Figure 1), the study area map indicates boundary limits of the units and their geographic locations. The outputs for each county were not only mapped and compared across time but the geographic data for the units which covered boundaries, also includes ecological data of land cover files and paper and digital maps from 2002 -2013. This process helped show the spatial evolution of subsidy trends, the ensuing environmental impacts, ecological degradation as well as changes in other variables and factors driving subsidy proliferation and impacts in the study area.
3. Results
This section of the paper presents the results of the data and environmental analysis of farm subsidy in the study area. There is an initial emphasis on the extent and nature of farm assistance and the trends. This is followed by a temporal analysis of farm land use, percentage of change, environmental impacts, spatial analysis of GIS and the factors responsible for the rising subsidy in the Delta region.
3.1. The Analysis of Subsidy Trends
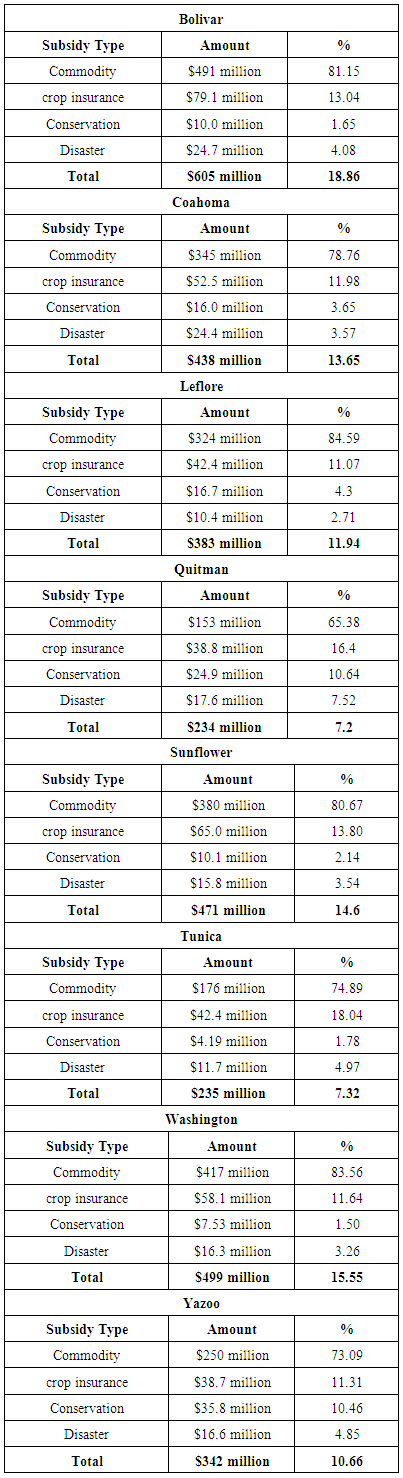
Between 1995 through 2012, the Delta region took in $3.207 billion at an average of over 400 million in subsidies. The disbursed money during the period in question went to commodity crop insurance and others including conservation and the containment of natural disasters. Of the total of $3.2 billion in subsidy for the region during 1995-2012, Bolívar County emerged as the highest recipient of government assistance worth $605 million. The other groups of destination for large subsidy totalling over $400 million dollars consist of the counties of Washington, Coahoma and Sunflower. During the same period, Leflore and Yazoo counties all benefited from government payments estimated at $383 to $342 million while farmers in Quitman and Tunica obtained over two hundred millions dollars in federal assistance (Table 2). Table 2. Subsidy Summary among Mississippi Counties 1995-2012
 |
| |
|
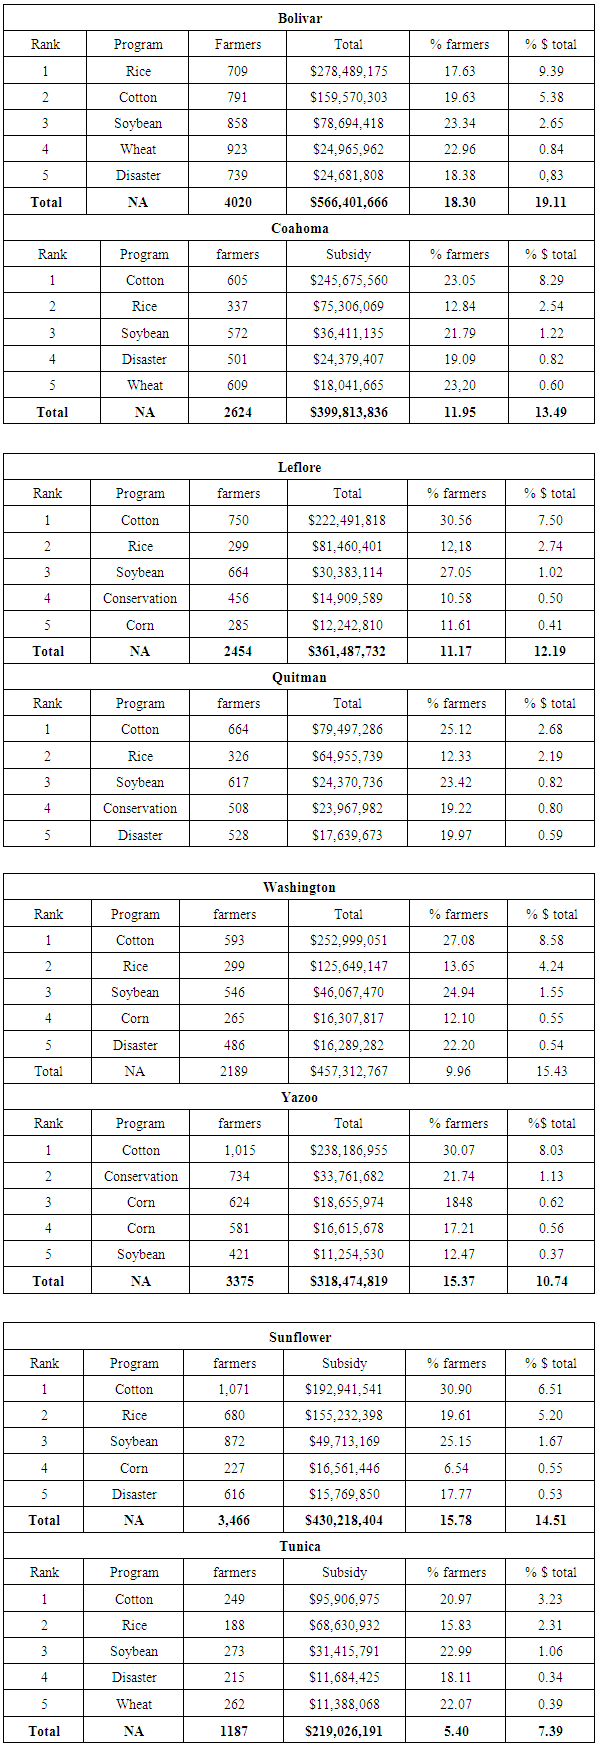
One major thing worthy to note in the subsidy disbursement of the region is that commodity accounts for the greater percentage of the assistances worth hundreds of millions followed by crop insurance. This can be buttressed by looking at the high percentage levels of both variables within the counties. From the data, the overall percentage of commodity under the total subsidy exceeded the 80% mark in 4 counties (Bolivar, Leflore, Sunflower, and Washington) followed by higher margin of percentages numbering 78.76, to 65.38, and 74.89, to 73.09 in Coahoma, Quitman, Tunica and Yazoo. With the second tier variable of crop insurance mostly in low double digit percentage points of over 13-18% and above holding firm in the counties of Bolivar, Sunflower, Quitman and Tunica. The remaining crop insurance percentage distribution stood at 11% plus in four other counties (Yazoo, Washington, Leflore and Coahoma) between 1995-2012. The other subsidy types of conservation and disaster aids attracted only single digit percentage equivalence in assistance during those years (Table 2). Additional elements of the subsidy trends in the Delta between 1995 through 2012 are presented in table 3. The table covers the rankings of subsidy programs available to farmers in the Delta and the number of beneficiaries, the total amounts and the percentages. In recognizing the needs of the 21,958 recipients about $2,963,166,831 in subsidy funds were earmarked across the eight counties for different programs. With the growing demands for farm aid under the scheme, the top five programs comprising of rice, cotton, wheat, soybean, disaster payments, conservation reserve program and corn have long been known to dominate the Delta landscape over the years.Amongst these programs, based on the table, cotton ranks as the 1st overall in the counties in terms of the number of farmers targeted and the allotted dollar amounts followed by rice and soya bean. With the conservation reserve programs only limited to 3 counties of Leflore, Quitman and Yazoo, Soya bean subsidy and disaster funds served valuable use in a hand full of counties as well. Federal assistance for corn farming on the other hand seemed confined solely to Leflore, Sunflower and Washington. In the individual counties, Bolivar, Sunflower and Washington stood out as the most heavily subsidized of all counties in every category in the Delta while Coahoma, Leflore, Yazoo and three other counties (Quitman and Tunica) rounded up in the lower tier areas. Of the 8 counties under analysis, Bolivar with 4,020 recipients appropriated $566,401,666 worth of funds. Washington and Sunflower distributed over 400 million dollars ($457, 312,767-, $430, 218, 404) in subsidy money to 2,189 - 3,466 beneficiaries during the 17 year period. Other areas such as Coahoma, Leflore and Yazoo also had thousands of beneficiaries (estimated at 2,624, 3,375 and 2,454) who took in over three hundred million dollars in assistance to boost farming ($399, 813, 836-$318, 474, 819-$361, 487, 732). Elsewhere, during the same periods, both the counties of Quitman and Tunica all took in over $200 million ($210,431,416-$219,026,191)in farm aid for recipients totalling 2643 to 1187 (Table 3). Table 3. Subsidy Summary for Recipients 1995-2012
 |
| |
|
Additionally, disaster payments in the places where they were disbursed were not only in tens of millions, but they accounted for over $24 million of allotted money in Bolivar and Coahoma. Just as the top subsidy programs attracted higher enrolments through the recipients and large dollar amounts, the percentages reflect that trajectory as well. A case in point is that with the exception of Bolivar county where total percentage of cotton enrolees and total dollar amounts stood at 19.63% to 5.38%. In the other areas, the percentage of recipients grew (from 20 to over 30% and 6%) in most of the counties (Table 3).
3.2. Farm Land Use Change
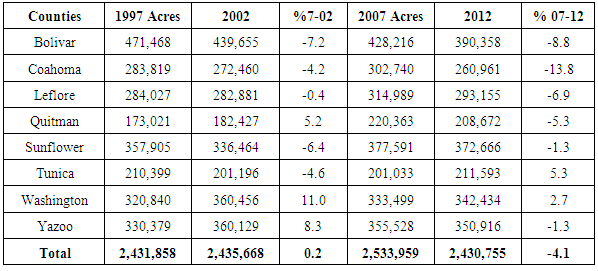
Being a heavily farmed region, the study area contained over a total of over 2, 400,000 acres in each period over the four census periods. Within those periods the 8 eight delta counties had a total of 2,431,858 to, 2,435,668 from 1997 to 2002 and by the next five years, the size of agricultural land fell from 2,533,959 to 2,430,755 acres. At the county level, Bolivar not only emerged with substantial farm acreages than the others, but the county’s farm land area of 471,468 acres to 439,655 in 1997 through 2002 tumbled further by 428,216 to 390,358 acres in the next periods of 2007 and 2012. Just as medium land acreages in a trio of other areas (Sunflower, Washington and Yazoo) stood at the over 300,000 acre level, Coahoma and Leflore and Tunica had farm land areas measured at over 200,000 acres during the four censuses. Of these counties, Quitman averaged 196,121 acres which is a little bit lower compared to the counties in the delta. For the individual counties, Sunflower saw its initial acres of (357,905 to 336,464) change by 377,591 to 372,666. The same can be said of Washington and Yazoo counties where sizable areas of land (320,840 -330,379, 360,456 and 360,129) were devoted to farming during the periods of 1997 through 2002. By 2007 and 2012, the distribution of land acreages for farming remained at 333,499 to 342,434 for Washington and 355,528 to 350,916 at Yazoo County. With identical estimates of land acreages (of 283,819, 284-127,280,000 and over 300,000-260,000) Coahoma and Leflore, surpassed Quitman during the four census periods. The low farm acreages for Quitman are evident with 173,021 to 182,427 in 1997 through 2002. In the ensuing periods of 2002 -2012, Quitman’s farm land areas dropped from 220,363 to 208,672 acres (Table 4). Table 4. The Size of Farmland among Mississippi Delta Counties
 |
| |
|
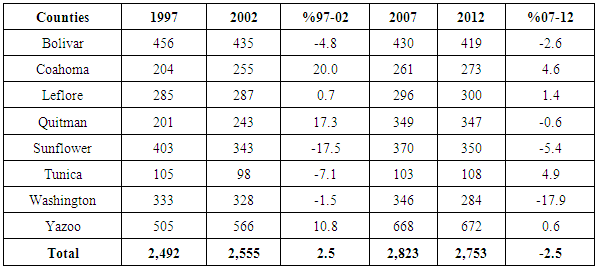
Regarding the number of farms in a span of four censuses, the study area averaged about 2,656 farms among the counties between 1997 through 2012. Within those periods, Yazoo County outpaced most areas in the delta with over 500 farms during the censuses of 1997 to 2002. The trend continued as Yazoo’s farm numbers soared by 668 to 672 all through 2007 to 2012. During the same period, Bolivar county had sizable farm numbers estimated at 456 to 435 and 430 to 419 farms between 1997 and 2002 while Washington county saw its farms go from opening estimates of 333 and 328 to 346 - 284. With over 200 farms in both censuses of 1997 to 2002 for Coahoma and Leflore, by 2007 to 2012 their farm numbers stood at 261 to 296 followed by a gradual climb to 273 and 300 respectively. Quitman on the hand had opening estimates of 201 to 243 in the first 5 years, by the next period, the farm numbers stood at 349 to 347. Known for its lower farm numbers, the estimates for Tunica were in the low hundreds much of the time with the exception of 2002 census when it finished with only 98 farms. In the other years (1997, 2007, 2012) the numbers were in the order of 105, 103, and 106 respectively (Table 5). Table 5. Number of Farms
 |
| |
|
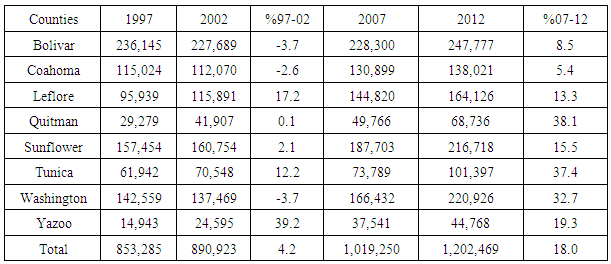
In terms of irrigated land in the Delta region, the surging numbers over the years were less than a million acres (853,285, 890,923) in the first two censuses of 1997 through 2002. By 2007 - 2012 the region irrigated about a million plus acres (1,019,250-1,202,469). In the area, Bolivar County stands as the lead county with larger acreages of 236,145 to 227,669 and 228,300 to 247,777 between 1997 through 2012. The four groups of counties with abundant land under irrigation in the Delta include Sunflower, Washington, Coahoma and Leflore. Of these areas, farmers in Sunflower irrigated numerous acres comprising of 157,454 to 160,754 in 1997 to 2002 and 187,703-216,718 in the following 5 years. For Coahoma, irrigation farming during the census periods under analysis covered several acres in the neighborhood of 115,024 - 112,070, and 130,899 and above. During the census periods of 1997-2012, the volume of irrigated land farming in Washington County also covered hundreds of thousands of acres estimated at 142,559,137,469, 166,432, and 220,926. With the exception of 95,930 acres of which Leflore devoted to irrigation in 1997, water sprinkling on farms picked up steam with notable activities involving 115,891,144,820 to 164,126 acres during the periods of 2002, 2007 and 2012 (Table 6).Table 6. Irrigated Land in acreages
 |
| |
|
Looking further onto the Table, one noticed three counties (Quitman, Tunica, and Yazoo) with land under irrigation mostly below 74,000 acres. The acreages were not only lesser than the previous areas but remained on the rise over the years. Beginning with Quitman County where farmers irrigated 29,279 to 41,907 in 1997 through 2002, the acreage numbers rose further by 49.766 to 68736 between 2007 and 2012. Tunica followed up in a similar vein by irrigating vital portions of land measuring 61,942, 70,548 and 73,789 to 101,379 acres. Yazoo’s irrigated land went from 14,943 to 24,595 acres and continued the surge with more acreage (37,541 to 44,768) in the censuses of 2007 and 2012. In the process, the use of irrigated land in the region stayed on the rise (Table 6).
3.3. Percentages of Change in Land Use Elements
With a minuscule gain of 0.2% in 1997 through 2002, the study area saw its farm land area decline by -4.1% during the 2007-2012 censuses. This is different from the notable declines in the 1997 -2002 census as evidenced in five of the eight counties. The frequency of farm land loss reached critical levels when it occurred in 6 of 8 counties during the 2007 -2012 census periods. Notwithstanding the gains of 11.0% to 8.3% posted by Washington and Yazoo between 1997-2002, the 5 counties of Bolivar, Coahoma, Leflore, Sunflower and Tunica all experienced significant losses (-7.2%, -4.2%, -0.4%, -6.4%). The severity of farm land declines in the region is clear with the double digit drops (of 13.8%) at Coahoma in 2007-2012 coupled with the falling numbers for Bolivar, Leflore, Quitman and Washington. From the table, these counties experienced visible losses (of -8.8, -6.9, -5.3 and 1.3%) during the 2007-2012 periods (Table 4). The percentages of change showed that aside from a minor gain of 2.5% between 1997 through 2002, the available number of farms dropped by a similar margin of -2.5% in the study area by 2007 through 2012. Accordingly, in the region, there exists a mix of gains and declines within the counties. Amongst them, Coahoma, Leflore, Quitman and Yazoo all posted gains (20.0%, 0.7%, 17.3% and 10.8%) while Bolivar, Sunflower, Tunica and Washington experienced declines in their number of farms (-4.8%-17.5%,-7.1%-1.5%). In the ensuing periods of 2007-2012, Coahoma, Leflore, Tunica, and Yazoo all experienced some surge in their farms at various rates (of 4.6%, 1.4%, 4.9% to 0.6%), while four other counties, Bolivar, Quitman, Sunflower and Washington saw their farm numbers drop (by -2.6%, -0.6%, -5.4% to 17.9%). From the table, the level of declines and gains seemed evenly split with four counties represented in both categories during the censuses of 1997-2002 and 2007 -2012. The evidence of gains comes with the back to back increases of 20.0% to 4.6% for Coahoma (Table 5).The practice of irrigation farming rose from 4.2% between 1997 through 2002 to double digit figures of 18.0% in 2007 -2012. With irrigated land use increases in 5 of 8 counties during the periods of 1997-2007, by 2007-2012 the percentage gains not only occurred in all 8 counties, but it reached an all-time high with mostly double digit gains in 6 counties while two others finished in single digits. Considering the sustained losses of -3.7 to 2.6% in three counties (Bolivar Coahoma and Washington) during the 1997 through 2002, another group of counties most notably, Leflore, Quitman, Sunflower, Tunica, and Yazoo saw notable gains (17.2% 30.1, 2.1, 12.2 and 39.2) in percentage points of irrigated land use. The robust gains in 2007-2012 occurred among three counties (Quitman, Tunica, and Washington) with increases exceeding over 32% while three others Leflore, Sunflower and Yazoo posted double digit gains of 13.3%, 15.5 and 19.8%. Both Bolivar and Coahoma also experienced single digit increases of 8.5 to 5.4% during the same period (Table 6).
3.4. Environmental Impacts
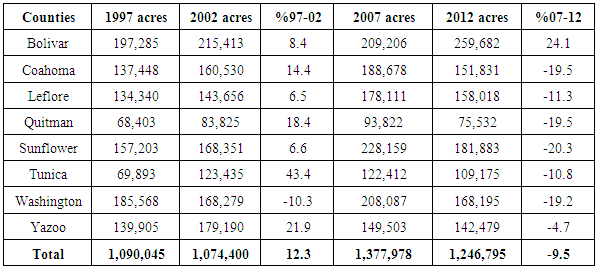
The overall land treated with fertilizer for the region reached over a million acres (1,090,045, 1,074,400 to 1,377,978 -1,246,795) in the four censuses. Based on the information, Bolivar County emerged as the biggest user with 197,285-215,413 acres treated with fertilizers and chemicals during the initial periods of 1997 through 2012. By 2007 through 2012, the county stepped up its further use with additional acreages (209.206 to 259.682) covered with nutrients. In the same periods, intense fertilizer applications continued in the counties of Coahoma, Leflore, Sunflower, Washington and Yazoo. In first two counties of Coahoma and Leflore, the frequent treatment of land with chemicals consists of opening acreages of 137,448 to 134,340 and 160,530 to 143,656. This practice went on with further application of nutrients on vast areas measuring 188,678 -158,018 for Coahoma and 178,111 to 158,018 in the Leflore area during the censuses of 2012 through 2007. The widespread treatment of land to boost productivity went unabated in both Washington and Yazoo counties with 185,568 to 168,279 and 139,905 to 179,190 acres in 1997 and 2002. Further along the years, fertilizer usage reached significant levels in both counties at 208,087 -168,195 and over 142,000 acres. Elsewhere, Quitman and Tunica also engaged in fertilizer and chemical treatment of land by devoting notable acreages (68,403-69,893 and 83,825-123,435) to nutrient treatment. Even though Quitman’s use of fertilizer only covered less than 100,000 acres(93,822-75,532), at Tunica nutrient applications were directed at over 100,000 acres (122,412-109,175) of land during the census of 2017 and 2012 (Table7). Fertilizer stayed on the rise in the region during 1997 through 2002 but dropped sharply in all counties by 2007 through 2012. Furthermore, the entire region’s fertilizer rose by 12.3 in the first five years but only to decline by -9.5% in the following census periods of 2007-2012. In the study area, Washington County stood out as the only county that saw a notable decline (of -10.3%). While the other 7 counties made gains in 1997-2002. The counties of Tunica, Yazoo, Quitman and Coahoma saw the highest gains (of 43.4% to 21.9% and 14.4%-18.4%) in fertilizer use. These rates of nutrient applications exceeded the percentage points (of 8.4%, 6.5-6.6%) at Bolivar, Leflore and Sunflower in the first censuses. By the next periods of 2007 through 2012, there came a profound decrease in fertilizer use in all counties with the exception of Bolivar which saw a 24.1% gain. With double digit declines (19.5-, 19.2-20.3% and 10.8-11.3) among the counties from Coahoma to Washington, only Yazoo posted a decline of -4.7% in the 2007-2012 periods (Table 7). Table 7. The Size of Land Treated with Fertilizer and Chemicals
 |
| |
|
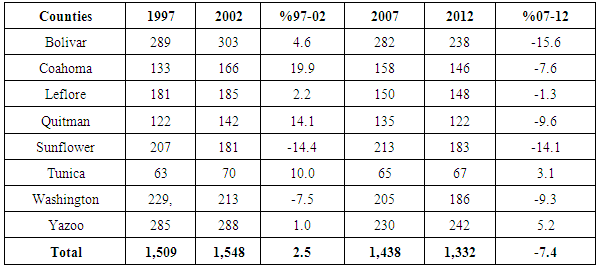
As a common practice, the region had a total of 1.509 to 1.548 farms under nutrient treatment in 1997 and 2002, but it subsided slightly in 2007 to 2012 with only 1,438 to and 1,332 farms in that category. In the individual areas, four counties Bolivar, Sunflower, Washington, and Yazoo engaged in more chemical and fertilizer treatments than the others. During those years, Bolivar county not only directed nutrient applications on hundreds of farms (289-303 and 282-238), but Sunflower engaged in the same practice (on 207 to 181 and 213 to 183 farms) in the subsequent years. Given their known effects on the surrounding ecology of the region, both Washington and Yazoo pursued the relentless use of chemicals on numerous farms (229 – 213 and 285- 288) during 1997 through 2002. Those numbers varied significantly in the latter years by 205 to 230 and 186-242. The other counties with chemical and fertilizer treatment of farms in the low one hundreds include Coahoma, Leflore, and Quitman at an astonishing pace in all censuses. These include the initial group of farms numbering 100 plus (133, 181,122 to 166,185, 142) and others in that category (158,150,135) in the three counties. In all those years, Tunica’s nutrient applications focused solely on a much fewer number of farms estimated at 63-70 and 65-67 (Table 8). Table 8. Number Farms Treated with Chemicals and Fertilizer
 |
| |
|
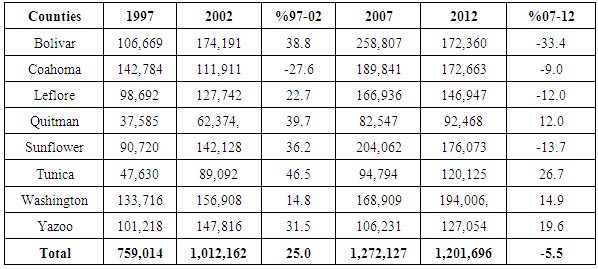
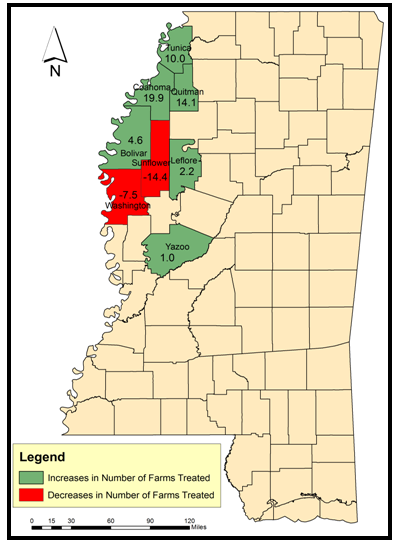
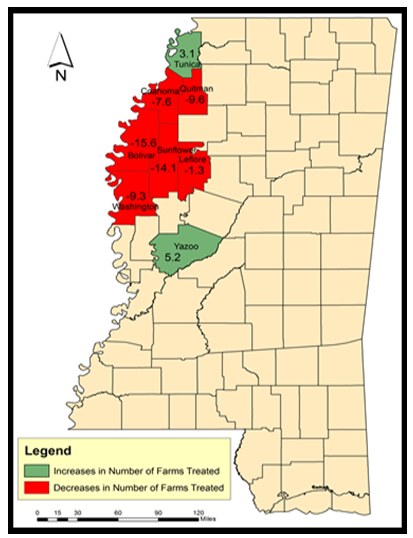
Just as in the previous variable in acreages, the percentage of change in the number of farms under nutrient applications rose by 2.5% but only to drop by -7.4% during the census periods of 1997-2002 and 2007-2012. From the heavy use of nutrients, a huge portion of the counties saw visible increases in the application rates while two others Sunflower and Washington experienced declines of -14.4 to -7,5% between 1997-2002. With the highest gains in mostly double digit figures of 19.9%, 14.1, and 10.0% percentage points, three counties (Coahoma, Quitman, and Tunica all stood out while Bolivar, Leflore, and Yazoo saw soft gains of 4.6%, 2.2 to 1.0%. The decline in nutrient treatment of farms under use is manifested in 7 of 8 counties with the most visible drops of 15.6% -14.1% at Bolivar and Sunflower counties. Quitman and Washington also experienced declines of over 9% while Coahoma and Leflore posted losses estimated at -7.6% to 1.3%. The rates of gains for Tunica and Yazoo counties mostly in single digits stood at 3.1 to 5.2 percentage points (Table 8). Considering the risks posed by insects and pests to farming in a heavily subsidized region, large acreages of farm land are subjected to regular spraying with insecticides. The region’s use of insecticides started at 759,014 acres in 1997 census but only to surpass the million acre mark (1,012,162, 1,272,127, 1,201,696) in 2002, 2007, and 2012. Of the eight counties in the Delta, Bolivar’s insect control efforts targeted notable acreages made up of 106,669 to 174,191 and a much larger size of 258,807 in 2007 and 172,360 in 2012. Within the same time, Coahoma, Leflore, Sunflower, Washington, and Yazoo all embarked on ambitious projects of insect control spanning through significant areas of land in the respective counties. Elsewhere, Coahoma’s land treatment with insecticides covered vast acreages measuring 142,784-111,911 and 189,841-172,663. Both Leflore and Sunflower all engaged in similar practices with large portions of land devoted to nutrient management as well. This involved over 90,000 to 142,000 plus in the first years followed by additional acreages (166,936-146,947 to 204,062 -176,073). Both Washington and Yazoo as mentioned were no exceptions in the treatment of vast acreages in the counties with insecticides. In the process, by 1997 -2002, these counties sprayed significant areas (133,716-101,218 and 156,908-147,816) to boost productivity. Within the ensuing periods, these practices picked up pace in 2007 -2012 (from 168,909 to 194,006, and 106,231 to 127,054 acres). The counties of Quitman and Tunica also put enormous portions of their land (estimated at 37,000 plus to over 89,000 coupled with over 82,000 to 120,000 acres and above) under insects control (Table 9). Table 9. Acres Treated to Control Insects or Insecticides
 |
| |
|
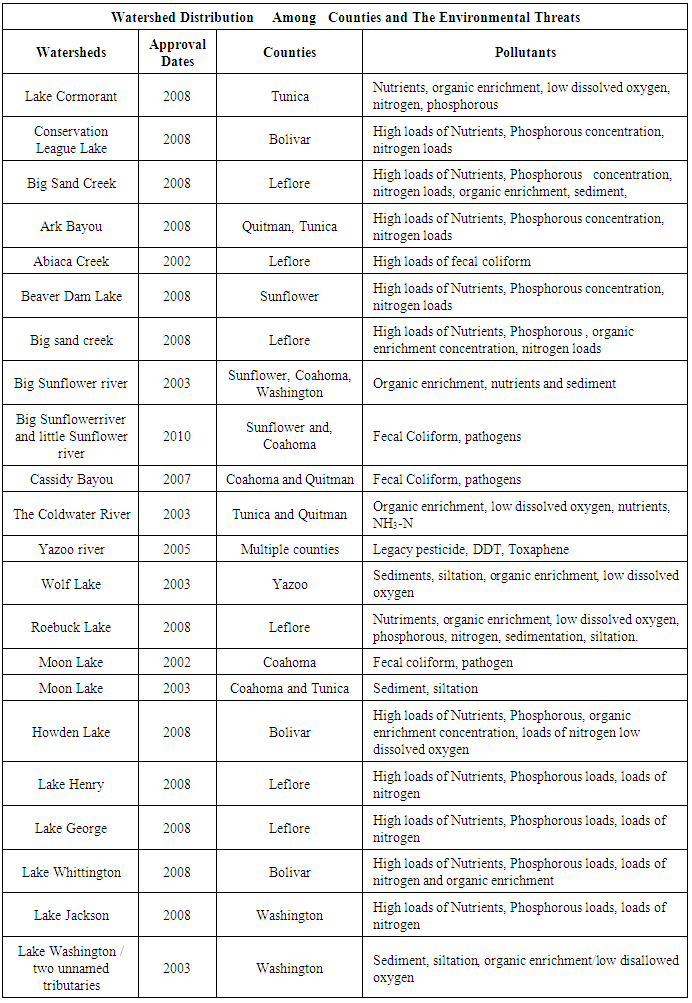
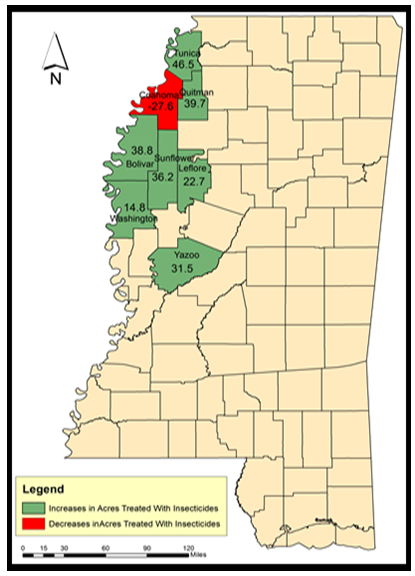
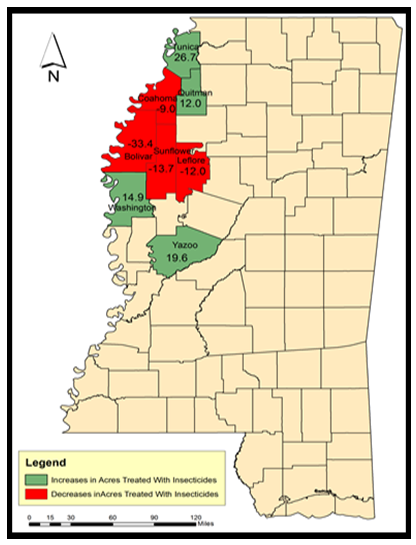
With fluctuating rates of plus 25% and -5.5% in insecticides treatment evident in the Delta region during the census years, the applications of insecticides grew by the high double digits in almost all counties with the exception of Coahoma which saw -27.6 declines in applications by 1997-2002. With the vast usage among the counties, the application rates for Bolivar, Quitman, Sunflower, and Yazoo not only exceeded the 31 percentage points but at Yazoo, the acreages devoted to insects control rose by 46.5%. This rate emerged as the highest level of increase in the entire region. Elsewhere Leflore and Washington counties all posted notable increases at the rates of 22.7 to 14.8% as well. In the 2007-2012 periods, the eight counties saw an even split of gains and declines in the percentage of acreages sprayed with insecticides. During those years, the biggest rates of increments (at 26.7, 19.6% -14.9 and 12%) held steady in the counties of Tunica, Yazoo, Washington and Quitman. All of the declines (-33.4, -9% -12, -13.7%) on the other hand occurred in the counties of Bolivar, Coahoma Leflore, and Sunflower. Given the fragility of the adjoining ecosystem, the continual use of nutrients in the region threatens the carrying capacity of the environment (Table 9). Furthermore, the lakes and rivers and watersheds along the counties in the region based on the table faced the threats of degradation from runoffs attributed to large scale farming in the agricultural fields of the Mississippi delta region. In the process, between 2002 through 2010, numerous watersheds in the area numbering 19 experienced notable quality declines. Accordingly, watershed impairment remained widespread in the region over the years. Considering the scale of degradation triggered by many stressors including pesticides contamination. Most of the non-point source loadings of nutrients and organic material in the water body environment continue to originate from the transport of pollutants into receiving waters by overload surface runoff and ground water infiltration (Table 10).Table 10. Mississippi Delta Watersheds under Pollution Threats
 |
| |
|
Given that the primary nutrients of concern consists of nitrogen and phosphorous, the former is characteristically a limiting nutrient in most rivers saturated by non-point source with the exception of agricultural watersheds. With the watersheds adjacent to cropland activities where intense farming remains fully subsidized. The carrying capacity of the environment is fraught with recurrent degradation which is manifested by fishing and river advisories banning usage due to widespread contamination in surface water environment of the Delta over the years. There is also the presence of pesticides, organic enrichment and ammonia toxicity in the streams. While some of these originate from farming and human activity, they point to an ecosystem under stress from the influence of change induced by subsidy. Knowing the frequency and amount applied, pesticide run off is a big issue in the Mississippi Delta region. In process, the streams and rivers were reduced to sinks for the by-products of farming activities which in turn threatens the ecosystem.
3.5. GIS Mapping and Spatial Analysis
This part of the paper presents the geographic dimension of subsidy trends and the environmental impacts in the study area. The map legends in green and red colors highlight the scale of inherent change in the areas in the form of gains and declines using GIS. Based on the figures, the spatial distribution points to a much heavier concentration of farm land losses (deceasing percentage points in farm land acreage) associated with subsidy disbursement all across the study area during the periods of 1997-2002. This was evident in the northwest counties of Tunica, Coahoma, Bolivar and Sunflower with pockets of visible gains in the south west areas of Washington and Yazoo and the northeast county of Quitman. In the 2007-2012 periods, a different trend emerges with areas that once experienced gains in the previous census showing signs of declines. With clusters of gains spread across two counties one in the north east (Tunica) and the other in Sunflower in the east central, comes a visible presence of declines in the south east, the south west and north west parts of the region where the disappearance of land was quite prominent (Figure 2.0-2.1).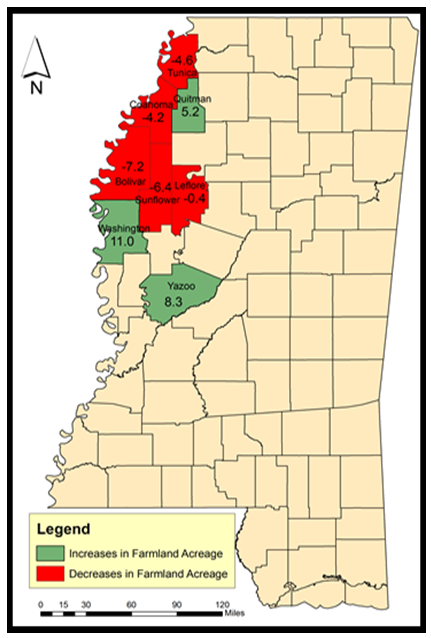 | Figure 2.0. Size of Farm Land 1997-2002 |
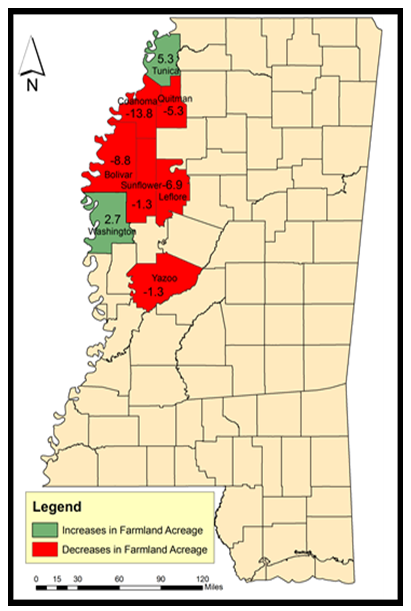 | Figure 2.1. Size of Farm Land 2007-2012 |
Regarding the spatial attributes of the number of farms in the region, there seemed to be an even split on the dispersion of farms as shown in the green and red colors in space during the 1997-2007 censuses. With much of the gains concentrated on the eastern edge and the south portion of the maps, the areas under declines were predominant in the western part. In other words, the distribution of the gains involves a gradual spread which began on the upper side of the north east along the border between Quitman, and Coahoma and continued further down onto Leflore and Yazoo in the south. Conversely, the counties under declines held firm with visible presence along the north most area of Tunica coupled with other counties in the western area of the Delta most notably Bolivia, Sunflower and Washington areas. In the 2007-2012 periods, the spatial patterns stayed slightly the same with the areas under gains and declines flipping (Tunica and Quitman) in opposite directions. All in all, the patterns of change pertaining to the farms in the region remained stable in both periods of 1997-2002 and -2007 -2012 (Figure 3.0-3.1).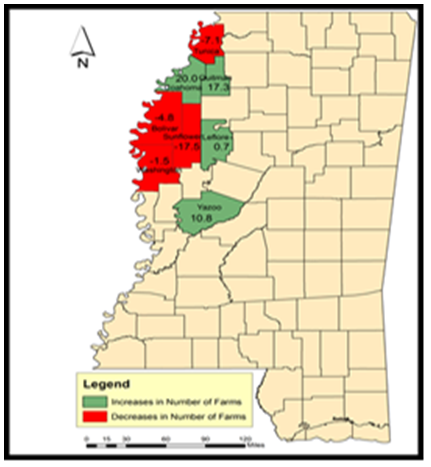 | Figure 3.0. Number of Farms 1997 - 2002 |
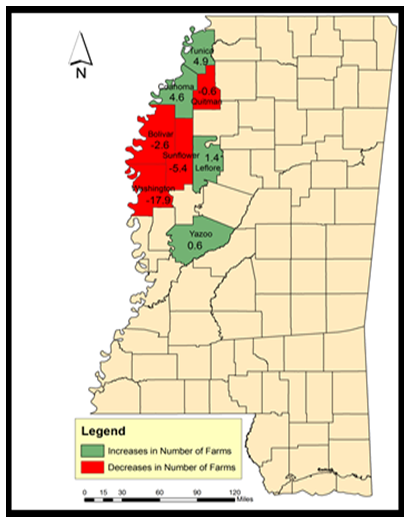 | Figure 3.1. Number of Farms 2007-2012 |
Just as the previous variables in different counties stayed in opposite locations of the Delta region, the geographic trends for irrigation land in the 1997-2002 period involves an evenly divided presence of gains and declines. The areas that saw losses as represented in red maintained a solid presence on the left hand side which is classified as the south west and the north west while counties with gains held firm in the north east and the south east parts of the region. However, between 2007 through 2012, there came broad increases in irrigated land acres with solid spread across all 8 counties of the study area. This is similar to the patterns that emerged under the market value of goods sold (Figure 4.0-4.1).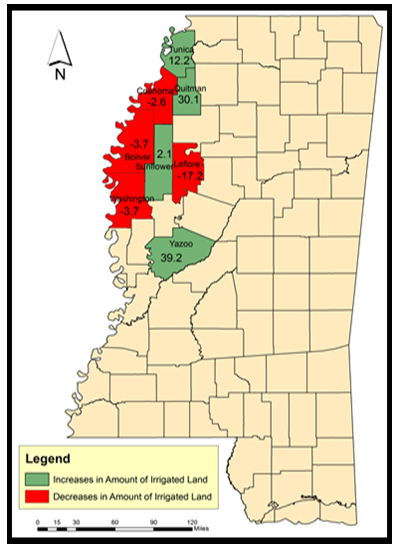 | Figure 4.0. Irrigated Land 1997-2002 |
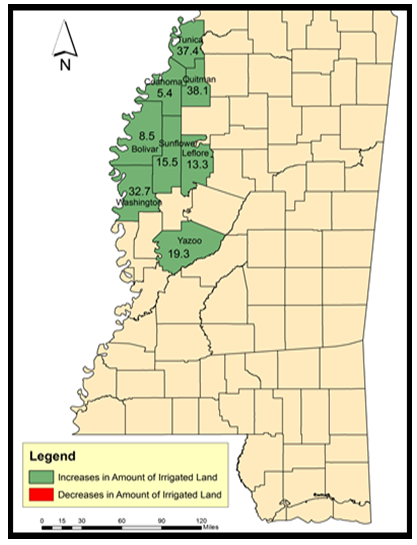 | Figure 4.1. Irrigated Land 2007-2012 |
The spatial distribution of land treated with fertilizer showed identical patterns during the two censuses of 1997-2002 and 2007-2012 with the two categories of gains and declines exhibiting prominence in all of the periods. The gains category for land treated with fertilizer maintained more presence in all areas of the study area during the 1997-2002 periods except in the Washington county area that experienced a decline. Similarly by the 2007-2012 census, note that all counties eventually showed heavy declines beginning from the upper north to lower counties in the south followed by a solo increase in Yazoo. The same thing can be said of farms sprayed with fertilizers which saw similar patterns of dispersion between 1997 through 2012.Additionally, insecticide use which resulted in notable increments among counties reached overwhelming levels in the first five years until a sudden emergence of pockets of declines in the northwest zone. Much of that increase occurred in Sunflower, Bolivar, Screven and Leflore in 2007 through 2012 (Figures 5.0-7.1). 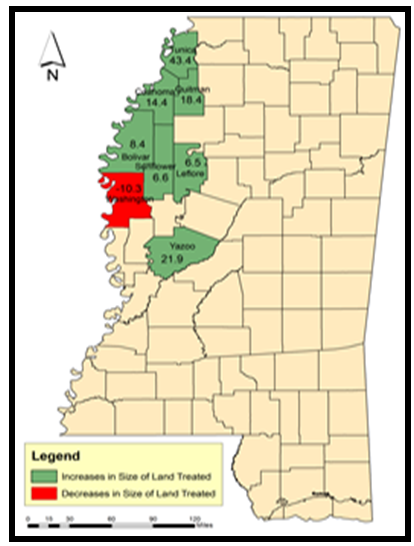 | Figure 5.0. Land Treated With Fertilizer 1997-2002 |
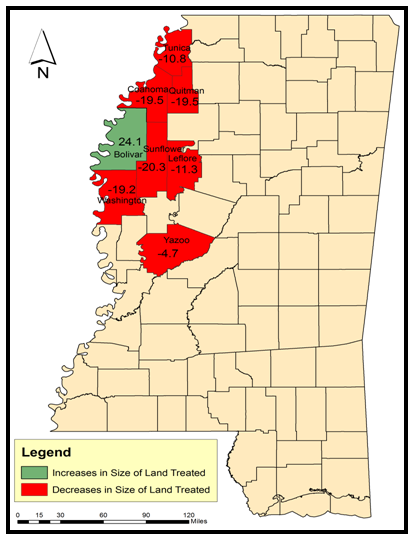 | Figure 5.1. Land Treated With Fertilizer 2007-2012 |
 | Figure 6.0. Farms Treated With Fertilizer 1997-2002 |
 | Figure 6.1. Farms Treated With Fertilizer 2007-2012 |
 | Figure 7.0. Land Treated With Insecticides 1997-2002 |
 | Figure 7.1. Land Treated With Insecticides 2007-2012 |
Regarding watershed pollution attributed to farm fields of the region, the 2003 map outlines 5 rivers and lakes (Watersheds: Big Sunflower River (2003), The Coldwater River, Wolf Lake, Moon Lake and Lake Washington) impacted by farming in the Delta region. In the 2003 period alone, note the presence of numerous pollutants in the five different watersheds along the central, upper and lower parts of the region. These pollutants which consists of organic enrichment, nutrients and sediment, low dissolved oxygen, NH3N, and siltation, threatens the surrounding ecology of the area. Further along the years in 2002-2010, the region also saw the growing presence of high loads of fecal coliform, and pathogens in half a dozen key watersheds (Abiaca Creek, Big Sunflower River, Cassidy Bayou, Yazoo River and Moon Lake). Other instances of vulnerability emerged in 2008 when about eight watersheds under various threats saw highest concentration of pollutants in areas adjacent to different counties in the region. While these pollutants included nutrients, organic enrichment, sediment loads, siltation, phosphorous concentration and loads of nitrogen. The impacted lakes ranged from Cormorant, Conservation League, Big Sand Creek, Ark Bayou, Beaver Dam, Roebuck, Howden, Henry and Lake Whittington (Figures 8.0-8.2).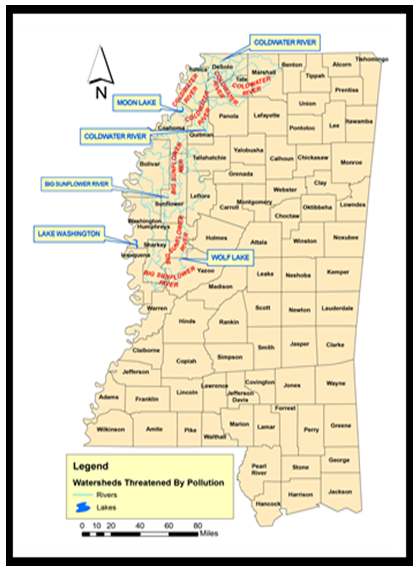 | Figure 8.0. Watershed Degradation 2003 |
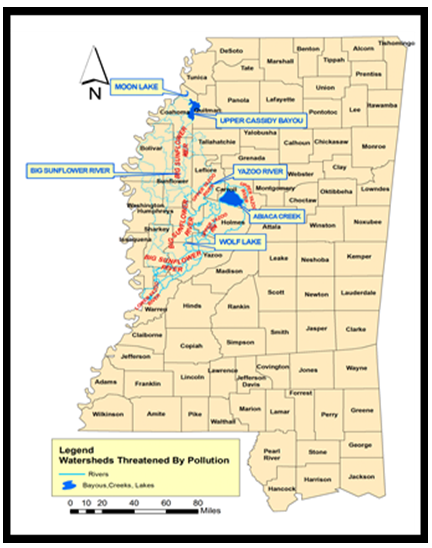 | Figure 8.1. Watershed Degradation 2002-2010 |
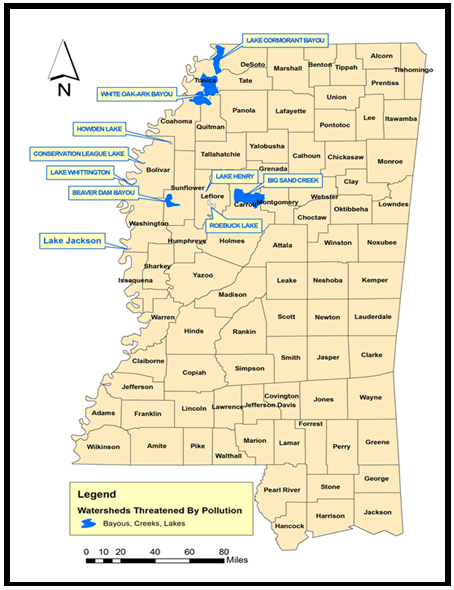 | Figure 8.2. Watershed Degradation 2008 |
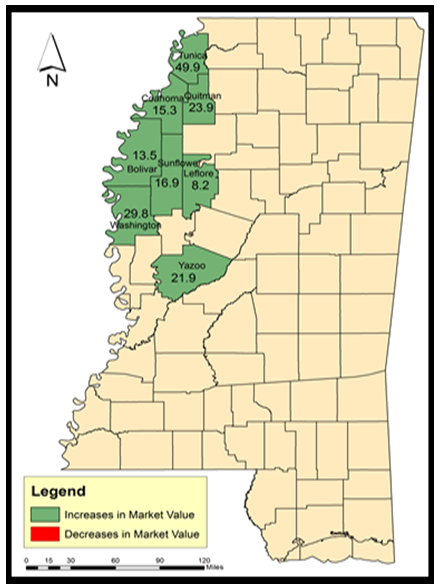
The spatial evolution of the economic elements under analysis was quite revealing as well. Aside from notable declines in 2 counties of Coahoma and Sunflower in the middle of the Delta, loan beneficiaries such as farmers who saw increases in the disbursement of loans were visibly represented along the upper north areas of Tunica and Quitman coupled with the south eastern counties of Leflore and Yazoo. Further along the western portion of the region, note the gradual spread of gains into Washington and Bolivar. Notwithstanding its significance among economic factors, commodity loan disbursement for farming not only plummeted in space, but it faded rapidly among the counties in the Delta all through 2007 to 2012. Government transfer payment on other hand not only displayed a balanced spatial pattern in the census, but the categories of gains and declines along the counties stood firm with the gains concentrated on the north east and southeast areas representing the upper and lower parts of the map. Pockets of declines in the area remained solidly present mostly on the central edge along the North West all through 1997-2002 and 2007 to 2012. Above in all, the geographic spread of this economic element seemed somewhat stable in space among the counties compared to the others in the region (Figures 9.0-10.1). 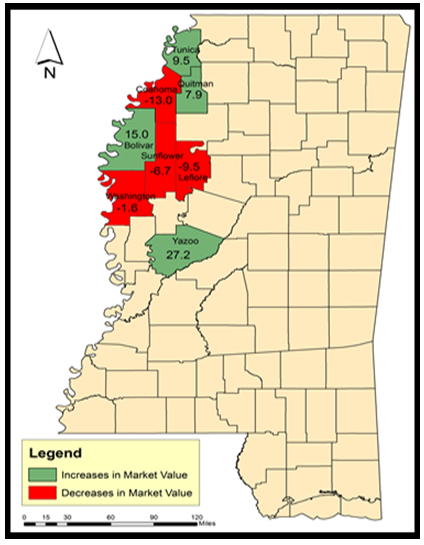 | Figure 9.0. Market value 1997-2002 |
 | Figure 9.1. Market value 2002-2007 |
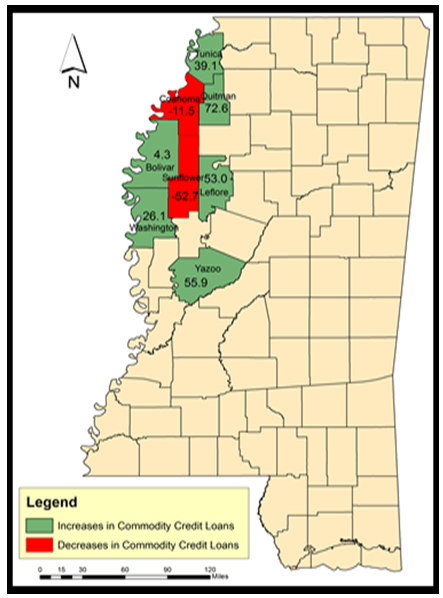 | Figure 10.0. Commodity Loan 1997-2002 |
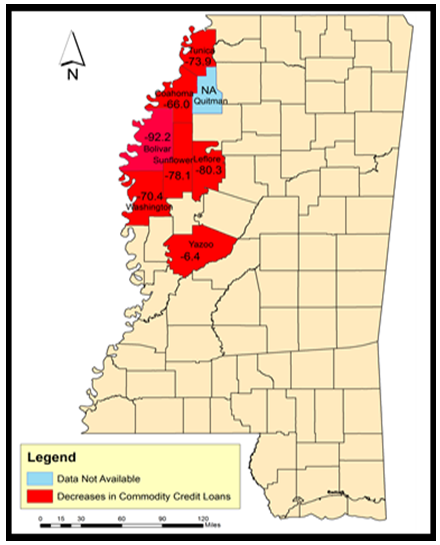 | Figure 10.1. Commodity Loan 2002--2012 |
Another twist to the analysis touches on the geographic patterns of subsidy beneficiaries under the major crops (soybean, corn, rice, cotton, wheat). Added to that are the distributions and spread of both assistances for natural disaster exposure and conservation initiatives. Taking a cue from the GIS mappings, note that the counties of Bolivar and Sunflower on the north east accounted for the highest concentration of recipients of soya bean subsidy between 1995-2012. With time, recipients in the under medium level (those numbering 573-694 and 420-472) appeared more in the north eastern, northwestern and south western portion of the area most notably Quitman and Leflore, and Washington counties. This was followed by a spread of the lowest concentration of soybean subsidies recipients (at 421-273) in Yazoo and Tunica respectively (Figure 12.0). With no or zero recipients in corn subsidies in the counties along the far north and North West zones of the Delta region between 1995 through 2014. The south east county of Yazoo represented in blue along the lower edge of the study area eventually emerged with far bigger beneficiaries numbering 734 within that time. Such magnitude of subsidy recipients surpassed those of the eastern counties of Quitman and Leflore who finished with 508-456 beneficiaries of corn subsidies among famers (Figure 12.1).  | Figure 11.0. Government Transfers 1992-1997 |
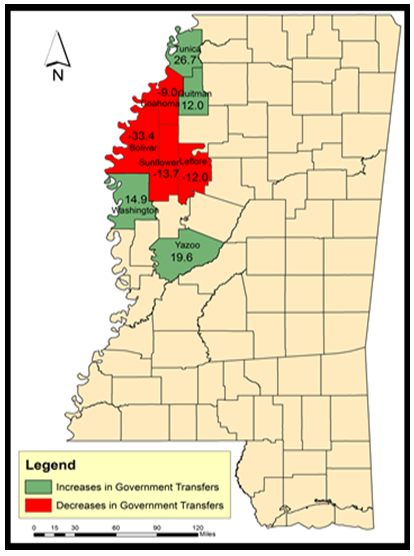 | Figure 11.1. Government Transfers 2002-2007 |
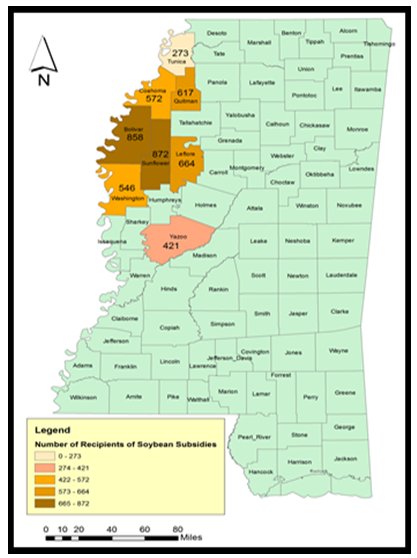 | Figure 12.0. Soybean Subsidies |
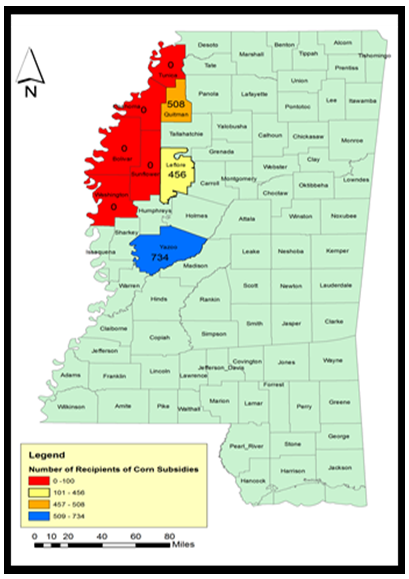 | Figure 12.1. Corn Subsidies |
Just as Bolivar and Sunflower in the North West portion of the Delta showed clear dominance with 709-680 recipients in thick blue. Note a cluster of other counties with over 300 beneficiaries of rice payments in the medium category led by Coahoma and Quitman along the north east. In that light, there is a clear difference when compared to Leflore and Washington (in the south east and south west) with 299 recipients during the same period (Figure 13.0). Elsewhere, the maps show a completely different pattern in which wheat subsidies appeared solely in the upper south west counties of Tunica, Coahoma, and Bolivar. The spatial distribution showed Bolivar with 923-609 followed by Tunica in the north most area with 262 beneficiaries in wheat subsidy (Figure 13.1). Cotton subsidy on the other hand seems evenly distributed with two counties represented in red (sunflower in the central area and Yazoo in the south east) having over a thousand recipients. Other counties such as Bolivar and Leflore with identical numbers of 791-750 in the opposite geographical zones of north west and south east were slightly adjacent to Coahoma and Quitman in the north east and north west. Nearby to them in the same area along the upper north came Tunica with somewhat lower number of recipients estimated at 249 (Figure 14.0). In terms of environmental programing, conservation subsidies showed more presence in the east and south east areas of Yazoo and Leflore followed by Quitman with non in the upper north and North West (Figure 14.1). Aside from the largest level of disaster recipients evident in Bolivar in the northern part of the map, note the gradual spread of disaster assistance in almost all counties in various categories with the exception of Leflore in the east which had no iota of beneficiaries in terms of disaster payments (Figure 15.0).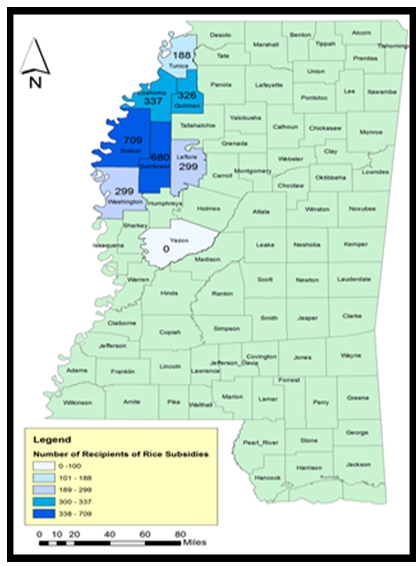 | Figure 13.0. Rice Subsidies |
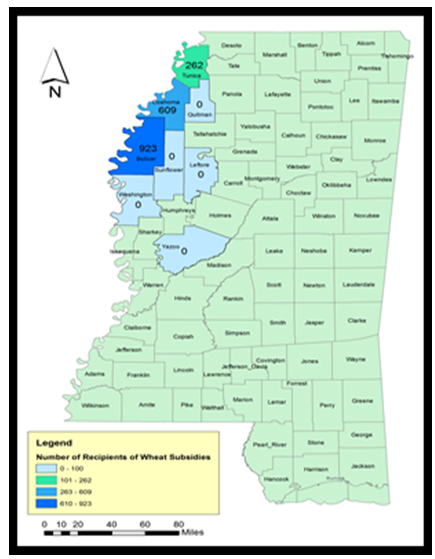 | Figure 13.1. Wheat Subsidies |
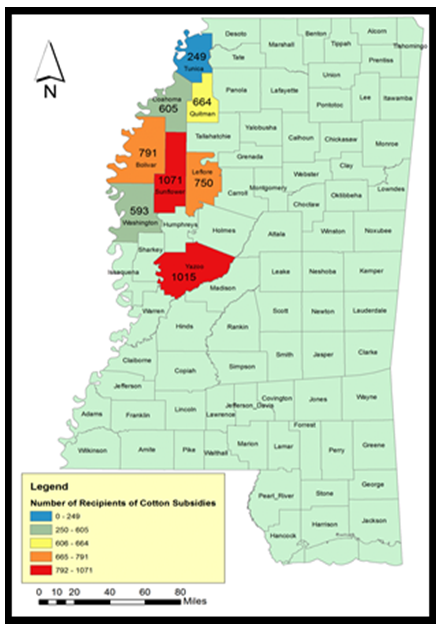 | Figure 14.0. Cotton Subsidies |
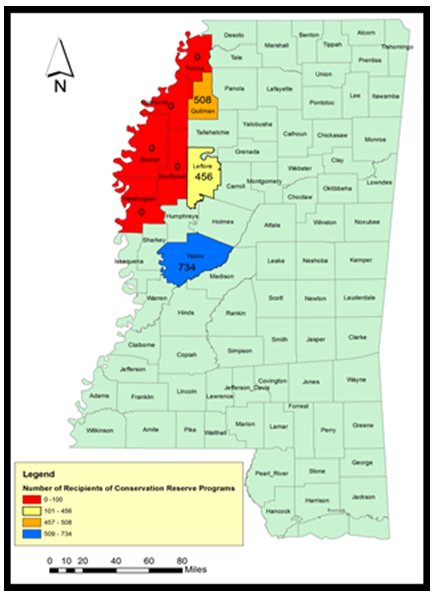 | Figure 14.1. Conservation Reserve Subsidies |
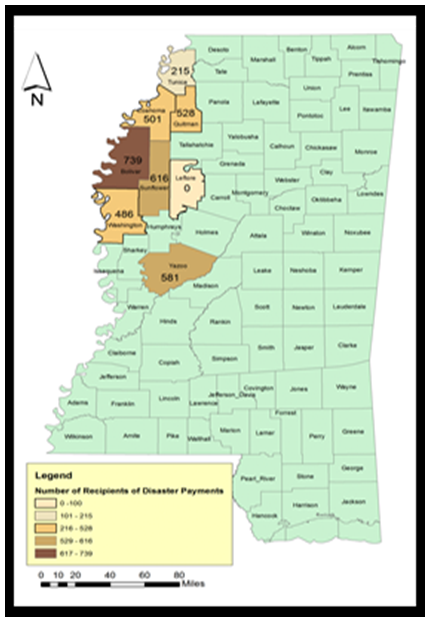 | Figure 15.0. Disaster Payment Subsidies |
3.6. The Factors Fuelling Subsidy in the Region
The factors fuelling the impacts are not farfetched; they consist of socio-economic elements of commodity credit corporation loans, government transfer payments and the market value of land and buildings in the farm sector of the Mississippi Delta region. The others include the availability of land use, biophysical and natural variables as well as incentives from the use of fertilizers amongst the beneficiaries. Each of these factors is described herein with a detailed overview in the following paragraphs.
3.6.1. Socio-economic Elements
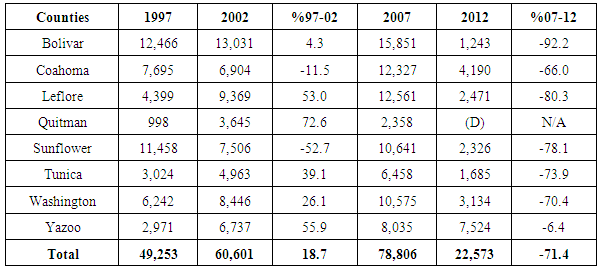
The average overall loans for the entire region went from $49,253-60,601 in the first half of the census to $78,806-22,573 in the latter years. Bolivar as usual dominated with higher transactions valued at $12,466, 13,031 to $15,851 in the first three censuses only to slide by 1,243 in 2012. In the other areas of the Delta, Coahoma, Leflore, Sunflower and Washington all benefited from the loan packages by taking vital sums of money. The loan amounts ranged from $7,695-6,904 and 12,327 to 4,190 for Coahoma while farmers in Leflore appropriated between 4,399 to $9,369 in the first census periods of 1997-2002 and continued with 12,561 to 2,471 by 2007 through 2012. Sunflower followed up at similar levels with $11,458 to 7,506 in loans and by 2007, the amount went up to $10,641 until a gradual skid to $2,326 in the following years. The farmers in Washington County also drew from county commodity loans involving sizable amounts (of 6,242 to 8,446 and 10,575 to 3,134) to sustain their trade. As a measure of the economic elements, loans to the farmers in Tunica consist of 3,024 - 4,963 and 6,458 to 1,685 in 2012. In the Yazoo area, loan transactions involved the initial sums of 2,971-6,737 which jumped to 8,035 and 7,524 in the periods of 2007 through 2012 while Quitman only took in 998 to 3,645 and 2,358 in the same periods (Table 11). Table 11. Commodity Credit Corporation Loans
 |
| |
|
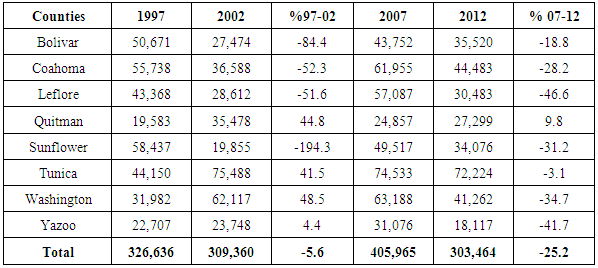
With its significance in the farm business, commodity loans stayed on the rise in the region at a growth rate of 18.7% in 1997-2002 until it dropped significantly by -71.4% in the periods of 2007 through 2012. At the county level in which 2 of 8 counties (Coahoma and Sunflower) saw declines of -11.5%--52.7% in commodity loans in the first census, heavy gains (53-72.6%, 39.1-,26.1, 55.9-4.3) in percentage points were notably evident in 6 counties(Leflore, Quitman, Tunica, Washington, Yazoo and bolivar). However in the 2007 -2012 period, the disbursement of loans fell significantly in all counties of the region at an alarming rate in an unprecedented manner ranging from -66 % to -92% percentage points (Table 11). The distribution of government transfer payments average per farm followed a similar path. In the entire region, a total of $326,636 to $309,360 in payments were disbursed in 1992-2002 and by 2007-2012, the numbers went from $405,965 to $303,464. From the data, the core of the money beginning with $44,150 in 1997 and the $72,000 plus in transfer payments during the three censuses went to Tunica County. The other group of areas such as Bolivar, Coahoma, Sunflower and Leflore and Washington County also profited immensely from government farm assistance. The amount of payments for Bolivar and Coahoma stood at over $50,000 in 1997, by 2002 it went from 27,474-36,588. In the 2007 through 2012 period, both counties received vast sums as well. This represented about 43,752-35,520 and 61,955 to 44,483 in the 2007 to 2012 census periods. Just as the other areas, Leflore and Sunflower also cashed in on the government assisted programs worth 43,368 to 58,437 and 28,612 to 19,855. The trend continued in 2007 through 2102 period with 57,087-49,517 and over $30,000. Washington on the other hand took in over $60,000 per farm in the mid censuses of 2002 through 2007 while the amounts for 1997 and 2012 stood at $31,982 to 41,262 respectively. During these periods, Quitman and Yazoo all saw the inflow of government cash worth tens of thousands. With the region as a whole having gone through notable or back to back declines of -5.6% to -25.2%, in the allocation of federal assistance, 4 of 8 counties finished on the minus side. Among them, Sunflower outpaced other counties with the largest declines in funding at a rate of 194.3% while 3 others (Bolivar, Coahoma, and Leflore) saw decreases of -84.4 to over -51.6%. The gains of 41% and over occurred in the Quitman, Tunica and Washington areas while Yazoo stood firm with 4.4% increases in government assistance. In 2007-2012, 7 of 8 counties showed declines of mostly double digits rates while one county posted the only gain of 9.8% (Table 12). Table 12. Government Transfer Payments Average Per Farm
 |
| |
|
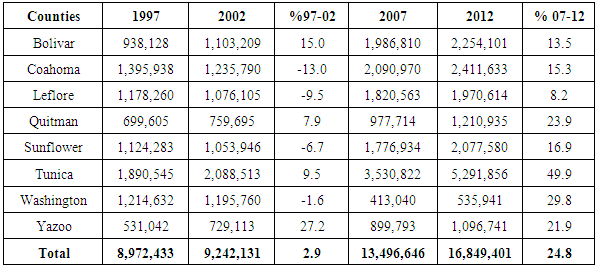
The total estimated market value of land and buildings as a major collateral in the farming business which soared in the region much of the time were represented by huge sums of dollar values in the neighbourhood of 8,972,433 to 9,24,131 followed by 13,496,646 to 16,849,401 during the censuses. The Tunica area emerged with biggest estimated values (of 1,890,545 -2,088,513 to 3,530,822 -5,291,856) of land and buildings. With their big market values, Bolivar, Coahoma, Leflore and Sunflower were all represented as counties sitting on large immobile assets estimated in millions. Other counties such as Washington, Yazoo and Quitman have relatively appreciable values of land in buildings over the years. The percentage of change showed the study area with increases of 2.9% to 24.8% in all 4 censuses, followed by even gains and declines among counties in 1997-2002 and outright increases in 2007-2012. An important observation in the 1997-2002 period is the double digit gains of 15.0%-27.2% for Bolivar and Yazoo counties during which Coahoma accounted for the highest declines of -13.0%. That is different from the 2007-2012 periods when Leflore posted the lowest gains of 8.2%. This pales in comparison to the high double digit increases of 49.9%, the over 21-29 percentage increases for Tunica, Yazoo, Washington, and Quitman while Bolivar and Coahoma all saw increases of 13.5% to 15.3% during the same time (Table 13). This once again reaffirms the growing role of several socio-economic elements located within the larger agricultural structure of the Delta among the driving forces behind subsidy requests.Table 13. Estimated Market Value of Land and Buildings
 |
| |
|
3.6.2. The Availability of Land Use Elements Boosting Farming
The physical characteristic of the study area has for decades made it a major player in farming and different commodities that are in demand in national, regional, and global markets. Being one of the most heavily farmed areas in the country where tradable farm commodities such as cotton, corn, soya bean and wheat are cultivated yearly on available farmlands. There are notable land use activities where these afore mentioned commodities and others are sustained to keep up with demand. Knowing that such activities attract government funds, land owners who rip the benefits did so consistently given the availability of land base. They would not have done anything to undermine that source of income, hence their continual enrolment of more acreages and the cultivation of subsidy crops. Considering the amount of subsidy money that was distributed around among farmers and the fact that agriculture accounts for 1 out of 4 jobs in the state, then it is not a surprise that much of the core land use elements made up of agricultural land area, irrigated land area and the number of farms in absolute terms seemed somewhat stable aside from the opening years. Aside from some fluctuations, from 1997 to 2012, available land use indicators as measures of subsidy approvals stood firm. Accordingly, it was no coincidence that the major farm counties who received heavy subsidies than the others were actually the ones with larger acreages and active operations in the production of the major crops. Knowing fully well that the allotment of subsides depend on enrolled size of land. Had the farmers in the Delta not met such criteria in the absence of fertile terrains conducive for cultivation, they could not have attracted continued assistance. Additionally, the success of farming and historic land use settlement patterns in the region coupled with other physical attributes were predicated on sustainable land use and proximity to the Mississippi River. This has continued with access to irrigation with benefits during drought without heavy losses and drastic erosion of land base which in turn attracts subsidies.
3.6.3. Biophysical and Natural Elements/Incentives from the Use of Fertilizers
Favourable biophysical and natural elements such as good soil, topography, soil nutrients, availability of water and suitable climatic patterns are indispensible in the cultivation of subsidy crops prevalent in the region. In their absence farmers face daunting task beyond their own control. This sometimes requires necessary support to boost mitigation measures including drainage, irrigation, protection of farm crops and conservation, treatment of farm and available land with fertilizers and agrochemicals. Depending on the scale and gravity of the limiting factors, if one is dealing with natural disaster such as inclement weather patterns, most farmers who require assistance based on stipulated criteria in these settings qualify for government assistance to boost productivity. When such limitations are not dealt with given the global and regional effects, it results in the loss of crop yield and economic downturn at the expense of local farmers’ ability to compete in the market place and sometimes price hikes in food items that are passed on to consumers.As a result, farming activities in the Delta, just like other areas rely heavily on its soil capability potentials to meet yield targets which sometimes hinges on expanding the land base in a subsidy laden environment. Here, land classification under different categories of soil delineates the spots suitable for cultivation and expansion of the land base in lieu of the assistance that comes with acreage enrolment. In situations where the available land fall under the prime classes of soil, the next action would be to turn to precision farming techniques to assess any limitations to crop yield potentials. Should that be the case, available cropland would be targeted for nutrient management requiring fertilizers, pest control measures, and agro-chemicals. Throughout the census years of 1997-2012, in the Mississippi Delta region, the use of agricultural chemicals on land and pesticides applications, and the number of farms treated grew substantially in various areas. With the amount money, state aid and trade deals that are in place for farming in the region. Subsidy allotment continues to be sustained with the latest advances in farm technology, soil chemistry and physics. In the Delta, farmers now have the capability to extend acreages into areas that were previously non cultivable. This increases acreage enrolment which in turn translates into more aid. In so doing, major incentives go to farmers who stretch into uncultivable areas by increasing their land base. The same thing also goes for those farmers hit by natural disasters and those undertaking conservation measures. These circumstances attract state aid, hence the growing dependence on farm subsidy in the Delta region over the years and the resultant impacts.
4. Discussion
This paper adopted a GIS based method and primary data to analyse subsidy use in selected counties of the Mississippi Delta. The focus covered the issues, trends, factors, mitigation efforts and future line of actions. All in all, subsidy trends in the Delta not only involved the payout of $3.2 billion to sustain many programs from commodities to crop insurance, but 21,958 farmers took in $2.9 billion in funds under various programs (rice, cotton, soya beans, corn, disasters and conservation reserve) from 1995-2012. With the scale of allotments earmarked for the counties, it is clear that the farmers are major recipients of farm aid. This not only implies that the region is heavily dependent on subsidies, but the core crops benefiting from state assisted programs just as in other states seemed fully entrenched in the Delta region. Given the prominence of cotton subsidy, 3 counties (Bolivar, Sunflower, and Washington) emerged as the top recipients [1]. Such concentration of government aid in only three counties than the rest of the area raises the profile of these places with mixed blessings. It comes in a setting in which farm aid disbursement as a policy instrument solely directed at some could be used by elected officials and those making funds available to wield unnecessary influence on the recipients. It also creates a dichotomy between big and small farms in the allotment of farm aid which is often skewed in favour of big corporate farms who often corner most subsides at the expense of small family farms or those operated by ethnic minorities such as African Americans and Latinos. Such stratifications raise ethical questions as to the seemingly discriminatory practices and unequal distribution experienced by Black farmers in Mississippi Delta even when they have the numerical majority in some of the towns, but only to be schemed out on the grounds that they do not have enough land to qualify for aid. The institutionalized stratification of farm operations and over concentration of subsidy crops in the hands of a few wealthy farms in some counties in that way amounts to denial of equal access to opportunities to compete for farmers at the margin. Not attracting large subsidies and bigger acreages in that setting works against minority farmers in securing enough bank loans to survive in a system already set up against them. Because the system favours subsidy towards major crops, there is always the obsession with over stretching existing farmland and areas not currently conducive for agriculture beyond their carrying capacity in the quest for more acreages. This leaves the region with the burden of unintended ecological liabilities which comes with converting previously un-farmable areas to active farm operations. While the dangers involve extensive use of chemicals and the threats to adjoining ecosystems, those not reaping the full benefits of subsidies may be tempted to sell their farm land which at times translates into eventual drops in the overall size of farm land. With subsidy and the actual farm operations somewhat dictated by forces located within the global market place, it does affect the stability of smaller and minority operated farms. These operations lack the capacity to absorb the spill overs and distortions from the economy of scale of big subsidy farms when it comes to land retention. Accordingly, these programs resulted in drops of 2,533,959-2,430,755 in land acreage at a rate of -4.1% in the entire area in 2007-2012 despite a slight gain of 0.2% in 1997-2002 [2]. GIS analysis also points to changes in farmland use [Figs 2.0-2.1]; and other factors coupled with widespread diffusion of agrochemical use in the counties. With increases (of 12.3-25 to 2.5%) in fertilizer and insecticide use [2], watersheds in the area showed heavy traces of nutrient loads, phosphorus, nitrogen and sediments from farm operations with risks to the surrounding ecology [3]. All in all, the Delta ecosystem remains prone to subsidy impacts. Being a heavily farmed region, land use elements of farms and farmland saw visible changes in the form of gains and declines. This involved farm land change from 2,533,959, 2,430,755 at -4.1% in 2007-2012. In the counties, farm land declines stayed on the rise by 1997 through 2012. Aside from some drops, in 1997-2003, chemical and fertilizer and insecticide treatment of land and farms continued given the lust for incentives and the need to put more land under farm operation. With that, fertilizers and insecticide use on farms grew 12.3%-25% in 1997-2002, while commodity credit loan and federal transfer payments fluctuated.From 2003 to 2010, 19 rivers in 8 counties experienced impairments triggered by runoff from nutrients loads, phosphorus, nitrogen and sediments from farm sources. In light of that, the results show widespread dependence on subsidies and growing impacts in the form of environmental quality declines, changes in land areas and land use elements coupled with the spatial dispersion of the impacts and trends across counties and adjoining watersheds. While the impacts stem from socio-economic and physical elements, several efforts to address the issue did not eradicate them fully. For that, the paper offered some suggestions including farm subsidy policy reform, the establishment of educational and awareness programs on the effects of farm aid, the need for environmental considerations, regular monitoring of natural areas adjacent to heavily subsidized farms, the elimination of both fiscal and market distortions often skewed in favour of big farms and regular use of geo-based analysis.
5. Conclusions
This study focused on an analysis of farm subsidy impacts in the Mississippi Delta with significant results: a) The Delta is heavily dependent on farm subsidy with uneven concentration of recipients; b) mix scale methods unveiled the trends; c) the ecosystem remains highly vulnerable; d) the core subsidy crops were quite strong in the area; e) the impacts are linked to many elements. By and large, the effects on the Delta ecosystem are quite obvious. Aside from the ecological fallout, the study area has in the last several years accepted sizable farm aid. Between 1995 through 2012, the Delta received over $3 billion at an annual average of $400 million. Using such dollar amount to support commodity, crop insurance as well as environmental programming, Bolívar County outpaced the rest of the area. With farm aid in the Delta fraught with unequal allocation of dollars to a few areas to the detriment of others, uneven concentration in some areas amounts to over exposure to large sums of dollars in just three counties. This has the tendency to stratify subsidy distribution solely on the basis of the core crops and size of farm in a manner that excludes counties lacking capital. Seeing the way minority farms are schemed out under these guises. It is clear that such an approach raises concerns about the ethics of unequal of farm aid in the hands of large farms. While none of the previous work on the study area ventured into this area, the effort here is an upgrade to the literature. This means that the very essence of subsidy which is a legitimate aid to the needy risks being turned into an accessory to inequality and degradation. This breeds internal social contradictions like poverty and marginalization with questions as to whether state aids are used the way they were initially intended. In stressing such defect, regulators can focus on structural inequity and the ethics of over concentration of farm aid and externalities in just a few counties. Using descriptive statistics and GIS components of the model as operational tools added more insights to the assessment of ecological costs of farm subsidy. The model was quite effective in identifying the trends, factors and ecosystem change. With its use in impact assessment in the Delta, GIS showed some promise in displaying the scale of health risks and the pace of their diffusion. Identifying these risks helps prioritize planning in areas where unequal allotment and degradation are recurrent. In that regard, the enquiry added an environmental safeguard dimension. This is critical in detecting hazards in an ecosystem, already over stretched by stressors from subsidized farming. Keeping citizens informed as done here lessens the danger to their wellbeing. Economic and physical elements shaping subsidy in this study can influence current debate with new ideas. The study not only reiterated the importance of these factors in the region’s farm operation, but it indicated how marine ecosystem can be impacted by these elements. Highlighting these linkages given the omission in the literature, did inject a chief concern into the front pole of planning and research agenda on how to reform subsidy. Without such focus, nothing would have uncovered the scale at which subsidy impacts the ecology. Keeping it on the forefront helps illumine how regions can respond to ecological costs of subsidy. In spite of a few gaps in knowledge pertaining to data infrastructure, this study has major upsides. To begin with, being written on the verge of a political season where farm subsidy is on the debate confers this study some significance and a sought after status in the months ahead. With debates between supporters and critics of farm subsidy taking centre stage in public discourse, many will look up to this research for direction and knowledge. The research is therefore timely considering its concerns for equity, marginalization of minority farms, enrichment of big farms, ecological liabilities and public awareness of the links of obesity to farm subsidy. Part of the challenge encountered stems from gaps in the current mode of data collection. For sure, primary data choices were limited given the intent of the original government sources to choose the scales and indicators which we do not control. However, the most critical data on subsidy which public agencies would not want to provide only came from an NGO like EWG. Whether that was intended to avoid aggregation of essential data across ethnic, racial, gender and class lines for fear of backlash over inherent disparities. It does handicap efforts to optimize common knowledge. As a result, there was little opportunity to explore the plights of communities at the margin often at the receiving end of unequal distribution of subsidy dollars and the externalities. With the rising presence of female farmers and the global stature of Mississippi agriculture, it would have been valuable to see data showing gender aspects of subsidy impacts and the environmental health perspective while establishing a link between subsidy in the Delta and regions in the global south. The other major significance revolves around the originality of this study in being the first of its kind on the study area. Its potential as a decision support tool to guide regulators not only serves as a major contribution, but injecting a social justice theme of equity and race did raise the ethical profile of this research. Taking a cue from observations made herein, future studies should focus on the issue of gender and environmental health, global south experience, minority farms, race, equity and social justice, ethics, more use of GIS and the design of a subsidy index and accessible public data infrastructure on subsidy impacts. Consequently, decision makers and scholars will seek urgent responses to the relevant questions raised in this enquiry. The questions are: which form will future concentration of subsidy assume? How will gender and equity issues be manifested? What critical indices will be needed to gauge subsidy? How do we measure hidden distortions in farm aid? How do we green subsidy practices? Will public data agencies adapt to changing needs? In these questions, there is opportunity to refocus subsidy approaches in a sustainable manner cantered on fairness and ecosystem health.
References
| [1] | Merem, E C. (2015). Assessing the Environmental Impacts of Farm Subsidy In the Mississippi Delta Using GIS. Proceedings of the 25th Annual AEHS Conference, San Diego, California: March 2015. |
| [2] | Burnnett, S. (2007 January). Protecting the Environment Through the Ownership Society – Part One. NCPA Policy Report No. 282. Dallas, TX: National Center for Policy Analysis. pp1-33. |
| [3] | Summer, D. (2014). Agricultural Subsidy Programs. The Concise Encyclopedia. Library of Economics and Liberty. Retrieved on 18th November 2014. Fromhttp:www.econlib.org/library/Enc/AgriculturalSubsidyProgram.html. |
| [4] | Ifft, J. (2012 November). Potential Farm-Level Effects of Eliminating Direct Payments. Washington, D.C: USDA. United Sates Department of Agriculture (USDA), Economic Information. Bulletin: 103. |
| [5] | .La Vina, A. (2007 June). Agricultural Subsidies, Poverty and The Environment: Supporting a Domestic Reform Agenda In Developing Countries. Washington, D.C: WRI Policy Note, Trade: Agricultural Subsidies 1:.1-6. |
| [6] | Babcock, B. (2001 Fall). The Concentration of US Agricultural Subsidies. Iowa Ag Review. 1:7:1-3. |
| [7] | Edwards, C. (2009 June). Downsizing the Federal Government Agricultural Subsidies. CATO Institute. DC Washington. |
| [8] | Environmental Working Group (EWG). (2014). Farm Subsidies, 2012 Farm Subsidy Data Base: Mississippi Summary Information. Washington, D.C: EWG. |
| [9] | Mississippi Department of Environmental Quality (MDEQ). (1999-2014): State of Mississippi Water Quality Assessment: 2014 Section 305 (b). Jackson, Mississippi: Mississippi Office of Pollution Control. |
| [10] | United States Department of Agriculture (USDA). (2015). Various Years Census Data: County Highlights. Washington, D.C: USDA NASS. |
| [11] | The Editors. (May 2012) For Healthy Country, Overhaul Farm Subsidies. Scientific American. 306:5:1-2. |
| [12] | Physicians Committee for Responsible Medicine. (2014). Agriculture and Health Policies In Conflict. Washington, DC: Physicians Committee. |
| [13] | Wallinga, D. (2010) Agricultural Policy and Childhood Obesity: a Food Systems and Public Health Commentary. Health Affairs. 29: 405-410. |
| [14] | Franck, C. (2013). Agricultural Subsidies and the American Obesity Epidemic. American Journal of Preventive Medicine. 45:3:327-333. |
| [15] | Fields, S. (2004 October). The Fat of the Land. Do Agricultural Subsidies Foster Poor Health. Environmental Health Perspectives. 112: 14:A820- A823. |
| [16] | Fredrick, K. (1999 March). Impacts of Federal Policies and Programs On Wetlands. Washington, D.C: Resources For The Future, Discussion Paper 99-26:1-47. |
| [17] | Ostria, M. (2013 August). How US Agricultural Subsides Harm and The Environment, Taxpayers and The Poor. Washington, D.C: National Center For Policy Analysis. 126:1-4. |
| [18] | Cook, C (2014). The Spraying of America. Earth Island Journal .1-5. |
| [19] | Frisvold, G. (2004). How Federal Programs Affect Water Use, Quality and Allocation Among Sectors. Water Resources Research. 40; 1-15. |
| [20] | Stubbs, M. (2012 April). Conservation Compliance and US Farm Policy. Washington, D..C: Congressional Research Service, 7-5700: 1-18. |
| [21] | ]. Riedel, B. (2007June). How Farm Subsidies Harm Taxpayers, Consumers, and Farmers Too. Retrieved 22nd December 2014 Fromhttp://www.heritage.org.reserach/reports/2007,how-farm-subsidies-harm-taxpayers-consumers.and.farmers-. |
| [22] | Hosemann, J. (2014) Agriculture and Environment. The Mixed Legacy of Federal Intervention. Retrieved 20th November 2014 From http://perc.org/articles/agriculture.and environment. |
| [23] | Wichelns, D. (2010). Agricultural Water Pricing: United States. Hannover College, Indiana: OECD, 4-27. |
| [24] | Altieri, M. (2014). The Ecological Impacts of Transgenic Crops On Agro-ecosystem Health. Retrieved 20th November 2014 From Http://nature.berkely.edu–miguel.alt/the ecological impacts.html Agro-ecology In Action. |
| [25] | Merem, E.C. (2014 June). Analyzing Water Issues In The State of Mississippi. British Journal of Applied Science & Technology 4: 2: 3179-3216. |
| [26] | Merem, E.C. (2014). Analyzing the Changing Agricultural Landscape of Northern Louisiana. Journal of Scientific Research and Reports 3: 20: 2638-2664. |
| [27] | Merem, E.C. (2014 April). The Analysis of Coal Mining Impact On West Virginia’s Environment .British Journal of Applied Science and Technology. 4:8:1171-1197. |
| [28] | Merem. E.C., & Twumasi, Y.A (2012). Using GIS To Assess the Contributions of Farming Activities to Climate Change In The State of Mississippi. The British Journal of Environment and Climate Change. 2: 2. 1-15. |
| [29] | Merem, E.C. (2012 September). Using Geospatial Information Systems in Assessing Water Quality In The Mid-Atlantic Region Agricultural Watershed of Maryland. The International Journal of Ecosystem. 2:5: 112-139. |
| [30] | United States Bureau of Census. (2013). Census Quick Facts. Washington, D.C: US Bureau of Census. |

 Abstract
 Reference
 Full-Text PDF
 Full-text HTML