Renata Horvat1, Melissa Watanabe2, Cristina Keiko Yamaguchi2
1Market Intelligence Analyst, Yara Brasil Fertilizantes, São Paulo, Brazil
2Department of Applied Social Sciences (UNACSA), Graduate Program in Socioeconomic Development (PPGDS), UNESC, Criciúma, Brazil
Correspondence to: Melissa Watanabe, Department of Applied Social Sciences (UNACSA), Graduate Program in Socioeconomic Development (PPGDS), UNESC, Criciúma, Brazil.
| Email: |  |
Copyright © 2015 Scientific & Academic Publishing. All Rights Reserved.
Abstract
Brazil has increased food production. Management techniques applied to Brazilian soil, combined with the production of biotech seeds has become possible and economically viable the Brazilian states such as Maranhão, Tocantins, Piauí and Bahia, together known as MATOPIBA, the last Brazilian agricultural frontier. Fertilizers followed this growth trend, due to the need for its use. This study aims to evaluate MATOPIBA agricultural expansion in the Brazilian soybean production and fertilizer consumption scenarios for the coming years, calculating the Compounded Annual Growth Rate (CAGR). The results show that long-term tends to a major expansion of planted grains area, especially soybean MATOPIBA. Projections indicate fertilizer consumption should exceed 11 million tons in the four states studied until 2022.
Keywords:
Fertilization, Crop production, Scenarios, Agribusiness
Cite this paper: Renata Horvat, Melissa Watanabe, Cristina Keiko Yamaguchi, Fertilizer Consumption in the Region MATOPIBA and Their Reflections on Brazilian Soybean Production, International Journal of Agriculture and Forestry, Vol. 5 No. 1, 2015, pp. 52-59. doi: 10.5923/j.ijaf.20150501.08.
1. Introduction
According to the United Nations the global population is expected to increase to7,8 billion people in 2020 [1]. It directly impacts to the food production. Brazil’s current agricultural scenario strengthen the fact that biotechnology is an important partner in the development of agribusiness, high productivity in grains, fibers, fruits among others, and also in regions that were before considered unproductive, such as Cerrado. This biome, considering Brazil’s second largest biogeographical region, extends a biodiversity comparable to the Amazon Rainforest biodiversity, featuring by the three largest watersheds of South America: Tocantins-Araguaia, São Francisco and Prata river [2].Cerrado region has approximately 1.5 million km2. Including peripheral areas, present in other domains and in transition zones with Brazilian Amazon, Atlantic Forests and Caatinga biomes, this area can exceed 1.8 million km2 [3]. During the 1970s, the Cerrado region became highly explored by agriculture and livestock. The first major expansion occurred in the state of MatoGrosso, considered until then an agricultural frontier. Nevertheless, as cities were structured and the crop production becoming stronger, other regions with the same ability were being explored, mostly the village of Mimoso do Oeste, located in the state of Bahia (this village became Luís Eduardo Magalhães in 2000, after being established as a municipality), around the city of Barreiras, located in the same State. These states, Maranhão, Tocantins, Piauíand Bahia, became the center of agribusiness and named MATOPIBA and also attracted producers and rural investments. Figure 1 shows the map of Brazil with their biomes and the region approached by the present study.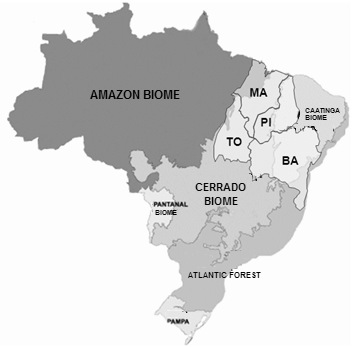 | Figure 1. Map of Brazilian biomes, highlighting the location of MATOPIBA. Source: Adapted from [5] |
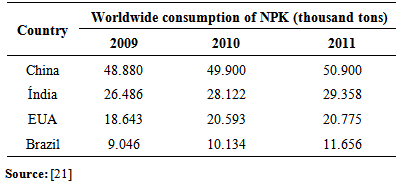
Soybean (Glycine max (L.) Merrill) is the main agricultural production in these regions. Occupies approximately 49% of the area of grain crops in Brazil with possibilities for expansion [4]. This increase can happen in degraded areas, crop substitution or opening new areas in regions such as the Midwest, North and Northeast of Brazil.The production of oilseeds started in the South. It is consolidated and nowadays is found in different environments, as shown by the crop in the Cerrado region. However, in order to increase, the incentive to the use of technology in equipment and research in laboratories were necessary.These studies were extremely supported by EMBRAPA (Brazilian Agricultural Research Agency), which from the1970s, became critical in preparing conditions to the advance of soybean farming in Brazil, above all by developing ways to improve productivity and promoting the adaptation in many environments [6].During the 1980s, soybean led the startup of a new migration to Central Brazil (mostly in the states of Goiás and MatoGrosso), taking areas until then depopulated and devalued to progress and development. This new migration followed to the expansion of new territories in the Cerrado biome, establishing a new agricultural frontier to this biome. The new agricultural frontier is becoming even more promising due to the high productivity in this region because of good weather conditions, management and to the adoption of technologies adapted to the crop [7]. According to the same author, the perspectives of this region point to the increase of production in the next years. More importantly, this growth can be reached respecting environmental laws, in which the Brazilian Forest Code advocates the reduction of deforestation.Nowadays, the oilseeds are the main product of Brazilian agribusiness and their grains are important in the application of agroindustry (production of vegetable oil and feed for animal nutrition), chemical and food industries. Recently, the possibilities of uses of oilseed became an alternative source like biofuel [8], capable of diminishing in 78% the emission of gases causing the greenhouse effect in the atmosphere.In accordance with the seventh crop survey available by CONAB (National Food Supply Company), the government agency responsible for agricultural estimates in Brazil, the estimated area for 2013/14 increases 8.2% in comparison to the previouscrop, reaching more than 30million hectares. This increase happened in all regions; however, Tocantins was the State that has increased its area the most. The production for this crop is estimated in approximately 86 million tons, amount 5.6% bigger than the 2012/13 crop [9]. The MAPITOBA region presents climate adversities as an important factor to risks that undermine the balanced productivity the crops [10].By another point of view, the international soybean market presented a significant evolution from the improvement of the process of extraction and the adaptation of new varieties to different regions of the planet. Concomitantly to the equipment technology, the research and development (R&D) in the dynamics of the agricultural sector changes very quickly. In Brazil, public and private initiatives invest on this segment, looking for significant results to research institutions and rural producers [11]. Estimate that EMBRAPA is responsible for 52% of the agriculture R&D in Brazil; the state governments are responsible for 20% and the Universities correspond for about 21% (estimate period: 1996). In addition, the private sector has been critical to the development of new varieties in Brazil, and there are many studies that do not directly involve EMBRAPA [12]. This combined workled Brazil to be well established in world ranking. The history of this partnership can be observed in numbers: Brazil’s soybean production raised from 1,056 million tons in 1969 to 86 million in the 2013/14 crop, according to the CONAB estimative [9], even after significant climate issues occurred in Brazil, due to a loss in the 2012/13 crop. Even so, Brazil is nowadays is the second larger producer in the world, after the United States of America that estimates a production of 89,5 million tons [13]. According to the Ministry of Agriculture [14], the national industry converts, per year, around 30.7 million tons of soy, producing 5.8 million tons of edible oil and 23.5 million tons of protein meal, which contributes to the national competitiveness in the production of meat, eggs and milk. In addition, Brazilian soybean and soybean meal have high protein content and Premium quality, which qualifies the Brazilian soy to extremely demanding markets such as the European Union and Japan. A study developed by WWF Brazil [15] explains that, in order to fulfill internal and external demands for soy oil, soybean meal and biodiesel, Brazil should crush 57.8 million tons of soy in 2020, which represents a 23.0 million tons increase if related to the estimated volume for2009. As an increasing demand for soybean export in Brazil is expected, the request for soy would be 129.3 million tons in 2020. Such demand would require a significant increase in Brazil’s production to125.7 million tons estimated for 2020, as well as a significant increase in crop area, considering the premises adopted for average increase in Brazilian productivity. To meet the forecast demand, the soybean crop area in Brazil would have to grow in absolute numbers of 14.0 million hectares. Considering only soybean production, the official estimates from producer’s organizations and research organisms outline an additional availability of close to 100 million hectares for the expansion of soy cultivation in Brazil [16].As China and the United States of Americado not have this area of arable land as possible to increase production. Creating opportunity for countries of South America such as Argentina, Brazil and Paraguay.The good scenario of a country that knows where and how to increase its production, forecasts an improvement of more than 40% until 2020, while in the United States, which is currently the largest worldwide producer, the growth in the same period will be at most of 15%. With this forecast, Brazil will achieve a production of more than 105 million tons, and will become the largest producer of this commodity in the world [17].Nowadays, the soybean production in Brazil is led by the states of MatoGrosso, with 28,9% of Brazil’s production, followed by the state of Paraná with 19,5%, Rio Grande do Sul with 15,39% and Goiás with 10,5%. However, the production of soybean is rapidly evolving in the states of Maranhão, Tocantins, Piauíand Bahia [9].A strong demand for soybean and products around the world are alerts concerning the importance of improving more and more productivity levels. Therefore, fertilizers develop a key role. Due to the direct relationship with the mineral nutrition of plants and their production, these inputs represent around 25% of the oilseed production costin the municipality of Sorriso-MT [18]. Brazil’s production of fertilizers is small if compared to the consumption in Brazil (and worldwide) most of all is imported. Thus, understanding the needs of cultivations, how and in which regions, where they are most needed, are significant issues to guarantee supply and crop production.In the region of MATOPIBA the main limitation is low natural soil fertility. In this biome, the latosols oils are the more representative [19]. The latosols have great potential for agriculture; however, their physical and chemical conditions demand an appropriate management that includes the use of fertilizers and, consequently, other investments. These inputs provide the necessary nutrients to the development of cultivations, given their demands.Fertilizers are considered as commodities in international markets. The inputs utilized in production demand a high level of industrial sophistication and are intense in capital and scale – such as the petrochemical (sulphur, urea) or potassium and phosphorus – which depend on a mining infrastructure [20].Brazil imports the majority of fertilizer consumed in the country; however, Brazil is the fourth in consumption according to data from the National Association for the Diffusion of Agro Fertilizers and Defensives -ANDA [21]. Table 1. Major consumer countries of NPK (Nitrogen, Phosphorus and Potassium)
 |
| |
|
Although Brazil’s productions have a large number of mixers and producers of feedstock, it is not enough to fulfill the demand that is becoming higher over the years. The first fertilizer industries in Brazil emerged in the 1940s and exclusively mixed NPK [22]. The exploration of phosphate mines and other chemical industries existing at that time, all supported by the government, and the imports, were enough to fulfill Brazil’s demand. From the 1990s, the fertilizers sector has grown considerably, due to privatizations occurred in the sector during the opening of economy. Moreover, the production did not follow the domestic demand growth, as can be shown in Graph 1.  | Graph 1. Comparison between import and national production of fertilizers (2009 to 2011). Source: Adapted from [21] |
Soybean is the cultivation that consumes fertilizers the most in Brazil, reaching 35% of the delivery in the country. The international dependency of Brazil on almost 64% of fertilizers can be considered a bottleneck for production growth, besides the price change in the international markets.The importance of fertilizers to food production in Brazil is considerably high. In the period between the crops of 1992/1993 and 2006/2007 in which the annual average growth of planted area in Brazil was 1,7%, the fertilizer consumption raised 5,9%/year and the production of grains increased 4,5% [21, 7].This work intended to analyze the agricultural expansion of MATOPIBA in Brazil’s soybeans production and the scenarios of fertilizer consumption for the next years. As a reference, it was analyzed the historical data series of fertilizer consumption in Brazil, the agricultural expansion in the MATOPIBA region and the scenarios of fertilizer consumption in this region for the next 10 years was observed.
2. Materials and Methods
The investigation will be developed by means of exploratory research methodologies developed with the objective of providing an overview concerning a specific data [23]. This study was bibliographical character and long-term forecasts allow estimating the growth of given variable for the next years, based on the analysis of its historical data series, considering other factors inherent to the study. This work used a forecast from 2012/13 to 2022, covering a 10-years period.The index most used for this estimate is CAGR (Compounded Annual Growth Rate), because it applies a pre-determined growth rate during the time to be evaluated. Calculating the CAGR will do the study forecast for the next years or a compound annual growth rate, as mathematical formula below applied to the analyzed variable history.  | (1) |
where: V (t0) = initial value
 V(tn) = final value
 tn-t0 = number of yearsThis index will be applied in order to help on fertilizer consumption estimates in the region of MATOPIBA, considering the increase in soybean crop area and its consequences in Brazil’s production of this grain.
3. Results and Discussion
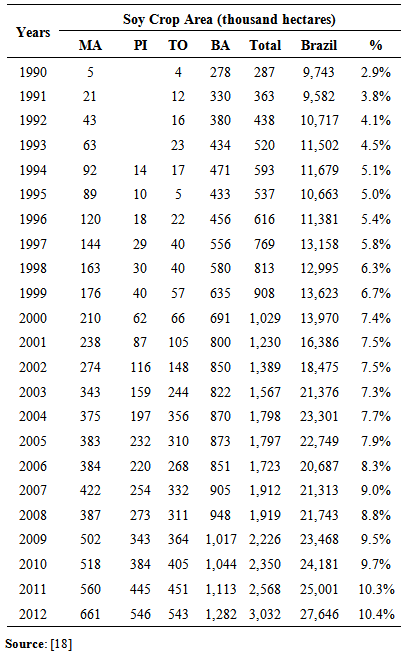
Together, the states of Maranhão, Tocantins, Piauíand Bahia cultivated approximately 2.3 million hectares of soybean harvested in the 2010/11 crops, 11% more than in 2009/10. These states should produce 7.3 million tons in the next years, which means a 26.9% growth, due to the increase of productivity. In 2012, these States represented 10.3% of Brazil’s production; Maranhão represents 2.30%, Piauí 1.80%, Tocantins 1.60% and Bahia 4.60% of this amount [5].Table 2 presents the evolution of soybean crop area in the state group studied, as well as its representativeness in Brazil. A gradual growth in this period shows a slow, continuous migration to the region, which can be explained by the need of large investments in cutting down Cerrado native vegetation (i.e., opening new agricultural areas), besides soil management that depends on large investments.Table 2. Historical data series of crop area in the MATOPIBA region versus Brazil (1990 until 2011) and the participation (%) of the block in Brazil area
 |
| |
|
An increasing expansion in recent years in the region studied, due to a set of factors: good agricultural conditions, flat land, mechanized lands, well distributed rainfall throughout the production cycle and cost of land lower than that charged by other traditional areas in the production of grains such as South of Brazil and even the state of MatoGrosso. In 2011, among the four states that form the region of MAPITOBA, the state of Bahia has the largest crop area, exceeding 1 million and 100 thousand hectares, mostly in the west of the state, where grains are produced. The second largest crop area is located in the state of Maranhão, with 560 thousand hectares, followed by the states of Tocantins and Piauí, with 445 thousand and 451 thousand hectares with soybean cultivation, an amount of 2 million 568 thousand hectares. This means that 10.3% of cultivated soybeans in Brazil are located in the region of MATOPIBA (Table 2).Concomitantly to the increase of crop area, in the period from 1990 to 2012, fertilizer deliveries increased significantly in this region can be observed, as shown in Table 3. As the state of Tocantins was created in the 1990s, only in 1997 the National Association for the Diffusion of Agro Fertilizers and Defensives (ANDA) started to release their fertilizer consumption. A significant increase in all states, with few reductions in isolated years, can be observed. Table 3. Historical data series of volume of fertilizer delivered MATOPIBA, identified by State, from 1990 to 2011
 |
| |
|
In a comparison of the volume of fertilizer delivery throughout Brazil, an increasing participation of MATOPIBA region of numbers presented by ANDA was observed. Of all deliveries of this input done in 1990, only 2.6% was done in MATOPIBA. In 2011, this number reached 10,4% of the total, exceeding 2.9 million tons (Table 3). In the total volume of fertilizer delivery presented by ANDA in 2011, the MATOPIBA region is in ninth place on consumer delivery ranking, followed by the states of Mato Grosso, São Paulo and Minas Gerais, respectively the first places [21].The combination of these factors (land versus fertilizer consumption) has as a consequence the direct growth of crop production. The official data worked with year-crop to present the volume of grains produced in the time period.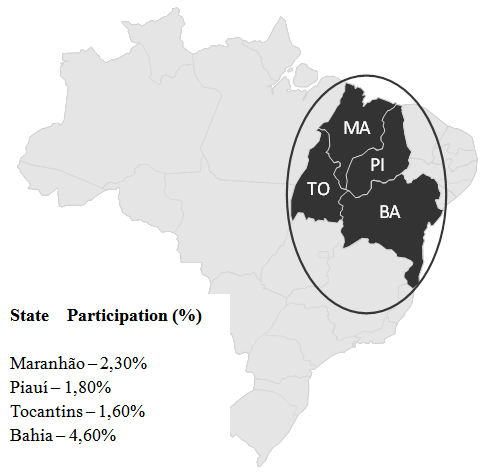 | Figure 2. Emphasis of MATOPIBA block in the map of Brazil. Source: Adapted from [4, 5] |
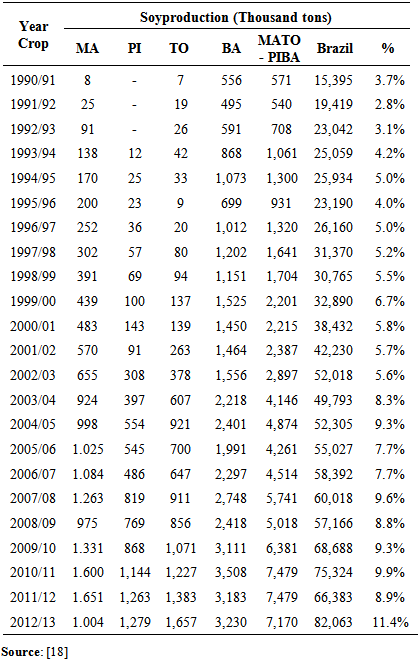
In the case of soybean, the plantation occurs from September in some regions of Brazil, as in the state of MatoGrosso (the first State to begin the activity) and the crop is extended until July, in last plantings such as in MATOPIBA. The history of this block, compared to the national soybeans production and the percentage of Brazilian participation are presented in Table 4.Table 4. Participation of MATOPIBA region on the growth of Brazilian soy production – history by year-crop
 |
| |
|
It is noted that Brazilian soybean production is growing in average 3.8% per year. Nevertheless, these values are below the expected in 2011/2012 crop, when the production was 12%, less than 2010/2011 crop, due to drought in south region, according to the Systematic Report of crop production, presented by IBGE. However, the investments in technology and the production center is still displacing to agricultural frontiers, as can be observed in the states of Maranhão, Tocantins, Piauíand Bahia. In 2012 the production in these four states totalized 11.3% of all soybean produced in Brazil, although the data of this crop are still an estimate (Table 4).In 2011/2012 crops, the participation of MATOPIBA corresponded to 8% of the production, less than the value close to 10% of the last crop. Part of this loss is due to climate issues and production increase in traditional regions such as the states of MatoGrosso and Paraná.The expansion of soybean production in Brazil will happen by means of the combination of area expansion and productivity. The increase in production by crop area suggests an increase in fertilizer consumption (Table 5) and other inputs, which complete the technological package of cultivations, increasing productivity and slowing down the opening of new areas.By observing, an increase in crop area (Table 2), can determine the index of this evolution, by applying the mathematical formula to determine CAGR, as shown by data below (Table 5). Table 5. CAGR growth index of soy crop area in MATOPIBA region
 |
| |
|
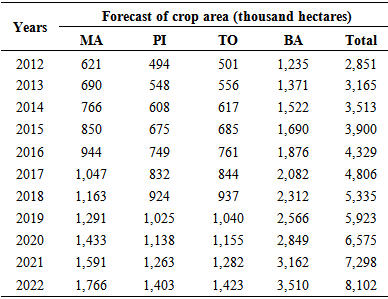
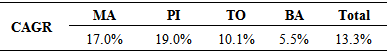
When observing the CAGR index of each state, significant values in MATOPIBA are observed, while the state of Bahia shows a slow increase. However, when considering absolute values, this state has a more significant expansion.In percentage values, the state of Maranhão leads the group, with 25.7% of annual growth, followed by the states of Tocantins (25.4%), Piauí (18.1%) and Bahia (6.8%). However, considering growing lands for oilseeds, the state of Piauí has a good chance of overcoming the state of Maranhão in a few years due to the location of growing lands, located inflat land regions of the state, which makes mechanization easier. For the forecast, the average CAGR among the states of 11% (Table 5) will be applied to determine the soybean crop area in the next 10 years. With the index defined, the Table 6 presents the scenarios. In accordance to the Table 6, the soybean crop area in MATOPIBA should exceed 8million hectares in 2022. The growth percentages clearly vary from one year to another, differently from state to state, due to factors inherent to the expansion of agriculturally land or conversion of crops and from environmental or even logistics issues, to production flow.Table 6. Forecast of soycrop area from 2012 to 2022
 |
| |
|
Nevertheless, this growth is possible considering that in traditional regions there is no further area to expand. Thus, the trend is directing crop productions to this region, taking with them improvements achieved in cities around large agricultural potential production.To conclude, by applying the same methodology to obtain CAGR studying fertilizer delivery volumes in the states analyzed, the calculation can obtain the following values (Table 7): Table 7. Fertilizer consumption growth rates (CAGR index)in MATOPIBA region from 1990 to 2011
 |
| |
|
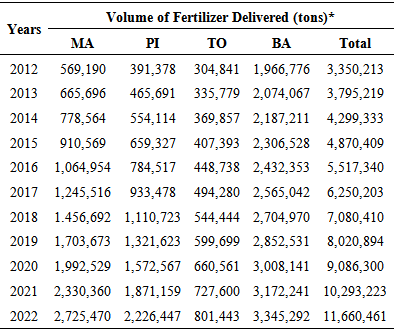
In general, the four states presented an average growth of 13.3% in fertilizer consumption, mostly Piauí and Maranhão, followed by the states of Tocantins and Bahia. In absolute values, the state of Bahia presents higher growth levels in using these inputs. This difference in fertilizer consumption is linked to soil characteristics, which can differ in fertility levels from one state to another, demanding a more detailed, specific management for each region. Table 8 shows the fertilizer volume forecast that can be delivered in each state of the block up to 2022, considering the average growth index for each state, presented in Table 7.Table 8. Forecast of fertilizer consumption, applying the CAGR index of each State
 |
| |
|
Projections indicate fertilizer consumption should exceed 11 million tons in the four states studied. This number is possible considering projections of grain crop area increase, especially soybean. Other way of forecasting fertilizer consumption is multiplying the average fertilization of the state by crop area. However, this methodology is for practical use and there is no detailed scientific explanation in this regard. In any way, the values would be close to that obtained by means of average CAGR. These estimates direct the fertilizer market, mostly the size of world production capacity, study of suppliers and need for expanding the logistics networks that transports the inputs and, subsequently, grains to be produced. Estimates for soybean grain indicate an increasing production in Brazil of 88.9 million tons in 2021/2022. This projection is 17.8 million tons bigger, if compared to the Brazilian production of oilseeds in the 2011/2012 crop, according to data from the Ministry of Agriculture, Livestock and Food Supply [5]. FIESP (Federation of Industries of the State of São Paulo) explains that Brazil’s soybean production should present 2.8% of average growth by year up to 2022, which means 1.4% more than worldwide estimate [24]. According to the same publication, Brazil will increase its participation on world export on agribusiness main products in 2022. Besides, the incorporation of lands will be lower; while between 2002 and 2011, 1, 212 thousand hectares were incorporated per year, in the projected period of 2012/2022, 443 thousand hectares per year will be necessary, highlighting the importance of investing in high technology with trends to increase production without changing dramatically crop area sizes. This means the preservation of approximately 5.2 million hectares.According to estimates of MAPA, the production of grains (rice, green beans, soybean, corn and wheat) should increase in 21.1%, while the crop area should be expanded in 9,0%. The estimates made until 2021/2022 are that the total crop area should move from 64.9 million hectares in 2012 to 71.9 million 2022, which means an increase of 7.0 million hectares. This expansion of cropland will be concentrated on soybean, plus 4.7 million hectares [5].
4. Final Considerations
MATOPIBA region should present a significant increase of grain production, as well as in its crop area and, consequently, in the fertilizer consumption. The region that consists of the states of Maranhão, Tocantins, Piauí and Bahia should achieve a grain production of 20 million tons in the next 10 years in a crop area of 7.7 million hectares in 2021/2022, equivalent to the estimate to the 2012/2013 crop in MatoGrosso State, that can be even more surprising, reaching levels of up to 11 million hectares [5].Areas that have been occupied in these states have some essential characteristics for modern agriculture: they are flat areas and large, their soil is extremely productive, and there is water available, appropriate climate with long days and high luminous intensity. The major limitation, however, are poor logistics conditions, especially land and port transportation, communication and, in some cases, lack of finance services and structure of cities around agricultural areas [5].Considering the estimates of the Ministry of Agriculture, showing a growth rate of 1.9% per year, and local reality of agricultural frontiers that some state will focus this growth by climatic conditions suitable to grain cultivation or by less land value, or even by the challenge of making the country more and more productive.In Brazil, 4.8 million hectares should be added to current soybean plantations, mostly in MATOPIBA. The state of MatoGrosso, before considered an agricultural frontier, should reduce their growth rates, mostly due to environmental issues.Particular attention is drawn in determining fertilizer consumption, which affects future negotiations, comprising agribusiness chains, since companies distributing inputs, taking into account that most of them are imported, and affects even soybean crushing units to determine the industrial capacity of raw material for next steps of production cycle. Despite climate issues to which Brazil is subject due to its continental size, investments should be maintained in ever growing scales, as to boost Brazil’s position to the most important block in soybean production, as to have better agricultural conditions in Brazil’s properties.
ACKNOWLEDGEMENTS
The Universidade do Extremo Sul Catarinense (UNESC), Department of Applied Social Sciences (UNACSA), Graduate Program in Socioeconomic Development (PPGDS) and to the Group for study and research on Strategy, Competitiveness and Development (GEComD).MBA in Agribusiness - Federal University of Paraná (UFPR).
References
| [1] | L. A. F. Carneiro et. al. (2013) Instituto de Estudos de Saúde Suplementar. Envelhecimento populacional e os desafios para o sistema de saúde brasileiro, [online] Available: www.iess.org.br/envelhecimentopop2013.pdf |
| [2] | N. R. S. Cunha, J. E. Lima, M. F. M. Gomes, M. J. Braga, A intensidade da exploração agropecuária como indicador da degradação ambiental na região dos Cerrados, Brasil. Revista de Economia e Sociologia Rural., 46(2), 291-323. IS, 2008. |
| [3] | L.M. COUTINHO, Aspectos do cerrado: domínio e bioma. [Online]. Available:http://eco.ib.usp.br/cerrado/aspectos-bioma.htm. |
| [4] | MAPA. Ministério da Agricultura, Pecuária e Abastecimento. Soja. [Online].Available:http://www.agricultura.gov.br/vegetal/culturas/soja. Access 20 Dec. 2012. |
| [5] | IBGE. Instituto Brasileiro de Geografia e Estatística. [Online]. Available: www.ibge.org.br. Access 03 Jul. 2012. |
| [6] | V. E. L. Alves, Mobilização e modernização nos cerrados piauienses: formação territorial no império do agronegócio. 2006. Thesis. 305 p. Universidade de São Paulo (USP). |
| [7] | M. C. M. Freitas, A Cultura da Soja no Brasil: O crescimento da produção brasileira e o surgimento de uma nova fronteira agrícola. Enciclopédia Biosfera, Centro Científico Conhecer - Goiânia, 7(12), 2011. |
| [8] | P. R. Costa Neto, L. F. S.Rossi, 2000, Produção de biocombustível alternativo ao óleo diesel através da transesterificação de óleo de soja usado em fritura. Química Nova, v. 23, p. 4. |
| [9] | CONAB. Companhia Nacional de Abastecimento. Acompanhamento de safra brasileira: grãos, sétimo levantamento, abril 2014. [Online}. Available: www.conab.gov.br. |
| [10] | CONAB. Companhia Nacional de Abastecimento. Acompanhamento de safra brasileira: grãos, sexto levantamento, março 2013. [Online]. Available: www.conab.gov.br. |
| [11] | G. Porcile, N. Paula, F. Scatolin, 2000. Arranjos produtivos do complexo soja paranaense. Livro Digital. Universidade Federal do Paraná. |
| [12] | J. M. Alston, P. G. PARDEY, 2001, Attribution and Other Problems in Assessing the Returns to Agricultural R&D. Agricultural Economics, 25 (2-3), 141-152. |
| [13] | USDA. United State Department of Agriculture. Production, Food and Distribution on line. [Online].Available: http://apps.fas.usda.gov/psdonline/. |
| [14] | MAPA. Ministério da Agricultura, Pecuária e Abastecimento. Projeções do Agronegócio: Brasil 2009/2010 a 2019/2020, Assessoria de Gestão Estratégica. Brasília, 2012, 76. |
| [15] | WWF BRASIL. O impacto do mercado mundial de biocombustíveis na expansão da agricultura brasileira e suas consequências para as mudanças climáticas. Programa de agricultura e meio ambiente. Brasília, p. 66. 2009. [Online] Available: www.wwf.org.br. |
| [16] | S. Schlesinger, S. Noronha, 2006. O Brasil está nu! O avanço da monocultura de soja, o grão que cresceu demais. Fase, 148 pp. |
| [17] | A. Z. Vencato, et al. Anuário Brasileiro da Soja, 2010. Santa Cruz do Sul: Ed. Gazeta Santa Cruz, p. 144. |
| [18] | CONAB. Companhia Nacional de Abastecimento. Intenção de plantio – primeiro levantamento, outubro 2012. Available in: www.conab.gov.br. Accessin: 01 Oct. 2012. |
| [19] | J. R Correia, A. Reatto, S. T. Spera, Solos e suas relações com o uso e o manejo. In: Sousa, D. M. G. de.; Lobato, E.,2004, (Ed.) Cerrado: correção do solo e adubação. 2. ed. Brasília: Embrapa,. cap. 1, 29-58. |
| [20] | SEAE. Secretaria de Acompanhamento Econômico. Ministério da Fazenda. Panorama do mercado de fertilizantes. [Online]. Available:www.seae.fazenda.gov.br/.../i_fert_seae_-2011_fertilizantesglauco.pdf. |
| [21] | ANDA. Associação Nacional para Difusão de Adubos. [Online]. Available: www.anda.gov.br. |
| [22] | E. Fernandes, B. A. Guimarães, R. R. Matheus, Principais empresas e grupos brasileiros do setor de fertilizantes. BNDES Setorial, Rio de Janeiro, n. 29, p. 203-228, mar. 2009. |
| [23] | A. C. Gil. Métodos e técnicas de pesquisa social. Ed.5. São Paulo: Atlas, 2006. |
| [24] | FIESP. Outlook Brasil 2022. [Online]. Available: www.fiesp.com.br/outlookbrasil. |
 Abstract
 Reference
 Full-Text PDF
 Full-text HTML