-
Paper Information
- Next Paper
- Paper Submission
-
Journal Information
- About This Journal
- Editorial Board
- Current Issue
- Archive
- Author Guidelines
- Contact Us
International Journal of Agriculture and Forestry
p-ISSN: 2165-882X e-ISSN: 2165-8846
2014; 4(6): 446-450
doi:10.5923/j.ijaf.20140406.05
Near-Infrared Spectroscopy of Yellow Endosperm Pigments in Wheat
 Abstract
 Reference
 Full-Text PDF
 Full-text HTML
Negash Geleta1, Heinrich Grausgruber2, Johann Vollmann2
1Department of Plant Sciences, Wollega University, Nekemte, Ethiopia
2BOKU-University of Natural Resources and Applied Life Sciences, Department of Applied Plant Sciences and Plant Biotechnology, Institute of Agronomy and Plant Breeding, Tulln a.d. Donau, Austria
Correspondence to: Negash Geleta, Department of Plant Sciences, Wollega University, Nekemte, Ethiopia.
| Email: |  |
Copyright © 2014 Scientific & Academic Publishing. All Rights Reserved.
Rapid, cheap, non-destructive, chemical free, accurate and reproducible methods are important tools in the selection for ingredients of crops. In case of yellow endosperm pigments the determination of carotenoids and other compounds by HPLC is both time consuming and expensive. Other method such as spectrophotometry after extraction with butanol is laborious and unpleasant due to the extraction time and odour of the solvent, respectively. Near-infrared spectroscopy (NIRS) is widely applied in different food crops for the determination of a broad variation of ingredients, e.g. protein, carotenoids, fatty acids, oils etc. The objective of the study was to establish a NIRS calibration for yellow endosperm pigments of different wheat species. The results indicated that NIRS discriminated satisfactorily between high and low yellow pigment contents of different wheat genotypes and species. The analysis showed that diploid einkorn wheat was clearly separated from tetraploid and hexaploid species. Moreover, durum varieties were also clearly separated from other tetraploid species/subspecies. It is concluded that NIRS is a valuable selection method to separate a large amount of genotypes in low and high yellow pigment types which subsequently can be analysed by other methods for an exact determination of quantity and quality of endosperm pigments.
Keywords: Carotenoids, Discriminant analysis, Fourier Transform, Triticum
Cite this paper: Negash Geleta, Heinrich Grausgruber, Johann Vollmann, Near-Infrared Spectroscopy of Yellow Endosperm Pigments in Wheat, International Journal of Agriculture and Forestry, Vol. 4 No. 6, 2014, pp. 446-450. doi: 10.5923/j.ijaf.20140406.05.
Article Outline
1. Introduction
- There are different kinds of spectroscopic instruments, e.g. Near-Infrared (NIR) Fourier Transform (FT) Raman spectroscopy, FT-NIRS, and FT Mid-Infrared (MIR). Efficiency of each instrument depends on the type of calibration model and the studied phytochemicals. For Raman Spectroscopy a sample is radiated withmonochromatic visible, ultra-visible, near-infrared light emitted from a laser, which probes molecular vibrations (stretching, deformations) and consequently information about the structure of chemical components present in the investigated sample is gathered [3]. The authors recommended Raman spectroscopy for the investigation of carotenoid content in living plant tissues of of size ranging from 0.01 mm2 to 35 cm2. While FT-MIR spectroscopy contains a wealth of information ranging from absorption bands typical for functional groups to the fingerprint region, which is unique for each molecule [11]. The authors used FT-MIR spectroscopy for rapid and higher throughput screening of Fusarium graminearum infested maize kernels to predict the contamination with the mycotoxin deoxynivalenol (DON). On the other hand NIRS provides information on the vibrational, low harmonic modes of stretching and bending bonds. The absorption bands in the near-infrared region are known to be excellent markers of the state of water hydrogen (-OH) bonds. For this reason, this technique has been widely used in many areas such as agriculture [6, 19], pharmaceutical and medical sciences [18, 20], polymer and textile industries [5] and in the study of soil [15].Near-IR (NIR) spectroscopy (4000-14000 cm-1) offers other advantages, which account for its widespread use in the agricultural and food industries and NIR spectra exhibit low-absorptivity combination and overtone bands of the fundamental vibration modes. As a result, longer pathlengths can be used that allow for the measurement of opaque, intact test samples (e.g., grains, seeds, and fats and oils) or those at higher concentrations relative to mid-IR. Besides transmission and diffuse reflection, the transflection mode with fibre optic probes is commonly used in NIR measurements(http://lipidlibrary.aocs.org/topics/IR-trans/index.htm: accesed date 24 August 2013).Yellow pigment extraction of carotenoids with water saturated butanol (WSB) and subsequent spectrophotometry following ICC Standard Method 152 and/or AACC Method 14-50 is a cumbersome method if a large amount of genotypes, e.g. for early generation selection or screening of genetic resources, should be analysed [7]. Moreover, HPLC analysis for carotenoids is time consuming too and very expensive. NIRS analysis, however, is fast, cheap and chemical free, and can be reliable if the establishment of an acceptable calibration is possible. These advantages have made it possible for NIR spectroscopy in conjunction with multivariate statistical analysis to be routinely applied to compositional determinations, classifications, and prediction of functionality. Advanced chemometrics, such as partial least squares (PLS) regression, are required for the analysis of observed NIR spectra due to the overlap of broad combination and overtone bands.NIRS was successfully applied for the analysis of carotenoids in maize by Brenna & Berardo [4] and in wheat by Geleta et al. [8]. Brenna & Berardo [4] found a good correlation between the results from high performance liquid chromatography (HPLC) and NIRS, while Geleta et al. [8] found even better correlation of NIRS results with distilled water saturated n-butanol (1:6 v/v H2O:butanol) (WSB) method. In barley NIRS was applied for example for the analysis of β-glucan [21] or for the classification of endosperm genes [9]. In quality control NIRS was for example used in the analysis of lecithin and by-products during soybean oil processing [13] or for the determination of lipid oxidation in cereal food products and food quality and safety analyses [1, 10]. Recently, NIRS also used in food industry for food quality control, e.g. Xu et al. (23) have applied NIRS with one class partial least square (OCPLS) to detect untargeted protein adulteration in Yoghurt. NIRS can also be used to cluster or group different genotypes based on their spectra [8, 9]. Different spectroscopic instruments for the determination of product quality in plants are available. Yang et al. [24] compared FT-MIR, FT-NIR and FT-Raman spectroscopy for discrimination of 10 different edible oils and fats. They found that FT-MIR was the most efficient with a classification accuracy of 98% followed by FT-Raman(94%) and FT-NIRS (93%) and recommended all for the potential use of rapid and simple determinations of edible oils and fats with chemometric analysis. The partial least-squares (PLS) calibration method as a chemometric tool was used to develop a calibration model using FT infrared spectroscopy spectra data of biodiesel samples from different sources such as cotton, castor and palm which were mixed with raw soybean oil to simulate an adulteration system [22]. Therefore, the objective of the study was to establish a FT-NIRS calibration for the quantitative determination of carotenoids in different wheat species.
2. Materials and Methods
2.1. Plant Materials and NIRS Instrumentation
- A total of 387 genotypes of diverse wheat species (diploid: Triticum monococcum; tetraploid: T. carthlicum, T. durum, T. karamyschevii, T. turanicum; hexaploid: T. aestivum) grown from 2003 to 2007 in eastern Austria under different management systems, i.e. Gross-Enzersdorf conventional (16°33′ E, 48°11′ N), Raasdorf organic (16°35′ E, 48°13′ N) and Sitzendorf organic (15°55′ E, 48°35′ N), were analysed for yellow pigment concentration by the ICC Standard Method 152. The collection of reflectance spectra was performed by a FT-NIRS instrument Matrix-I (Bruker Optik GmbH, Ettlingen, Germany) using a white light source and an InGaAs detector. Reflectance was measured with a resolution of 4 cm–1 in an operating range of lambda 800–2780 nm (12492–3598 cm–1). Approximately 5 g seed samples were milled with a Cyclotec 1093 sample mill (Foss, Höganäs, Sweden) equipped with a 1-mm sieve. Each sample was measured twice by rotating the sample cup 180°.
2.2. Statistical Analysis
- All calibrations were developed by employing partial least square (PLS) regression using the Opus Quant 2 software package (Bruker Optik GmbH, Ettlingen, Germany). Calibrations were developed independently for diploid einkorn wheat with soft endosperm texture and for tetraploid durum and Khorasan wheat with hard endosperm texture wheats. Moreover, a calibration including all tested wheat species was established. Obtained calibrations were assessed, compared, and discussed on basis of R2 and standard error of cross validation (SECV).
3. Results
- Results of FT-NIRS calibrations are presented in Table 1 and Fig.1. The results showed that FT-NIRS can analyse yellow pigment concentration with good resolutions. Within the sample set including all Triticum species mean yellow pigment (YP) content was 8.22 ppm (related to dry weight). Importantly, values were relatively high and distributed over a wide range (1.7–15.9 ppm) thereby indicating a good suitability for establishing a robust calibration equation. Within the sample set of diploid einkorn wheat (T. monococcum) the mean YP content was 11.2 ppm. Within the sample set of tetraploid wheat species (T. durum, T. turanicum) mean YP content was 6.5 ppm. In the spectra neither time-dependent trends nor any unexplainable outliers could be identified. Generally NIR spectra are pre-treated to eliminate unwanted variability due to path length or particle size variations before developing calibrations. This pre-treatment can de-convolute overlapping peaks and has scatter correction effects. The raw spectra were transformed into 2nd derivative and the spectral data were further pre-processed as indicated in Table 1. The highest value of R2 for calibration and validation was reached for the sample sets including all wheat species. Thereby, the range of YP contents is large enough for a robust calibration, while endosperm hardness had no troublesome influence (Fig.1). In addition, principal component analysis of the FT-NIRS spectra is able to clearly discriminate diploid einkorn wheat from tetraploid wheat species (Fig.2). Hexaploid common wheat varieties were distributed between the two groups of diploid and tetraploid wheat.
|
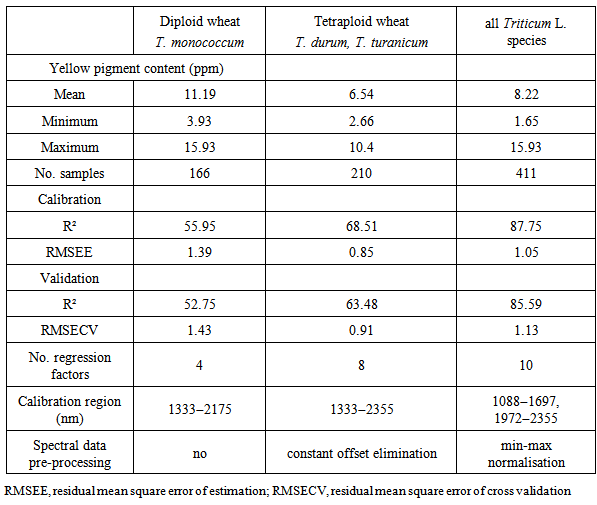
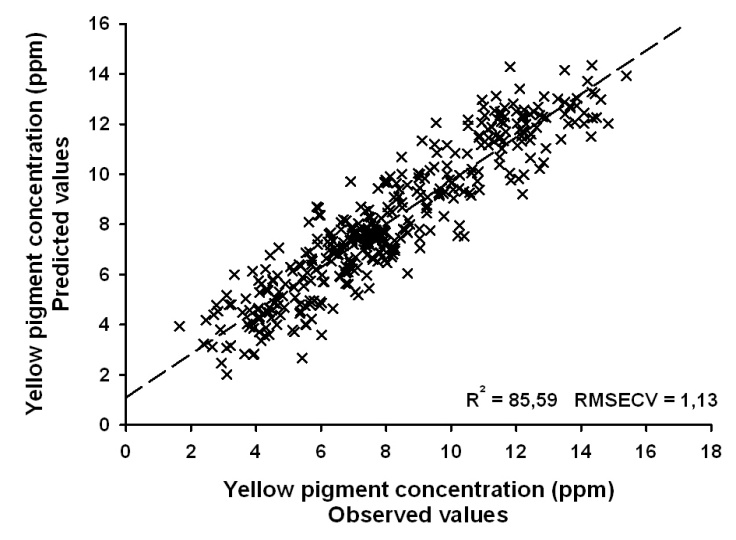 | Figure 1. Relationships between observed and predicted values for yellow pigment concentration in diploid, tetraploid and hexaploid wheat species |
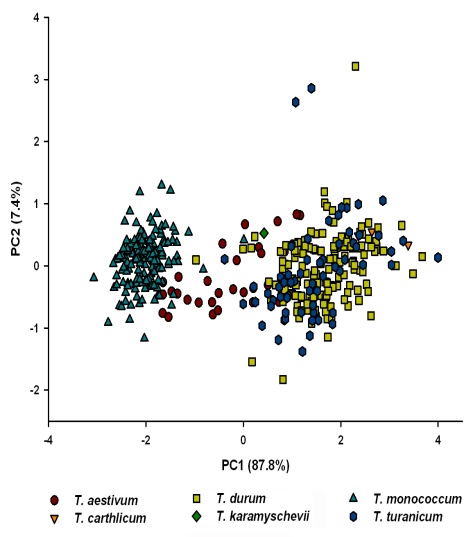 | Figure 2. Discrimination between wheat species according to principal component analysis of their FT-NIRS spectral data |
4. Discussion
- NIRS has wide applications for the analysis of different compounds in plant parts such as seeds [4, 8, 9, 14, 21]. Rapid, cheap, chemical free and easy determinations are major advantages which make NIRS especially suitable for selection in plant breeding programmes. With a good calibration model, NIR spectroscopy techniques can be applied to the measurement of critical sample parameters in unknown samples in the field, on a production line or as part of an inbound or outbound quantitative characterization procedure. The ability to extract such important information from NIR spectroscopy has made it a very important technique for the food and agricultural industries (https://fstjournal.org/features/near-infrared-spectroscopy-analysis-powders-and-grains: accessed date 24 August 2013).In the present study better calibration equation was found for the sample set including all different Triticum species. Thereby, a wide range of yellow pigment concentration was available to yield in a robust calibration (R²=88%). Similar regression statistics were reported by Brenna & Berardo [4] for single carotenoid compounds of maize kernels ranging from R²=0.82 for beta-carotene to R²=0.97 for lutein, and by Atienza et al. [2] for yellow pigment content of tritordeum (R²=0.85).The application of NIRS in different disciplines such as plant breeding or the food industry was reviewed by Munck [17]. The author described in detail the chemometric approach of NIRS data using partial least square correlations. Thereby, genotypes of different crop species with complex traits could have been identified, e.g. high lysine and low lysine barley mutants and hard textured wheats. Further, NIRS can be applied for single kernel measurements of quality (e.g. baking quality) in bulk harvested field mixtures of wheat seeds. Using the chemometric approach data from physical, biochemical, molecular and NIRS investigations can be combined using PLS regression analysis. This is especially interesting for the characterization of a large number of gene bank accessions. Munck [17] showed a complete classification of gene bank accessions of diploid, tetraploid and hexaploid wheat species using principal component analysis of NIRS spectra and physical-chemical data followed by PLS regression analysis for cross validation.Comparison of methods for different NIRS instruments for better estimation of β-glucan in naked barley indicated that FT-NIRS had better accuracy than others [21]. Similarly, Li et al. [13] recommended the application of FT-NIRS for prediction of cis/trans, iodine value and saponification value of edible fats and oils in coconut, soybean, olive, canola and corn. The advantage of FT-NIRS over differential scanning calorimetry (DSC) and size exclusion chromatography (SEC) was discussed by Lachenal et al. [12]. The same authors stated that FT-NIRS offers real time analysis, at-line and on-line monitoring. Moh et al. [16] praised the advantage of FT-IR and FT-NIR spectroscopy for their rapidness, simplicity and chemical free analysis as alternative means to open-column chromatography for measuring β-carotene in crude palm oil. In our study we recommend FT-NIRS for rapid, reliable accurate estimation of carotenoids content of yellow pigment analysis in different wheat species.
ACKNOWLEDGMENTS
- The authors are grateful to Mr. R. Tumpold for his technical assistance during the analysis. It was part of the PhD study for the first author and financed by Austrian Agency for International Cooperation in Higher Education and Research.