-
Paper Information
- Next Paper
- Paper Submission
-
Journal Information
- About This Journal
- Editorial Board
- Current Issue
- Archive
- Author Guidelines
- Contact Us
International Journal of Agriculture and Forestry
p-ISSN: 2165-882X e-ISSN: 2165-8846
2014; 4(4): 310-316
doi:10.5923/j.ijaf.20140404.08
Data Mining Algorithms for Prediction of Soil Organic Matter and Clay Based on Vis-NIR Spectroscopy
 Abstract
 Reference
 Full-Text PDF
 Full-text HTML
Sandro Teixeira1, Alaine M. Guimarães1, Carlos A. Proença2, José Carlos F. da Rocha3, Eduardo Fávero Caires4
1Computer Applied to Agriculture Lab, State University of Ponta Grossa, Ponta Grossa, 84030-900, Brazil
2Information Technology Department, ABC Foundation - Research and Agricultural Development, Castro, 84166-981, Brazil
3Intelligent Systems Lab, State University of Ponta Grossa, Ponta Grossa, 84030-900, Brazil
4Soil Fertility Lab, State University of Ponta Grossa, Ponta Grossa, 84030-900, Brazil
Correspondence to: Alaine M. Guimarães, Computer Applied to Agriculture Lab, State University of Ponta Grossa, Ponta Grossa, 84030-900, Brazil.
| Email: |  |
Copyright © 2014 Scientific & Academic Publishing. All Rights Reserved.
Organic matter (OM) amount and clay content in the soil are important constituents in the sustainability of agricultural systems. The methods used for OM and clay analyses in laboratories are laborious, time consuming and use require reagents that pollute the environment. The use of reflectance in the visible and near infrared (Vis-NIR) can be highly viable in soil analysis identifying the attributes contents in a cleaner and quicker way. There is still no general model specifying the wavelengths to be used for neither each variable being analyzed nor a well-defined methodology to be applied. The aim of this study was to apply all the classification algorithms available in the Weka software trying to find the best correlations between spectral data in the Vis and NIR spectrums, separately, and OM and clay content in the soil. As result, the clay prediction had a strong correlation with both Vis and NIR spectrum. OM prediction presented a determination coefficient greater than 0.7 but brought an error that cannot be overlooked. Lazy KStar algorithm showed to be more adequate to mine the data presenting the higher determination coefficients and the lower errors. The best results for both OM and clay were obtained when correlated with the Vis spectrum. This suggests that it is possible to predict OM and clay using only the Vis spectrum.
Keywords: Soil properties, Vis-NIR, Spectral reflectance, Classifier algorithms
Cite this paper: Sandro Teixeira, Alaine M. Guimarães, Carlos A. Proença, José Carlos F. da Rocha, Eduardo Fávero Caires, Data Mining Algorithms for Prediction of Soil Organic Matter and Clay Based on Vis-NIR Spectroscopy, International Journal of Agriculture and Forestry, Vol. 4 No. 4, 2014, pp. 310-316. doi: 10.5923/j.ijaf.20140404.08.
Article Outline
1. Introduction
- Organic matter (OM) amount and clay content in the soil are important constituents in the sustainability of agricultural systems. Practices that favor the conservation of OM improve soil properties and help reduce the erosion risk. In so-called systems of sustainable management, beneficial microorganisms are incorporated into the topsoil, along with crop stubble and other organic waste, reducing the use of pesticides and fertilizers and leading to an increase in stability and soil conservation [16]. Other important constituent of soil is the level of clay; it has negative electrical charges responsible for cation exchange capacity (CEC), which is one of the requirements for recommending rates of fertilizer and lime. Clay also has a close relation with the water retention of soil.The methods used for soil physical properties analyses in laboratories are laborious, time consuming and require the proper disposal of reagents; otherwise they will pollute the environment [25]. For the determination of OM in soil, the most widely used procedure is that proposed by Walkley-Black [27], which uses the dichromate (Cr2O72-) that causes environmental contamination by chromium. A major challenge now is the development of analysis methods that require a minimum pre-treatment of samples, that are fast in achieving satisfactory answers and, mainly, that are non-destructive. An alternative that has shown good results is reflectance in visible (Vis) and near-infrared (NIR) spectroscopy (Vis-NIR). This methodology is based on the measurement of the absorption intensity of electromagnetic radiation in the visible and near-infrared regions.Analysis using Vis-NIR is an amalgamation of spectroscopy, statistics and computing. The mechanical principle behind the technique is to illuminate a sample with light of a specific and known wavelength of the electromagnetic spectrum. The light absorption is measured by differences between both the amount of light emitted and reflected by the sample, being a ratio that can predict the physical-chemical composition of the sample [1]. According to the physical-chemical attributes of soil there is a spectral individualization of it where each one represents a spectral signature and this is the basis of the studies in this area. Information about the soil can be found at given wavelength or at a specific electromagnetic spectrum [17].Obukhov and Orlov [15] showed the differences between groups of soils using spectral reflectance. However, their findings were not expanded upon until Shepherd and Walsh [19] presented the use of diffuse reflectance in the visible and near-infrared regions for the rapid assessment of certain fertility parameters in surface soil in East Africa. Fidencio et al. [7] used reflectance in the near infrared to predict organic carbon in Brazilian soil and they also carried out a study similar to that of Obukhov and Orlov [15]. Stenberg et al. [20] and Viscarra Rossel et al. [26] consider that the OM and clay content associated with the total nitrogen content, are promising factors regarding soil assessment. These authors state that there is a global action towards the development of more methodologies for soil analysis because there is a great demand for large quantities of high quality data to be used in agriculture. They also comment that in 2009 they proposed a project for the creation of a Global Soil Spectral Library. This project is intended to develop a global collaboration network in terms of soil spectroscopy, encouraging wider research and promoting its adoption within soil science. According to Chang et al. [3] the level of clay content is the attribute that performs best in predictions using data in the Vis-NIR wavelength region of the spectrum. Additionally, Moron and Cozzolino [14] evaluated the content of sand, silt and clay in soils in Uruguay; R2 results obtained in the calibration were higher than 0.8 for the fractions of sand, silt and clay. In order to analyze spectral data, statistical regression functions have been applied, increasing the understanding of the soil spectral behavior and obtaining calibration models for the prediction of soil properties [21]. Several statistical regression methods are being used to analyze soil variables using Vis-NIR, such as multiple linear regression (MLR), polynomial regression (PR), principal component regression (PCR) and stepwise multiple linear regression (RLMS) [3; 4; 10; 23].Due to the features of the data obtained from Vis-NIR equipment spectral data mining using machine learning techniques could be considered as an important methodology to be used to find correlations between the different wavelengths and the soil property being analyzed. Data mining (DM), which corresponds to one of the steps of the Knowledge Discovery in Databases (KDD), is a technology that combines traditional statistical data analysis methods with sophisticated algorithms to process big and complex datasets [6]. A comparison between Bayes and lazy classifiers showed that lazy classifiers were more efficient than Bayes classifiers [24]. Also, artificial neural network (ANN) has been applied presenting good results [2; 19].Although there are several papers asserting the viability of using spectroscopy to soil organic matter analysis, applying different techniques to use de , there is still no general model specifying the wavelengths to be used for neither each variable being analyzed nor a well-defined methodology to be used.Besides several computational methods have been tested, other computational data mining algorithms, such as Bagging, M5 Rules and Lazy KStar [29], could be useful in establishing an efficient methodology. Software Weka [8] is a well done computational environment that offers a set of efficient algorithms that present good results in several domains and could be tested and evaluated for this research theme.Other important point is related to the more adequate spectral region to be used analyzing different variables. There is no consensus if it is really need to use a NIR or a Vis-NIR spectrometer to analyses OM and clay. Considering that how more spectral regions the spectrometer covers more expensive it is, identifying a specific spectral range could contribute to reduce costs in acquiring the equipment.The aim of this study was to apply all the classification algorithms available in the Weka software trying to find the best correlations between spectral data in the Vis and NIR spectrums, separately, and OM and clay content in the soil.
2. Material e Methods
2.1. Site Description and Soil
- The study was undertaken at Pirai do Sul city, Parana State, Brazil (24º 22' S, 50º 04' W). The field scale dataset covers an area of 110 hectares and the predominant soils are loamy or clayey Oxisols. The climate in the region, according to Köppen classification is Cfb, with mild summer and frequent frosts in the winter. The altitude ranges from 600 to 1300 m and annual precipitation is about 1.480 mm.The field sampling campaign was based on a georreferenced grid (Fig. 1) generated with one sample per hectare; soil samples were collected 0-0.20 m. In order to form each sample, 8 sub-samples were taken around the point and they were then standardized, totaling 111 soil samples, being one sample per hectare [17].
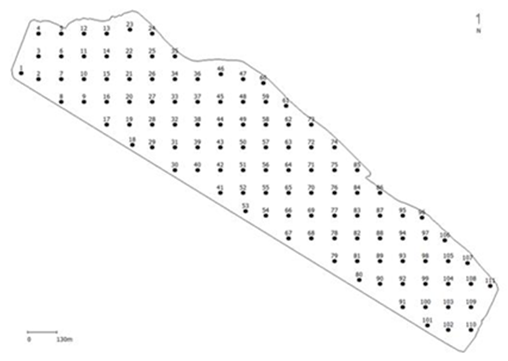 | Figure 1. Georeferenced grid of the field sampling |
2.2. Soil Analysis
- The samples collected were analyzed by ABC Foundation Lab for determining the following parameters: (i) chemical analysis: pH (1:2.5 soil: 0.01 M CaCl2 suspension), total acidity (H + Al), exchangeable Al, Ca, Mg, and K, and organic matter (OM); (ii) texture analysis (g kg-1): clay, silt and sand; (iii) Vis-NIR analysis.Soil samples were oven-dried for 12 h at 40°C and sieved 2 mm) prior to spectral scanning. The samples were analyzed for clay content by the pipette method [5], and for OM using the colorimetric method [18]. Soil pH, total acidity (H + Al), exchangeable Al, Ca, Mg, and K were analyzed according to the methods described by Raij et al. [18].The spectral reflectance in the visible and near-infrared regions were obtained using a FOSS, model XDS, near-infrared spectrometer. The software used was ISIscan, version 3.2, to acquire the spectra and WinISI II, version 1.5 for the curves.The spectra of the soil samples were obtained from readings in nanometers with an increment of 2 nm between scans, in the wavelength range 400-2500 nm. All the diffuse reflectance spectra were automatically converted to log (1/R), exemplified in Fig. 2 by means of four randomly selected samples of clay, where "R" represents reflectance.
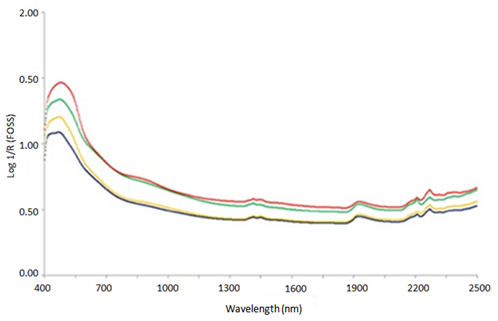 | Figure 2. Graphical representation of the spectral curve of four samples with different clay contents |
2.3. Data Analysis
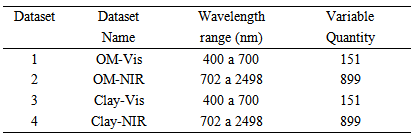
- All the data analyses were carried out in Weka Software [8].The original database consisted of 1064 variables, corresponding to the different wavelengths read by the Vis-NIR spectrometer. In order to analyze the data considering the different Vis and NIR spectrums combining them with clay and OM separately, the database was divided into four datasets, according to presented in Table 1. In data mining notation OM and clay are said goal attributes and the wavelengths variables are said predictors attributes.
|
3. Results and Discussion
3.1. Soil Analysis
- The soil samples used had OM and clay contents in the ranges 15-43 g kg-1 and 123-534 g kg-1, respectively. The pH (1:2.5 soil: 0.01 M CaCl2 suspension) varied from 4.1 to 5.8. The effective cation exchange capacity (ECEC) ranged from 15.7 to 79.5 mmolc dm-3, and the cation exchange capacity pH 7.0 (CEC) ranged from 46.4 to 107.4 mmolc dm-3.
3.2. Wavelengths Filtered
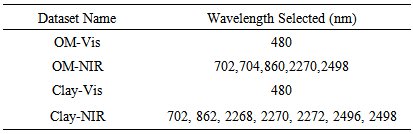
- After applying the selection filter algorithm the number of interest variables (wavelengths) was expressively reduced to no more than 7, as presented in Table 2.
|
3.3. Organic Matter
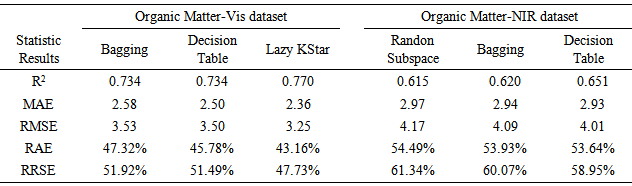
- Based on the three best statistics results obtained for each dataset mined, the most suitable classification algorithms for the domain studied were determined. Table 3 shows results related to OM where Bagging, Decision Table and Lazy KStar algorithms presented the best correlation results between OM and wavelengths in the Vis spectrum (OM-Vis dataset); and the algorithms Random Subspace, Bagging and Decision returned the best correlation of OM with the NIR spectrum (OM-NIR dataset).
|
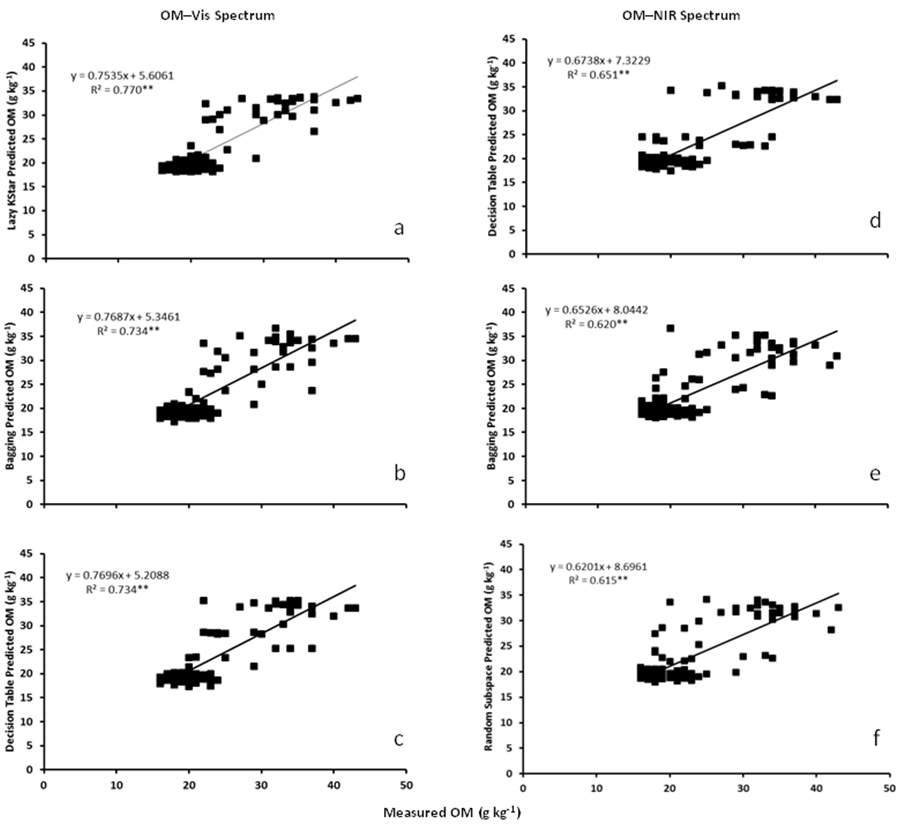 | Figure 3. Relationship between measured OM  and predicted OM and predicted OM  using Vis spectrum and the algorithms: (a) Lazy KStar; (b) Bagging; and (c) Decision Table. Relationship between measured OM using Vis spectrum and the algorithms: (a) Lazy KStar; (b) Bagging; and (c) Decision Table. Relationship between measured OM  and predicted OM and predicted OM  using NIR spectrum and the algorithms: (d) Decision Table; (e) Bagging; and (f) Random Subspace. **P < 0.01 using NIR spectrum and the algorithms: (d) Decision Table; (e) Bagging; and (f) Random Subspace. **P < 0.01 |
3.4. Clay
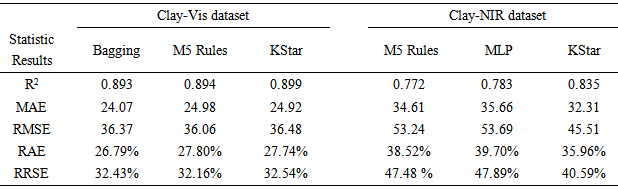
- Predicting clay using the Vis spectrum (wavelength 480) gives a R2 of 0.899. Acceptable errors (RRSE 32.54% in the worst case) were obtained with this dataset. Despite good results were obtained for the correlation between clay with NIR spectrum, they were not better than obtained to clay when the Vis spectrum was considered. The best R2 to Clay-NIR dataset was 0.835. Anyway, estimating clay, with both Clay-NIR and Clay-Vis datasets, presented better results than estimating OM.Table 4 shows the algorithms that returned the results when correlating clay with wavelengths in the Vis spectrum (Clay-Vis dataset); they are Bagging, M5 Rules and Lazy KStar algorithms. M5 Rules, Multilayer Perceptron (MLP) and Lazy KStar algorithms were the best correlating clay with the NIR spectrum (Clay-NIR dataset).
|
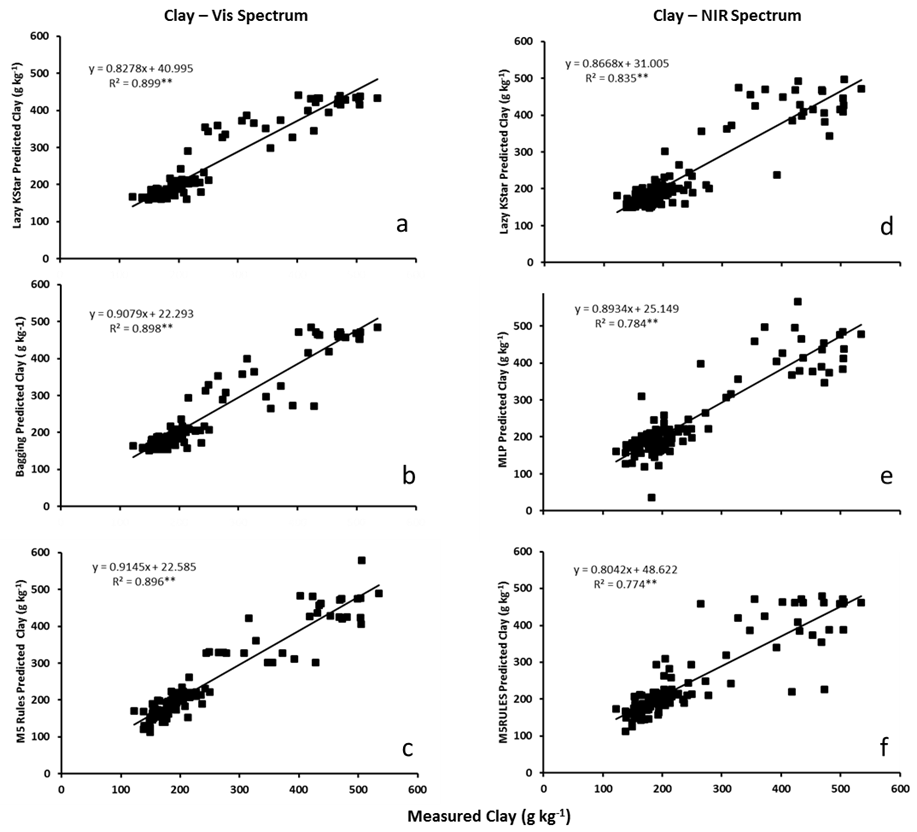 | Figure 4. Relationship between measured clay  and predicted clay and predicted clay  using Vis spectrum and the algorithms: (a) Lazy KStar; (b) Bagging; and (c) M5Rules. Relationship between measured clay using Vis spectrum and the algorithms: (a) Lazy KStar; (b) Bagging; and (c) M5Rules. Relationship between measured clay  and predicted clay and predicted clay  using NIR spectrum and the algorithms: (d) Lazy KStar; (e) MLP; and (f) M5Rules. **P < 0.01 using NIR spectrum and the algorithms: (d) Lazy KStar; (e) MLP; and (f) M5Rules. **P < 0.01 |
4. Conclusions
- Predicting clay content presented a strong correlation with the selected wavelengths. OM estimative had a determination correlation greater than 0.7 but brought an error that cannot be overlooked. This indicates that applying data mining techniques for the studied database was highly feasible to predict clay content and requires further investigation to improve the estimation of OM. Lazy KStar algorithm showed to be more adequate to mine the data presenting the higher determination coefficients and the lower errors when combined with the with the Attribute Selection filter algorithm. The best results for both OM and clay were obtained when correlated with the Vis spectrum. This suggests that it is possible to predict OM and clay when using only the Vis spectrum. The study showed that the use of spectroscopy is feasible, bringing advantages to be a quick and clean technique. To confirm the efficiency of the technique applied in this work, it would be important to conduct the same study in different regions, with a variety of soil types and climatic conditions.
ACKNOWLEDGEMENTS
- We are grateful to ABC Foundation - Research and Agricultural Development, for providing the experimental area, the conventional analysis as well the Vis-NIR spectrometer, making possible to conduct this research.