-
Paper Information
- Next Paper
- Paper Submission
-
Journal Information
- About This Journal
- Editorial Board
- Current Issue
- Archive
- Author Guidelines
- Contact Us
International Journal of Agriculture and Forestry
p-ISSN: 2165-882X e-ISSN: 2165-8846
2014; 4(3): 237-245
doi:10.5923/j.ijaf.20140403.16
End-use Quality of Upland NERICA Rice (Oryza sativa L) as Affected by the Addition of Sweet Cassava (Low cyanide, Manihotesculenta) Flour
 Abstract
 Reference
 Full-Text PDF
 Full-text HTML
Danbaba N.1, Ukwungwu M.N.1, Maji A.T.1, Ndindeng S.A.2, Jiya A.G.3, Danfulani S.3, Onyeneke E.N.4
1National Cereals Research Institute (NCRI), Badeggi, PMB 8, Bida, Niger State, Nigeria
2Africa Rice Center 01 BP 2031, Cotonou, Benin
3Department of Science Laboratory Technology, Federal Polytechnic, Bida, Niger State
4Department of Food Science and Technology, Faculty of Agriculture and Veterinary Medicine, Imo State University, Owerri
Correspondence to: Danbaba N., National Cereals Research Institute (NCRI), Badeggi, PMB 8, Bida, Niger State, Nigeria.
| Email: |  |
Copyright © 2014 Scientific & Academic Publishing. All Rights Reserved.
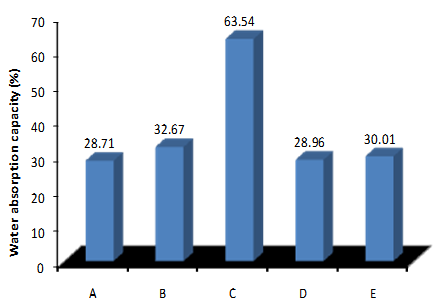
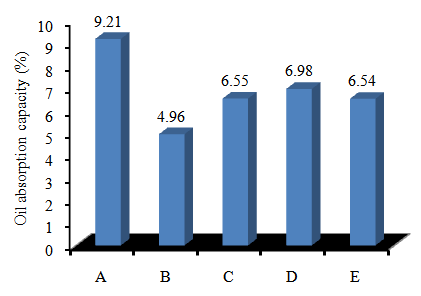
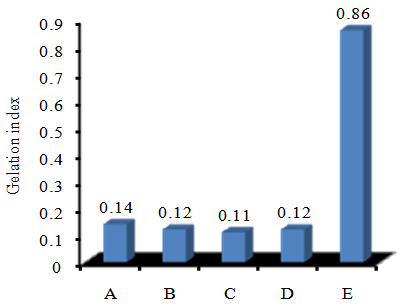
End-use quality of upland NERICA 1 (WAB-450-1-B-P38-HB) rice flour as affected by the addition of 5 to 20% sweet cassava flour were evaluated. Functional characteristics, viscosity profile, proximate composition and consumer acceptability test of ‘Tuwonlaushi’ prepared from the blends were determined. Results indicated that WAI varies between 28.77 and 63.54%, while OAI were significantly (p=5%) lowered when cassava flour was added and ranged between 4.96 at 20% cassava flour to 9.21% in 100% rice flour. GI significantly (p= 0.5) ranges from 0.11 in 10% cassava flour formulations to 0.86 in 5% cassava flour formulations. PT for 100% cassava flour and rice flour were 54.38 and 56.33℃ respectively. The PV value increase with increase cassava flour substitution between 116.75 and 134.75 RVU for 5% and 20%. FV ranged between 182.08 RVU (5% cassava flour) and 199.33 RVU (20% cassava flour). Moisture content of the different formulations were not significantly different (p=0.05) ranging from 0.16% to 0.28% with an average of 0.23%. The protein content of the rice-cassava blends were significantly (p=5%) lower than the whole rice flour, ranging from 10.90% in 100% rice flour to 5.49% in 20% substitution. Consumer ratings indicated high ranking for 10, 15 and 20% formulation in this order indicating detectable effect of cassava flour addition in ‘tuwonlaushi’ production. Correlation studies indicated a significant (p=5%) negative correlation between moisture content and emulsion capacity (-0.96**) and bulk density (-0.97**) of the blends and positive correlation (0.96**) between protein and caloric value, indicating positive contribution of protein to overall metabolizible energy value of the formulations. The variation in functional and pasting properties and nutritional properties is an indication of possible multi-dimensional end-use which rice flour mixed with cassava flour could be subjected to at different ratios that could be of benefit for both domestic and industrial applications.
Keywords: Rice, Cassava, Pasting viscosity, Proximate composition, Functional characteristics, End-use
Cite this paper: Danbaba N., Ukwungwu M.N., Maji A.T., Ndindeng S.A., Jiya A.G., Danfulani S., Onyeneke E.N., End-use Quality of Upland NERICA Rice (Oryza sativa L) as Affected by the Addition of Sweet Cassava (Low cyanide, Manihotesculenta) Flour, International Journal of Agriculture and Forestry, Vol. 4 No. 3, 2014, pp. 237-245. doi: 10.5923/j.ijaf.20140403.16.
Article Outline
1. Introduction
- Nigeria has experienced rapid growth in per capita rice consumption during the last few decades, increasing from 5kg in the 1960s to 25kg in the late 1990s and currently stands at 30kg and 40kg among rural and urban dwellers respectively. Although, rice ranks fourth behind major staples like sorghum, maize and cassava in terms of the overall volume of food consumed in Nigeria, it is the fastest growing source of food consumed in the country. From 1980 to date, Nigeria has immerged to become the highest producer of rice in West Africa and third in Africa, after Egypt and Madagascar. The trend has made Nigeria to attain 2.103 and 3.46 million metric Tons (MMT) of milled rice production in 2005 and 2008 respectively. Rice is used in different forms for the preparation of diverse recipes in Nigeria. However, one of the challenges facing the rice sector is poor post-harvest technical system. Significant quality losses are recorded during rice processing due to poor processing techniques and machineries. Experts suggested value addition to low quality broken rice as a strategy for improvement in the short term and upgrading local mills for the long term.During rice milling, broken rice is produced which reduced the quality of the resulting product and therefore used for the production of flour. Rice flour (also called Michiko in Japanese and Pirinçunu in Turkish) is a form of flour made from finely grounded milled rice [29]. There has been increased industrial application of rice flour as ingredients in gels, puddings, ice cream and baby formulations because of their nutritional, hypoallergenicity, colorlessness and bland taste [30]. But native rice flour has been reported to have low resistance to shearing force and poor elastic gel-forming abilities and therefore have marked tendency to loss their viscosity and thickening power during cooking [24]. Rice flour obtained from high amylose, low gelatinization temperature and high gel consistency varieties have been shown to be suitable for pastry production. While low amylose varieties has low potential for extruded products [20, 26, 27]. In commercial practices rice flour is either chemically modified or combined with other flours to improve its end-use qualities and this practice is attracting significant research effort [24, 25].Viscosity is one of the major characteristics of rice flour that is important in determination of its processing behavior. Vast information exists on the behavior of rice starch during processing into different food products. Lopez et al.,[28] reported on the mixture of rice flour, corn and cassava starch in the production of gluten-free white bread; Tiboonbun et al., [23] investigated the effect of replacing rice flour with unripe banana flour for noddle production; while Surojanametakul and others [22] investigated the effect of partial replacement of rice flour with other crop starch on the physicochemical and sensory characteristics of some SenLek noodles; but little or no information exist on the properties of NERICA (New Rice for Africa) rice flour especially those produced in Nigeria and these properties when blended with sweet cassava flour. Cassava, also called yuno, mogo, manioc, mandioca is popular root crop in the tropics and plays a significant role in food security of the poor. Nigeria is the World’s highest producer and is classified as either sweet or bitter depending on the levels of anti-nutritional or cyanide factors [9]. The bitter variety has received greater attention over the years because of its versatile application and adaptation to marginal climate conditions, while the sweet type received little attention. Nevertheless, cassava flour is low in protein, which is a disadvantage in its wide scale use in bakery and snack foods. Fortification with protein sources, cereals and legumes will certainly expand the spectrum of cassava flour utilization in the food industry.The New Rice for Africa has been spreading rapidly since its introduction in 1996 and has been reported to be responsible for significant growth in yield in several countries in sub Saharan Africa. But further spread is being hampered by lack of readily available scientific literatures on its nutritional characteristics, food applications as well as the recommended production practices. To facilitate information dissemination the African Rice Center (AfricaRice) compiled available information in 2008 and publish as NERICA: a compendium. But little or no information are available on flour behavior and related effect with other flour. Accordingly, this study was designed to evaluate the end-use quality in terms of functional and viscosity profiles of NERICA rice flour blended with sweet cassava flour. Results of this study we believe will be useful in understanding quality attributes of food prepared from the blends and improve on the utilization of NERICA in value-added product development.
2. Materials and Methods
2.1. Materials
- NERICA 1 (WAB-450-1-B-P38-HB) released in Nigeria as FARO 55 was obtained from the Breeding unit of the National Cereals Research Institute (NCRI), Badeggi, Nigeria. 5kg of paddy rice was dehulled with laboratory test sample Sheller (Satake Corporation, Japan) and the brown rice milled in McGill No. 2 Mill. Milled rice was then grounded in an attrition mill (locally manufactured in Nigeria) and flour sieved (30 mesh size) to obtain fine rice flour. While sweet cassava was obtained from the Bidamodern market Niger State. Edible grade cassava flour was prepared by washing, peeling and slicing into 0.5cm chips, followed by sun drying and powdering. The flour was sieved (30 mesh size) to obtain fine grade sample. Flour was sealed in a polyethylene packs and stored in a refrigerator until required for analysis. Composite flour was obtained by mixing rice flour with cassava flour at different proportions. The blending ratios were 95%, 90%, 85%, and 80% of rice flour to 5%, 10%, 15% and 20% cassava flour. All the analysis was conducted at the Rice Grain Quality Laboratory of NCRI and Analytical Laboratory of the International Institute of Tropical Agriculture (IITA), Ibadan Nigeria.
2.2. Methods
2.2.1. Water and Oil Absorption Capacity
- The water and oil absorption capacities were determined by the method described by Jisha et al., [10].1.0g of the blended flour was mixed with 10 ml distilled water (for water absorption) or refined vegetable oil (for oil absorption), at ambient temperature (30±4℃) for 30 min and centrifuged (REMI 412 LAG) for 10 min at 2000rpm. Water or oil absorption capacity was expressed as percent water or oil bound per gram of the sample.
2.2.2. Bulk Density
- The bulk density was determined according to the method described by Jisha et al., [11]. 50g of flour was measured into a 100 ml graduated cylinder and tapped 20-30 times on a laboratory desk. The bulk density was calculated as weight per unit volume of sample.
2.2.3. Foaming Capacity
- Forming capacity was determined as described by with Jisha et al., [11] slight modifications.1.0 g was measured and added to 50 ml distilled water at room temperature in a graduated cylinder. The suspension was mixed and then shaken for 5 min to foam. The volume of foam after whipping for 30 sec was expressed as foaming capacity.
2.2.4. Emulsion Activity
- 1 g sample, 10 ml distilled water, and 10 ml soybean oil was used to form emulsion in a calibrated centrifuge tube. The emulsion was centrifuged (REMI 412 LAG) at 2000 × g for 5 min. The ratio of the height of the emulsion layer to the total height of the mixture was calculated as the emulsion activity expressed in percentage [11].
2.2.5. Pasting Viscosity
- Viscosity of rice-cassava flour blends were measured using Rapid Visco Analyzer (RVA) (Newport Scientific Pty Limited, Australia). 3g of sample and approximately 25g distilled water was used to mixed the flour and the temperature was gradually increased to 50℃ after immersing the spindle and held at this temperature for 1 min, then increased further to 95℃ in 3.5 minutes; held for 2.5 min; cooled back to 50℃ in 3.5 min; and held for 5 min. The instrument provides the following parameters; peak viscosity (PV) (highest viscosity during heating process), trough viscosity (TV) (hold) (the lowest viscosity during heating, and final viscosity (FV) (the viscosity at the completion of the heating circle) and the breakdown viscosity (BV) calculated as PV minus TV, while setback viscosity (SV) determined by subtracting PV from FV. Peak time (PT) (the time at which peak viscosity was recorded) and the Pasting temperature (PT ℃) (the temperature at which starch granules begin to swell and gelatinize due to water uptake). The viscosity was expressed in terms of Rapid Visco Units (RVU), which is equivalent to 10 centipoises [17].
2.2.6. Proximate Composition Determination
- The proximate composition of rice-sweet cassava flour blends for moisture and total ash was determined by the method described by Kadan et al. [21]. Nitrogen was determined by the micro Kjeldahl method and the nitrogen content (N %) was converted to protein by multiplying by a factor of 6.25. Crude lipid content was determined using Soxhlet apparatus and carbohydrate content was determined by difference. Energy (caloric value) was calculated by the method described by FAO [9]. All the proximate composition values were reported in percentage.
2.2.7. Sensory Evaluation
- Acceptability test was conducted on cooked thick dough (tuwonlaushi) prepared from the various formulations by 20 untrained panelists. They were asked to evaluate the samples according to their liking in terms of terms of color, texture, smell, taste, consistency, moldability and overall acceptability using a 9-point hedonic scale: score 9-extreme like and score 1-extreme dislike.
2.2.8. Statistical Analysis
- Data generated in all the determinations were subjected to analysis of variance (ANOVA) using CROPSTAT for window (Version 7.2.2007.3, International Rice Research Institute, Manilla). The significant means were compared using Least Significant Difference (LSD) test at 5% level of probability as described by Gomez and Gomez [18]. While graphs were plotted using Microsoft Excel version 2010 (Microsoft Cooperation, USA).
3. Results and Discussions
3.1. Functional Characteristics
- End-use quality methodology can be categorized as those procedures that determine product physical, functional, chemical and sensory properties. Functional properties of food largely determine the end-use quality of particular formulation as food ingredients [12]. Functional properties of food material may be classified according to the mechanism of action on three main groups. These groups are (1) properties related with hydration (absorption of water/oil, solubility, thickening, wettability); (2) properties related with the protein structure and rheological characteristics (viscosity, elasticity, adhesiveness, aggregation and gelling), and (3) properties related with the protein surface (emulsifying and foaming activities, formation of protein-lipid films, whippability) [15]. In this study, functional properties related to hydration of rice starch are water and oil absorption indices. Water absorption capacity (WAC) varies between 28.77% and 63.54% (Fig.1). The highest value was recorded at rice-cassava flour blend of 85:15. Kinsella [15] and Jideani [12] reported that WAC is an important functional attributes considered in the development of ready-to-eat food from cereal grains, since high WAC might improve product cohesiveness. The higher WAI observed in the 85:15 formulations could be attributed to the presence of higher amount of hydrophilic constituents as a result of the addition of cassava starch [2]. The result of this study is slightly lower than the 65-78% range reported by early workers on complementary blend of soybean and cowpea with malted maize.
 | Figure 1. Effect of the addition of cassava flour on WAC of rice flour |
 | Figure 2. Effect of the addition of cassava flour on OAC of rice |
 | Figure 3. Effect of cassava flour on gelation of rice flour |
 | Figure 4. Effect of addition of cassava flour on bulk density of rice flour |
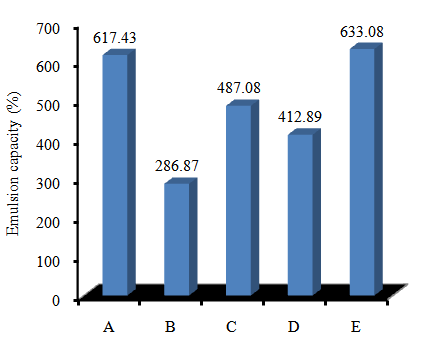 | Figure 5. Effect of addition of cassava flour on emulsion capacity of rice flour |
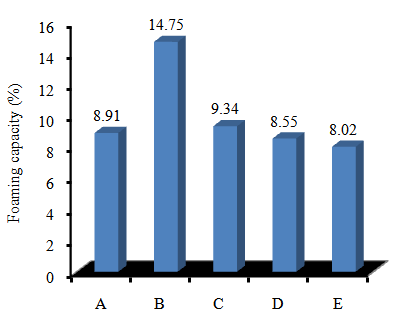 | Figure 6. Effect of the addition of cassava flour on foaming capacity of rice flour |
3.2. Pasting Viscosity
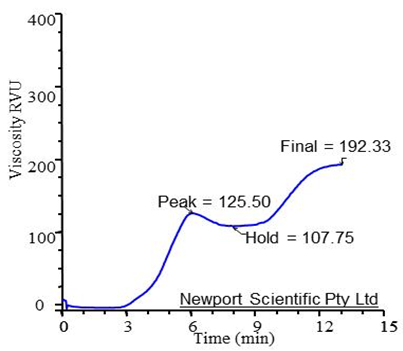
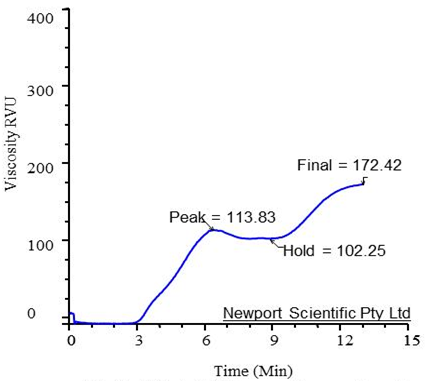
- The Rapid Visco Analyzer (RVA) is a recording viscometer that measures pasting viscosity of flour-water suspension during heating and cooling and all the viscosities measured in Rapid Visco Unit (RVA) which is equivalent to 10 centipoise. The classification of cereal-based flour on its viscosity profile (Fig. 7-12) is important in categorizing the flour for end-use recommendation [17] and considered an important attributes of food as it affect mouth feel (Regina and Chen, 2009).The pasting viscosity of sole sweet cassava flour and rice flour are presented in Fig. 7 and 8 respectively. Peak viscosity (PV), trough (hold) viscosity (HV) and final viscosity (FV) for cassava flour is 147.63, 121.89 and 230.63RVU respectively, while rice values are 139.58, 118.50 and 211.08 RVU respectively. In general, root and tuber flour and starches exhibit high viscosity profile than cereals, although, their starch retrograde easily [13]. Similar trend are reported in this study. These tendencies may be as a result of weaker associative intra-granular forces between root and tuber starch or flour granules which result in gelatinization at relatively low temperature, with rapid and uniform swelling of granules. Pasting temperature (PT) for 100% cassava flour and rice flour were 54.38 and 56.33℃ respectively. PT is one of the pasting properties of flour or starch which provide an indication of the minimum temperature required for sample gelatinization. It is also an indication of energy costs involved and other component stability [17]. High PT is an indication of starch granule resistance to swelling. In this study, the PT gradually decreases as cassava flour percentage substitution increases (Fig. 7-12). This is in agreement with the findings of Craig et al. (1989). Akinwande et al., [32] reported that food materials with lower pasting temperature value are generally considered to be easier to cook. However, Newport scientific [14] reported that low pasting temperature is often associated with low paste stability, which is usually considered to be undesirable end-use property. On the contrary, Bhattacharya, et al., [19] reported variability in pasting temperature of different rice cultivars, suggesting that variation is varietal specific and probably less dependent on the starch or flour modification.
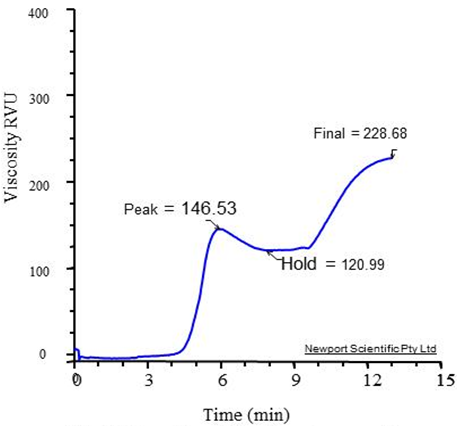 | Figure 7. Viscosity profile of sweet cassava flour |
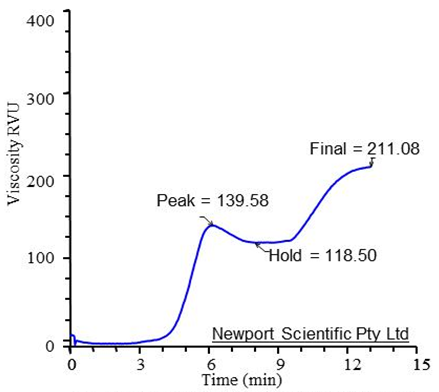 | Figure 8. Viscosity profile of NERICA cassava flour |
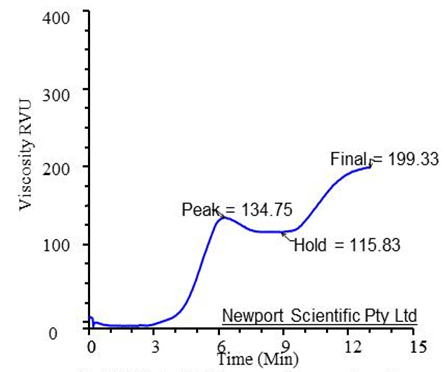 | Figure 9. Effect of 20% cassava flour on viscosity profile of NERICA rice flour |
 | Figure 10. Effect of 15% cassava flour on viscosity profile of NERICA rice flour |
 | Figure 11. Effect of 10% cassava flour on viscosity profile of NERICA rice flour |
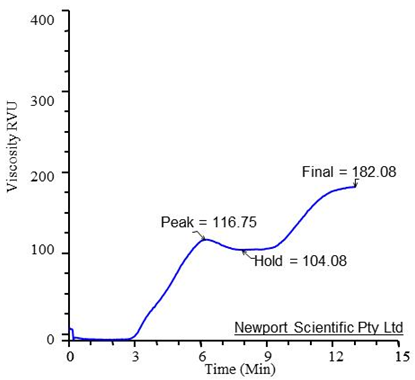 | Figure 12. Effect of 5% cassava flour on viscosity profile of NERICA rice flour |
3.3. Proximate Composition
- The proximate composition which is an indication of nutritive value of food matrix is presented in Table 1. This include, moisture, protein, fat, ash, fiber, carbohydrate and caloric values. The moisture content of any food substance to a greater extend determined its keeping and end-use quality. In rice, moisture content of a whole grain has been reported to affect cooked rice palatability. In this study, the moisture content of the different rice flour-cassava starch formulation was not significantly different (p≤0.05) ranging from 0.16% to 0.28% with and average of 0.23%. Though no significant difference was observed among the blends in terms of moisture contents, a slight increase may be observed as the ratio of cassava starch increase. This may be due to equilibration of flour moisture content and the atmospheric moisture.
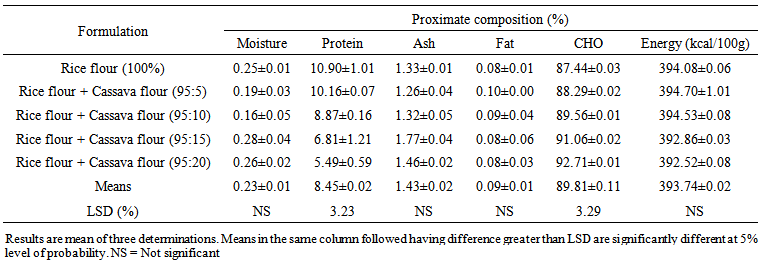 | Table 1. Proximate composition of different proportions of rice-cassava flour blends |
3.4. Consumer Acceptability Test
- Mean consumer rating of ‘liking’ for taste, texture, smell, color, consistency, moldability and overall acceptability of ‘tuwonlaushi’ a common traditional stiff porridge made from rice flour are presented in Table 2. All the sensory characteristics evaluated showed significant difference (p˂0.05) between whole rice flour products and rice-cassava blend. Overall, consumer liked all the samples (rating greater than 6 on the average. Phang and Chan [7] reported that rating higher than 6 (like slightly) for hedonic ratings based on 9-point hedonic scales implies that the product tested is well-liked by the consumers. Consumer ratings indicated high ranking for C, D and E in this order in terms of overall ranking (Table 2), indicating detectable effect of cassava flour addition in ‘tuwonlaushi’ production.
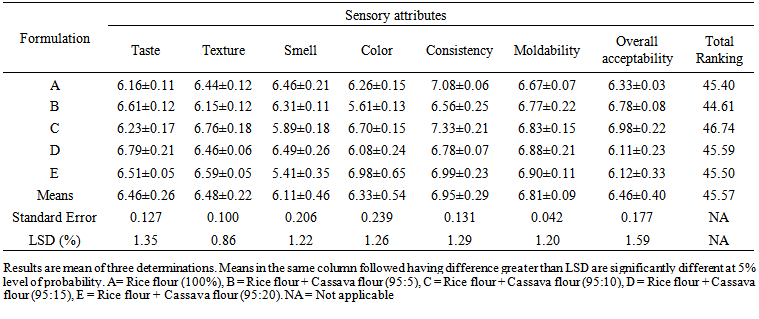 | Table 2. Consumer preference analysis of stiff dough (tuwonlaushi) made from rice-cassava flour blends |
3.5. Correlation Studies between Chemical Composition and Functional Qualities of Flour Blends
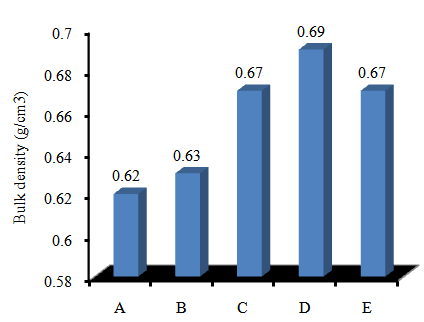
- Correlation studies between proximate composition and functional characteristics of rice-sweet cassava flour formulation are presented in Table 3. There was a significant (p=5%) negative correlation between moisture content and emulsion capacity (-0.96**) and bulk density (-0.97**) of the blends. This indicates significant reduction in the two properties with increasing moisture value. Significant positive correlation (0.96**) was observed between protein and caloric value, indicating positive contribution of protein to overall ME value of the formulations. While negative correlation (-0.96**) was seen between fat and OAC (Table 3).
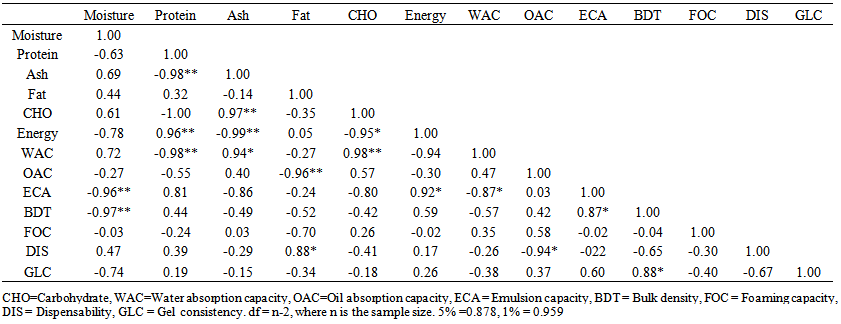 | Table 3. Correlation coefficients among chemical and functional characteristics of rice-sweet cassava flour blends |
4. Conclusions
- This study has revealed that the addition of up to 20% cassava flour to rice flour significantly improves its functional attributes. The differences record in the proximate composition, functional characteristics, pasting properties and sensory attributes of rice-cassava flour mix indicate that nutritional variation may occur when food is prepared from the two blends. The significant variation in functional and pasting properties indicated possibilities of multi-dimensional use which rice flour mixed with modified cassava flour could be subjected to at different blend ratios that could be of benefit for both domestic and industrial applications. Consumer liking also improves with addition of cassava flour to rice flour in the preparation of stiff dough. End-use quality of the rice flour blended with cassava flour therefore is enhanced and we recommend that economic loss due to high broken rice resulting from poor milling operations could be improve through flour production and substitution with cassava flour.