-
Paper Information
- Next Paper
- Previous Paper
- Paper Submission
-
Journal Information
- About This Journal
- Editorial Board
- Current Issue
- Archive
- Author Guidelines
- Contact Us
International Journal of Agriculture and Forestry
p-ISSN: 2165-882X e-ISSN: 2165-8846
2014; 4(3): 154-165
doi:10.5923/j.ijaf.20140403.02
Optimization of Rice Parboiling Process for Optimum Head Rice Yield: A Response Surface Methodology (RSM) Approach
 Abstract
 Reference
 Full-Text PDF
 Full-text HTML
Danbaba N. 1, I. Nkama 2, M. H. Badau 2, M. N. Ukwungwu 1, A. T. Maji 1, M. E. Abo 1, Hauwawu H. 1, K. I. Fati 3, A. O. Oko 4
1Rice Research Programme, National Cereals Research Institute, Badeggi, PMB 8, Bida, Niger State, Nigeria
2Department of Food Science and Technology, University of Maiduguri, PMB 1069, Maiduguri, Nigeria
3Department of Food Science and Technology, Federal University of Technology, Minna, PMB 65, Minna, Nigeria
4Department of Biotechnology, Ebonye State University, PMB 053 Abakaliki, Ebonye State, Nigeria
Correspondence to: Danbaba N. , Rice Research Programme, National Cereals Research Institute, Badeggi, PMB 8, Bida, Niger State, Nigeria.
| Email: |  |
Copyright © 2014 Scientific & Academic Publishing. All Rights Reserved.
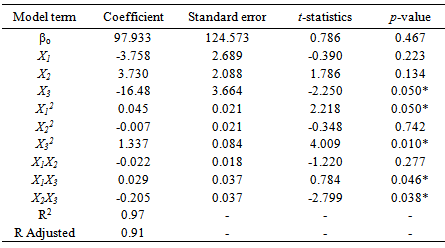
In Nigeria and other countries of West Africa, traditional rice parboiling is still widely practiced among rice processors, resulting in low head rice recovery and inferior grain quality. A new parboiling technology was introduced to improve the milling yield and quality of local rice. We use Response Surface Methodology (RSM) involving central composite design (CCD)to study the effects of soaking temperature (50, 60, 70℃), steaming time (30, 40, 50min) and drying time at 32±2℃ (for 10, 15 and 20hr) on the head rice yield (HRY) of parboiled rice (FARO 44). The research was conducted at the National Cereals Research Institute, Badeggi, Nigeria. Results indicated that regression coefficient of the developed model was significant (F-value 16.33 and p-value 0.003) indicating that most of the variation in head rice yield can be explained by the regression model. Drying time (X3), quadratic coefficients of X1, X3 and interaction coefficients of X1X3 and X2X3 were also significant (p≤0.05). Coefficient of regression R2 and adjusted R2 were 0.97 and 0.91 respectively indicating appropriateness of the model equation in predicting head rice recovery when the three processing variables are mathematically combined. The mathematical optimization results obtained were as follows, X1 = 76.82℃, X2 = 23.18min and X3 = 11.70hr. Under this condition, the HRY was predicted to be 78.89%. From the results of this study it can be concluded that RSM and CCD can adequately model rice parboiling processing for maximum head rice recovery and model deduced defined the degree of influence of each of the studied variables on the response variable and therefore can be used to optimize parboiling process for optimum whole grain recovery.
Keywords: Rice parboiling, Head rice yield, Response surface methodology, Central composite design
Cite this paper: Danbaba N. , I. Nkama , M. H. Badau , M. N. Ukwungwu , A. T. Maji , M. E. Abo , Hauwawu H. , K. I. Fati , A. O. Oko , Optimization of Rice Parboiling Process for Optimum Head Rice Yield: A Response Surface Methodology (RSM) Approach, International Journal of Agriculture and Forestry, Vol. 4 No. 3, 2014, pp. 154-165. doi: 10.5923/j.ijaf.20140403.02.
Article Outline
1. Introduction
- Among the worldwide-cultivated cereals, rice (OryzasativaL.) is one of the leading food crops of the world and it is a staple food of over approximately one-half of the world population and several efforts are being coordinated in order to maintain the grain quality of this crop in its different production and processing unit operations. Significant portion of world rice industry are engaged in rice parboiling and milling. Majority of population in developing countries of Asia and Africa consumes parboiled rice. About one-fifth of world’s rice harvest is parboiled [2]. In Nigeria about 90% of the total rice consumed is parboiled. Parboiling is a hydrothermal process in which paddy is deliberately allowed to absorbs water and later steamed to gelatinize the starch in the endosperm before drying and milling. The process changes the starch structure from amorphous form and hardens the endosperm, making it translucent. The hardening process makes the grain tough and increases its resistance to breakage during milling operation, resulting in improved head rice yield. It also increase grain resistance to insect attack and improve it nutritional quality.However, parboiling have also been reported to produces some undesirable effects, for instance, parboiling of paddy at high temperature the long steaming time generally produces a dark colour and harder product [2] [27]. These products fetch lower price in the market. In addition, parboiled rice has a peculiar smell and taste and requires longer time to cooked than un-parboiled rice [26].Traditionally, paddy parboiling process involves soaking in cold water overnight or longer and followed by boiling or steaming the soaked paddy to gelatinize the starch. Usually, the steamed paddy is cooled and sun dried before milling. During rice parboiling using this method, significant quality loss is recorded [47] and to improve this setbacks, improved technique using hot water for soaking and steaming using vessel having false bottom has been introduced to rice processors in Nigeria. Soaking of paddy is one of the essential steps in parboiling and is objectively carried out to achieve quick but uniform hydration. Uncontrolled soaking results in leaching loss, development of off-flavour due to microbial fermentation, kernel bursting and colour change may also occur. Appropriate soaking therefore depends on time and temperature of the soaking water. Increase in soaking water temperature reduces soaking time [34]. Theoretically soaking of paddy in modern parboiling technology is carried out at a temperature below its gelatinization temperature (73-86℃) [36]. If soaked in water at ambient temperature of between 20 to 30℃, it will take about 36 to 48hr for paddy moisture to reach 30% optimum level required for parboiling. During hot water soaking, paddy absorbs moisture faster and reaches a level of around 30 to 35% in two to four hours. Large volume of literatures on rice parboiling processes and quality of resulting products has been reviewed [32]. [7] reported on the effects of soaking temperature on the physical, chemical and cooking properties of parboiled fragrant rice, [46] highlighted effects of steaming process on the milling characteristics of some indica rice varieties, while the drying kinetics of parboiled rice was reported by [1] reported on the effects of varying parboiling conditions on the physical qualities of some popular rice varieties in Ghana. Effects of parboiling on the glycaemic index of rice particularly those of high and intermediate amylose content has been reported by [29] while, [27] and [31] reported effects of parboiling variables on the quality of milled rice. General agreement is that starting soaking at temperature above 70℃, and allowing the batch to cool naturally ensures the fastest possible hydration without significant negative impact on rice grain quality. The general process of paddy soaking, steaming and drying therefore require optimization and precise control for the advantages of rice parboiling to be maximized [33] [7].The market and economic values of rice is based primarily on its head rice yield (HRY, the proportion of kernels greater than 75% of intact length) and improving HRY is an on-going goal for rice research and development especially in countries of sub-Saharan Africa. The milled rice yield (MRY) represents the mass of milled rice expressed as a percentage of the original dried rough rice mass. Typical MRYs range from 68% to 72%. Upon removal of broken grain, only head rice remains. The weight of head rice, expressed as a percentage of the original rough rice weight, is defined as the head rice yield (HRY) and may vary from 0, where all kernels are broken to a theoretical maximum of approximately 70% (no kernels are broken). Milling quality is often expressed as a ratio of the HRY to the MRY [19] [20] [18]. The percentage of broken grains produced during rice milling are the results of immature, chalky, or fissured kernels, poorly parboiled paddy all of which are weak and typically break during milling due to the forces imparted to kernels in order to remove bran. Since broken fractions are only worth approximately 60% of the value of head rice, HRY directly determines the economic value of a rice lot. Several factors during rice production and processing can affect milling quality. Such factors are generally manifested as individual kernel strength reduction, which ultimately determines the ability of the kernel to withstand the rigors of hulling and bran removal without breaking. Fissured kernels typically break during milling and drastically reducing HRY [18] [19].The focus of the current work was to explore the feasibility of obtaining high HRY from a given quantity of paddy using Response Surface Methodology by carefully and simultaneously adjusting the processing variables of soaking temperature, steaming time and drying duration. Optimization of process conditions is one of the most critical steps in the development or improvement of a bioprocess [17]. In an optimization procedure, we studied the response of statistically designed combinations of independent process variables, estimate their coefficients by fitting the experimental data to a response functions, predict the response of the fitted model and check its adequacy. RSM has been used to study the individual and combined effects of processing variable on quality of resulting products [8] [9] [16] [17] [21] [41]. RSM is a powerful mathematical model with a collection of statistical techniques in which interactions between multiple process variables (independent variables) can be examined with fewer experimental tests. It is widely used to optimize process variables, model developing, condition optimization for an efficient and more economic production processes [17] [36] [37]. The traditional method of studying one variable effect at a time can be effective in some cases, but it will be more useful to consider combine effects of possible variable controlling a biological or physical processes. The RSM which is based on statistical principles, can be used as a tool to implement process improvement strategy that will drive optimal head rice yield from a given paddy lot by performing a minimal number of experiments. Optimization of process using RSM in combination with factorial experimental design of central composite design is essential for fitting a quadratic surface, which work well for process optimization [21-25]. In the present study, optimization of paddy parboiling conditions (soaking temperature, steaming time and drying time) using RSM for maximum head rice yield in a popular rice variety in Nigeria have been carried out.
2. Materials and Methods
2.1. Rice Materials
- Raw material used in this study is rice (FARO 44) one of the most popular rice varieties in Nigeria and are commonly parboiled and milled in most of the rice mills was obtained from the breeding laboratory of the National Cereals Research, Badeggi, Nigeria. It was manually cleaned to remove stones and other impurities. Cleaned samples were packaged in a paper bag and stored in a cardboard at room temperature (32±2℃) until required for experiment.
2.2. Laboratory Parboiling Method
- A laboratory water bath with temperature regulation of ±2℃ was used for soaking rice grains before steaming to produce parboiled rice. Replicate 500g of the rice sample was put in a cloth bag and tied loosely before placing inside the soaking water bath. For each soaking time, three of such bags are placed inside the water bath. The temperature of the soaking water was maintained at the desired level and time and samples taken at every experimental interval for steaming in a locally fabricated steaming vessel. After steaming, the rice grains were dried on a tray in an oven set at 34±2℃, as this is the average temperature for rice drying in most communities in Nigeria [4]. A laboratory model rubber roll rice sheller (THU 35B, Satake Engineering Corp. Tokyo, Japan) with a capacity of 50kg/h was used to de-husk the 500g of parboiled rice grains. The husk and brown rice were separately collected and weighed. The HRY percentage was calculated using the following formula:
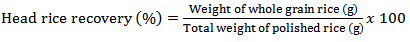 | (1) |
2.3. Experimental Design and Statistical Analysis
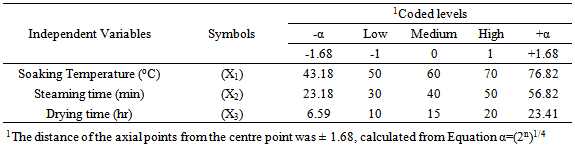
- For the purpose of this study, RSM combined with central composite design (CCD) was adopted for the optimization of rice parboiling process variables to enhance high head rice recovery. Since there are large numbers of variables controlling the quality of the parboiled rice, some mathematical models are required to represent the process. However, these models have to be developed using only significant parameters influencing the parboiling process rather than including all the parameters. In order to achieve this, the data were subjected to analysis of variance (ANOVA). Response surface methodology and second-order Central Composite Design (CCD) for three-variables (soaking temperature X1, steaming time X2, and drying time X3), five level combination coded value -1.68, -1, 0, +1, and +1.68 as modelled by Snedecor and Cochran [43] was adopted to determine the effects of the independent variables on the head rice recovery of parboiled rice. The experimental data obtained from the CCD model experiments can be represented in the form of the following equation:
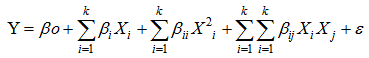 | (2) |
 | (3) |
2.4. Test for Significance of the Regression Model
- The significance of the model was tested by performing an ANOVA test by estimating the F-ratio, which is the ratio between the regression mean square and the error mean square. The F-ratio, also called the variance ratio, is the ratio of variance due to the effect of a factor (in this case the model) and variance due to the error term. This ratio is often used to measure the significance of the model under investigation with respect to the variance of all the terms included in the error term at the desired significance level, α. A significant model is desired [15].
2.5. Test for Significance for Individual Model Coefficients
- Checks were additionally carried out in order to determine whether the model actually describes the experimental data [44]. The checks performed in this study include the determination of the various coefficient of determination, R2 (R2 have values between 0 and 1). Secondly, the adequacy of the model was also investigated by the examination of residuals [14]. The residuals are the difference between the respective observe responses and the predicted responses and is examined using the normal probability plots of the residuals and the plots of the residuals versus the predicted response. If the model is adequate, the points on the normal probability plots of the residuals should form a straight line. On the other hand the plots of the residuals versus the predicted response should be structure less, that is, they should contain no obvious patterns [14] [44].
2.6. Surface and Contour plotting
- 3D response surface plot was plotted by different combinations to two test variables at one time and maintaining the other variable at zero level. The 3D plot is a graphical representation of the regression equation, and is often plotted to aid the understanding of the interaction of the independent variables and locate the optimal level of each variable for maximum response. A contour plot has lines or curves of constant response values drawn on a graph or plane whose coordinate axis represents the levels of the independent variables and the response is visualized perpendicular to the plane of the paper. Series of the contour plots of equal responses were generated which provided useful information in interpreting contribution of the response [10-11]. As three variables are considered in the rice parboiling process, the value of one variable was fixed to obtain the contours. The non- variant parameters were therefore set at optimum level and a new relationship was developed and plotted between the dependent and independent variables [10].For statistical calculations, the variables Xi (the real value of the independent variable) were coded as xi (dimensionless value of independent variable) according to the following equation:
 | (4) |
3. Results and Discussion
3.1. The Central Composite Design and Model Development
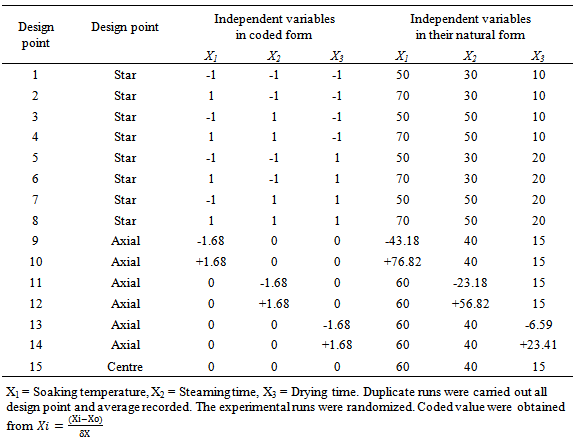
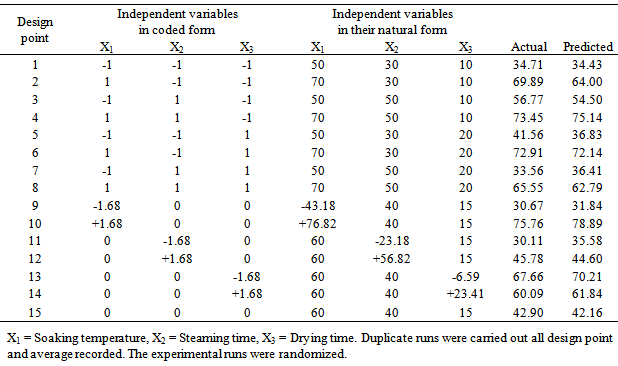
- Parboiling of paddy consists of soaking in cold or hot water, steaming and subsequently drying of the rough rice before milling. Reasons often given for paddy parboiling is to maximizeHRY, improve nutritional value and resistance to spoilage by insects and mould during storage. In this study, the factors affecting the HRY during the parboiling of paddy was studied using CCD experiments. The soaking temperature, steaming time and drying temperature were chosen as the independent variables, each at three levels and their interactions on HRY determined. Twenty experiments based on CCD were conducted with different combinations of the variables and the results presented in Table. Adopting surface response methodology, a polynomial model was developed to predict over a wide range the effect of the drying conditions on quality variable (equation 4).Table 1 shows the three independent variables (X1, X2 and X3) and their different coded and actual values as employed in the design matrix. RSM was employed in identifying the linear and interactive effects of parboiling variables for high HRY. On the basis of the CCD, there were four important stages adopted for the optimization of the experiments: [i] to perform statistically designed experiments for the experimental plan, [ii] recommend the mathematical model basis of the experimental data and focus on the data of analysis variance, [iii] control the efficiency of the model directly with diagnostic plots, and [iv] estimate the response and verify the model [21]. The number of experiments required [N] is given by the expression: 2k [23 = 8; star point] + 2k [2x3 = 6; axial point] + 6 [centre points; 6 replications].The polynomial equation proposed model for the HRY was regressed by only considering significant terms. The equation is shown in equation [5]:
 | (5) |
|
|
3.2. Statistical Significance and Verifications of the Model
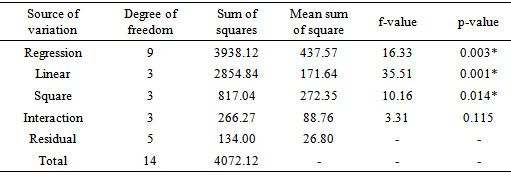
- The analysis of variance for the response variable is given in Table 3. To evaluate the goodness of a model in predicting a response, the coefficient of variation (CV) (the ratio of the standard error of estimate to the mean value expressed as percentage) and F-value test has to be performed. The Fishers F-distribution is a probability distribution used to compare variance by examining their ratio. If they are equal, then F-value would equal one. The F-value in the ANOVA table is the ratio of model mean square to the appropriate error mean square. The larger the ratio, the larger the F-value and more likely is it that variance distributed by the model is significantly larger than random error [13]. From Table 3 it is observed that the model regression coefficient is significant [F-value 16.33 and p-value 0.003]. The large f-value reported for the model coefficient indicates that most of the variation can be explained by the regression equation [25] [40]. The linear and square terms of the equation were also significant (p≤0.05). From the ANOVA table therefore, we can conclude that the selected model adequately represent the data for HRY obtained from a given lot of paddy.
|
|
|
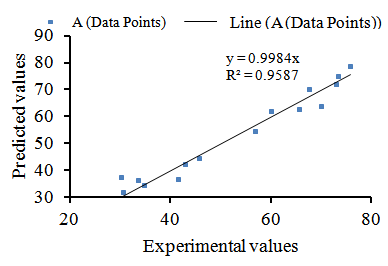 | Figure 1. Parity plot showing the distribution of experimental verses predicted values of percentage head rice yield |
3.3. Residual Analysis to Check the Regression Assumptions
- The residual plots are a function of the difference between observed responses and those predicted by the model and often plotted to check wither the regression assumptions are violated. Fig. 2 is the normal percentage probability plot of the residual, while Fig. 3 is a plot of residual verses the fitted values. The data points in the normal percentage probability plot forms a linear graph, indicating that neither response transformation was required nor there was any apparent problem with normality assumption of the regression model [21]. The residuals versus fits plot should look like a random scatter of data as seen in Fig. 3. If the plots are not showing a random scatter of data, as being represented in Fig. 3, then patterns within them will indicate problems with the assumptions. In this study, the studentized residuals verses run order plot show a randomly scattered points spread around 0without an obvious shape being made by this points indicating that the assumption of the errors having mean zero and equal variance have not been violated [6]. This was an indication of better fit for both the models with the experimental results [8].
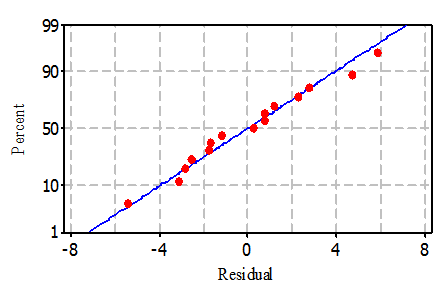 | Figure 2. Normal probability plot of the residuals |
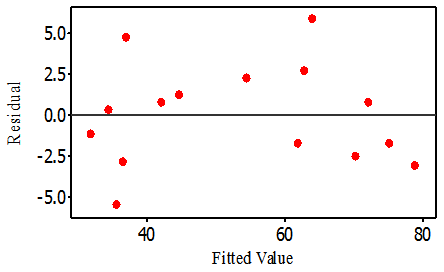 | Figure 3. Plot of residual versus fitted values |
3.4. Interactive Effects of Independent Variables on HRY
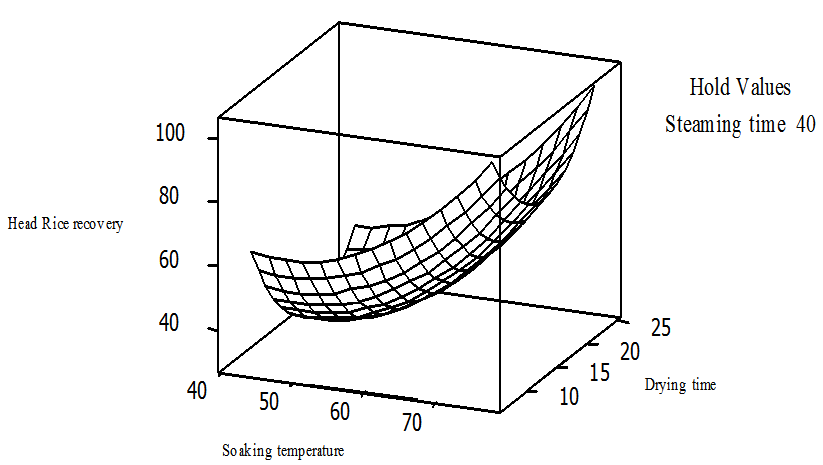
- To understand the effect of each of the three independent variables and their interaction on the HRY, three dimensional (3D) plots were designed for the estimation of the responses, which was the bases of the model polynomial function for analysis to investigate the interactive effect of any two factors on the HRY within the experimental range [21] [45-46]. Each response plot is plotted by different combinations of two test variables at one time while maintaining the other variable at zero level [11]. As indicated in Fig. 4, the soaking temperature and steaming duration have considerable influence on the extent of whole grain yield of parboiled rice. Figure 4 indicate that increasing soaking temperature from 44℃ to slightly above 75℃ and steaming the soaked grain for about 50 minutes increases HRY significantly.
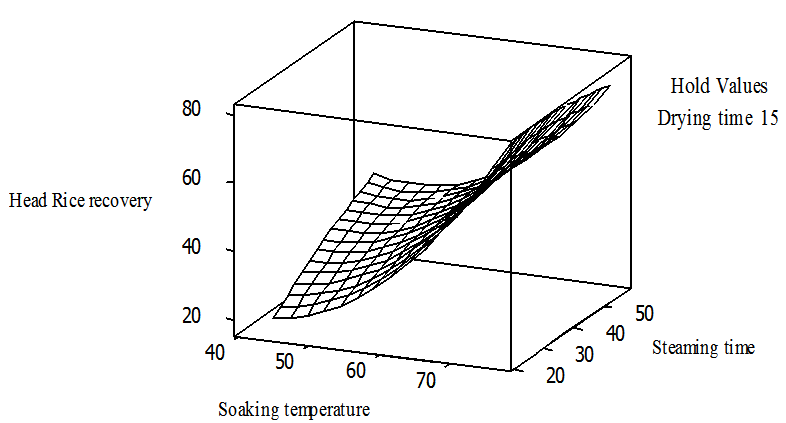 | Figure 4. Response surface plot head rice yieldvs steaming time and soaking temperature holding drying time at 15hr |
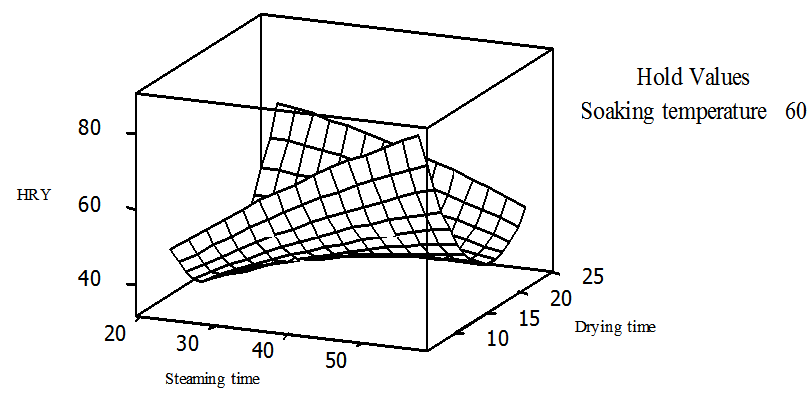 | Figure 5. Surface plot of head rice recoveryvs drying time and steaming time, holding soaking temperature at 60℃ |
 | Figure 6. Surface plot of head rice recoveryvs drying time and soaking temperature, holding steaming time at 40℃ |
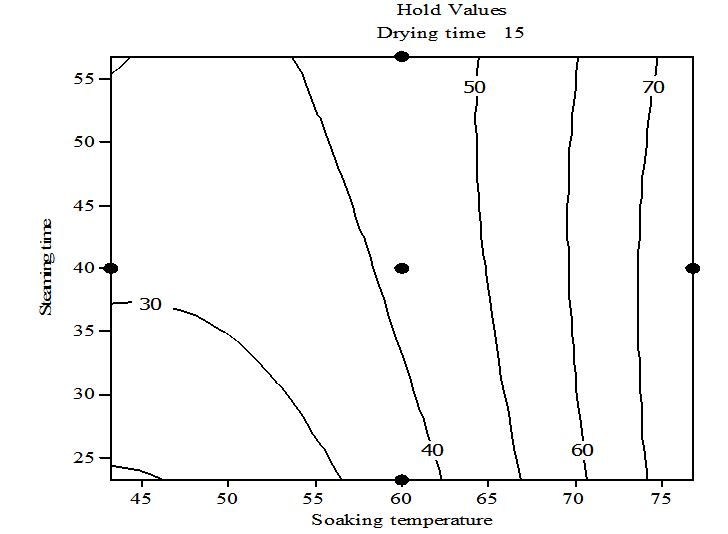 | Figure 7. Contour plot of head rice recoveryvs steaming time and soaking temperature, holding drying time at 15hr |
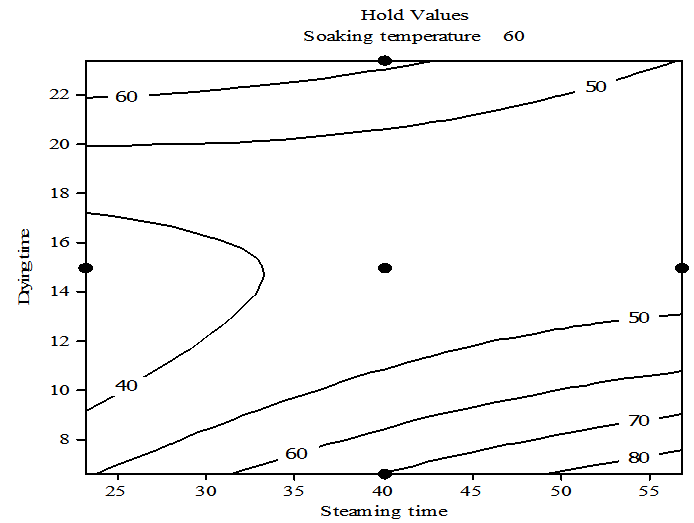 | Figure 8. Contour plot of head rice recoveryvs drying time and steaming time holding soaking time at 60℃ |
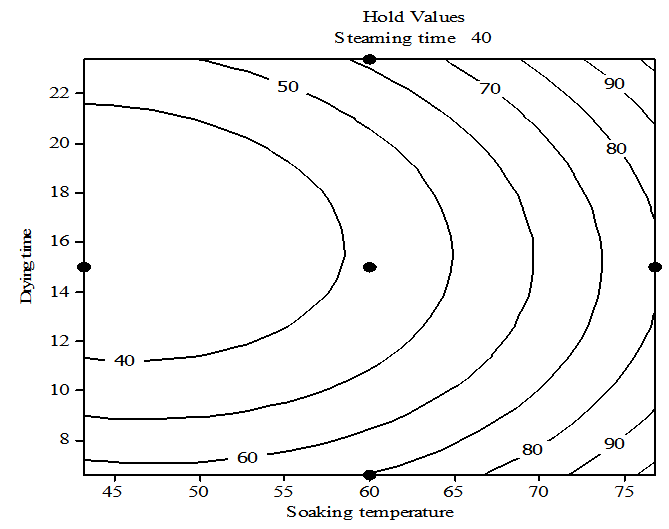 | Figure 9. Contour plot of head rice recoveryvs drying time and soaking temperature, holding steaming time at 40℃ |
3.5. Numerical Optimization of Process Conditions
- The main objective of the current research was to find the optimum process variables for maximizing head rice recovery of parboiled rice. Mathematically, for a process to be optimized, a target must first be set based on the response data obtain when the experimental tests were run [9] [12]. In this study, the optimization was done with the following targets:I. Percentage broken grain should be minimum II. Percentage head rice should be maximumIn order to optimize the process conditions therefore to obtain optimum whole grain, the first partial derivative of the regression model developed is equated to zero based on X1, X2 and X3 respectively. The results obtained were as follows, X1 = 76.82℃, X2 = 23.18min and X3 = 11.70hr. Under this condition, the HRY was predicted to be 78.89%.
4. Conclusions
- From the results of this study it can be concluded that RSM and CCD can adequately model rice parboiling processing for maximum head rice recovery and model deduced defined the degree of influence of each of the studied variables on the response variable and therefore can be used to optimize parboiling process, it can also be said that optimal head rice recovery from a given lot of paddy can be obtained when carefully parboiled under the following conditions: soaking temperature of 76.82℃, steaming time of 23.18min and drying at ambient temperature of 11.70hr. In that case parboiling technologies for the improvement of the competiveness of locally processed rice can take advantage of these results to optimize it processing variable to maximize whole grain recovery.
ACKNOWLEDGEMENTS
- The authors would like to thank the National Cereals Research Institute (NCRI) Badeggi, Nigeria for granting financial support for this project and to Africa Rice Centre (AfricaRice) for providing equipment through the AfricaRice / CIDA/NCRI Project on improving rice postharvest system. We will also like to express our gratitude to Mr. Monday Bako of the Rice Processing and Grain Quality Laboratory of NCRI for his help during the milling and grading of the experimental samples.