-
Paper Information
- Next Paper
- Previous Paper
- Paper Submission
-
Journal Information
- About This Journal
- Editorial Board
- Current Issue
- Archive
- Author Guidelines
- Contact Us
International Journal of Agriculture and Forestry
p-ISSN: 2165-882X e-ISSN: 2165-8846
2013; 3(7): 339-348
doi:10.5923/j.ijaf.20130307.13
Grey Systems Analysis of Chinese Rubber (Hevea brasiliensis)- Tea (Camellia sinensis)- Chicken Agro-forestry Ecosystems
 Abstract
 Reference
 Full-Text PDF
 Full-text HTML
Qingyan Meng1, 2, Zewei Miao3, Zhaoqian Wang4
1Institute of Remote Sensing Applications, Chinese Academy of Sciences, Beijing 100101, China
2Center for Spaceborne Remote Sensing Demonstration, National Space Administration, Beijing 100101, China
3Department of Agricultural and Biological Engineering, University of Illinois at Urbana-Champaign, 1304 West Pennsylvania Avenue, Urbana, IL 61801, USA
4Agro-Ecology Research Institute, Zhejiang University, Hangzhou 310029, China
Correspondence to: Zewei Miao, Department of Agricultural and Biological Engineering, University of Illinois at Urbana-Champaign, 1304 West Pennsylvania Avenue, Urbana, IL 61801, USA.
| Email: |  |
Copyright © 2012 Scientific & Academic Publishing. All Rights Reserved.
In the past centuries, traditional agricultural systems have long provided essential food, goods and livelihood security throughout the world. Systems and informatics analysis of a traditional farming ecosystem model is essential for to develop the farming ecosystem model. In the present paper, grey correlation analysis was conducted to investigate the driving mechanism of the Rubber-Tea-Chicken (RTC) agro-forestry model and its impacts on the whole regional ecosystems at various phases. A grey model GM (1,1) was created to predict developing trends and driving forces of the RTC agro-forestry model. Results showed that the driving forces and correlations of the RTC ecosystems structure and components varied at different developing stages. At the RTC establishing and developing stages, the major driving forces for the ecosystems were crop production, forest industry and livestock production. At the RTC stable stage, crop and livestock production were the two major driving components for the regional ecosystem outputs. Based on the GM (1,1) predictions, sideline and fishery productions had greater impacts on the whole ecosystem at the forecast stage. The predictions of the grey model GM(1,1) provide a reference to optimize structure, function, service and sustainability of the whole regional social-economic ecosystems.
Keywords: Farming System Management, Grey Correlation Coefficient, GM (1,1), Driving Mechanism, Crop and Forest Industry, and Livestock-sideline-fishery Production
Cite this paper: Qingyan Meng, Zewei Miao, Zhaoqian Wang, Grey Systems Analysis of Chinese Rubber (Hevea brasiliensis)- Tea (Camellia sinensis)- Chicken Agro-forestry Ecosystems, International Journal of Agriculture and Forestry, Vol. 3 No. 7, 2013, pp. 339-348. doi: 10.5923/j.ijaf.20130307.13.
Article Outline
1. Introduction
- With rapid increase of the world population, global demand for agricultural ecosystem productive function and ecological services is increasing and may continue to do so for decades. The demand is particularly strong for China due to its largest population and the rapid growth of regional economy. Land reclamation, farming system expansion and intensive management of existing agro-ecosystems via fossil fuel energy input such as fertilization, irrigation and pesticide application increase agro-ecosystem productivity and output to meet such demand. However, those practices may also cause negative ecological and environmental impacts (Miao, 2001; DeFries et al., 2004; Swinton et al., 2007; Miao et al., 2011; Butler et al., 2012). For instance, land reclamation and over-expansion of farming systems can cause soil erosion, fragment wildlife habitat integrity and threaten biodiversity. An over-use of fossil fuel energy in agricultural ecosystems (e.g., pesticide, fertilizer and irrigation) increases global greenhouse gas (GHG) emission, pollutes surface and ground water, and severely damages terrestrial and aquatic ecosystems (Tilman et al., 2011; Xie et al., 2011). Agro-ecosystems are the providers and recipients of ecosystem services which extend beyond the provision of food, fiber and fuel (Swinton et al., 2007; Moonen and Bàrberi, 2008; Galic et al., 2012). Historically, traditional agricultural systems have contributed to food, goods and livelihood security throughout the world, particularly for the long standing societies of China, Egypt, India and Indonesia (Feng, 1992; Li et al., 1999; Miao et al., 2011; Xie et al., 2011). In China, the traditional farming systems usually are multi-layered combinations and/or plantings of numerous crop species in line with (or varieties) with or without integration of agroforestry and animal-raising. In other words, traditional agricultural ecosystems usually are featuring by the harmonious bio-diverse structure, co-existing food web (or food chain), dual-win species ecological niche, indigenous ecosystem management schemes (e.g., irrigation, fertilization, animal and aquaculture), and ingenious microclimate regulation. The traditional agricultural ecosystems have provided not only goods such as food, fuel and timber and economic income for farmers, but also ecological services such as soil erosion prevention, agricultural biodiversity, farmer’s self-employment and recreation, landscape aesthetic beauty and ecosystem resilience (Koohafkan and Altieri, 2011). For example, Chinese rice-fish polyculture exploited synergies between species to dramatically reduce the need for chemical inputs while sustaining high and stable grain production (Xie et al., 2011; Lansing and Kremer, 2011). In 2002, the United Nations Food and Agriculture Organization launched a program to recognize “globally important agricultural heritage systems (GIAHS)” (Lansing and Kremer, 2011). So far, ten systems and pilots have been included in the program (UN-FAO, 2011). One of the GIAHS program’s goals is to discover whether the heritage farming systems could contribute to innovations in sustainable agriculture at the global scale by examining the ecological interactions between ecological components. Systems modeling and informatics analysis of the structure, function and services of a traditional farming system model are essential to improve and extend the farming ecosystem model (Nelson et al., 2009; Miao et al., 2011; Miao and Miao, 2012). Structure and function of a traditional agricultural ecosystem depend upon not only local landscape, soil and weather conditions, but also social culture, life style and economic development. To understand the whole-spectrum structure and function of a traditional ecosystem model, an emphasis should be placed on component natural niche, biological productivity, economic profits and social service of the ecosystems. In China, for instance, there are dozens of traditional farming system models including paddy rice (Oryza sativa)–fish, white mulberry (Morus alba L.)–fish, corn (Zea mays L.)–string beans (Phaseolus vulgaris L.), rubber (Hevea brasiliensis)-tea (Camellia sinensis)-chicken (RTC), crop–pig poultry–biogas energy for combustion or lighting, etc. (Lu, 1993; State Environment Protection Administration of China, 1995; Li et al., 1999; Miao and Wang, 1999; Miao et al., 2011; Meng et al., 2012). However, most of the research literature only concentrated on natural characteristic and function of an ecosystem model including ecosystem biodiversity, landscape patch and fragment, species niche, carbon sequestration, ecosystem productivity and nutrient dynamics (Wang et al., 1996; Wang; 1997; Zhang et al., 1998; Meng et al., 2000; Meng and Wang, 2001, Miao et al., 2011). Some literature is limited to qualitative description and analysis. Few studies focus on driving forces/factors and mechanism of a conventional farming system model and cause-effect relationships between the conventional ecosystem model and its ambient regional ecosystem. The objective of this study was to investigate driving forces and mechanism of the rubber-tea-chicken (RTC) agro-forestry model and impacts on its surrounding regional ecosystems at county level. In the paper, grey system theory was employed to disclose dynamic grey correlations between the RTC model and the entire regional farming systems. This study provides a paradigm for systems and informatics analysis of structure and function of a farming system model and facilitates the applications of a traditional farming system model to regional sustainable agriculture.
2. Materials and Methods
2.1. Grey Systems Theory
- Grey systems theory is a multidisciplinary theory dealing with grey systems in which part of information is certain (i.e., the white part) and part of information is uncertain (i.e., the black-box part). Grey systems theory puts each stochastic variable as a grey quantity that changes within a given range and deals directly with the original data and searches the intrinsic regularity of data (Deng, 1988; Gau et al., 2006; Mao and Chirwa, 2006; Yan and Yang, 2009). Grey systems theory does not attempt to find the unique and perfect solution, but rather intends to provide techniques for determining a variety of appropriate and available solutions for real world problems (Deng, 1988; Gau et al., 2006; Yan and Yang, 2009). It has been successfully applied to various areas of our social lives, e.g., application of grey correlation method to optimize groundwater recharge sites (Deng, 1988; Gau et al., 2006; Mao and Chirwa, 2006; Yan and Yang, 2009). Grey correlation analysis and the grey forecasting model GM (1,1) are two of the fundamental elements of grey systems theory.
2.1.1. Grey Correlation Analysis
- Grey correlation analysis is commonly used to determine the degree of close relationship on the base of geometric similarity between the reference sequence and comparison sequence. The basic idea of grey correlation analysis was to judge similarities of sequence curve’s geometric figures, i.e., the relevance of the corresponding sequences. The more similar the curves, the more correlated the corresponding sequence of the ecosystem variables. Otherwise, the correlation was thought to be minor (Deng, 1988; Gau et al., 2006; Yan and Yang, 2009). Grey correlation analysis mainly includes the following five steps (Deng, 1988; Gau et al., 2006; Li, 2008; Yan and Yang, 2009): (i) The reference sequence (
 ) of the target data and the sequence (
 ) for comparison data in the ecosystem, where i=1, 2,…, m, z=1, 2,…, n, n is the length of the reference sequence and must be ≥ 4; (ii) Data transformation to the new reference and comparison sequences:
  and
and  , where i=1, 2,…, m, and z=1, 2,…, n.(iii) Calculations of the sequence of deviation (
 ) of the reference sequence (
 ) from the sequence (
 ) for comparison:
  , where i=1, 2,…, m, and z=1, 2,…, n.(iv) Calculations of the absolute maximum (∆max) and minimum (∆min) differences between the transformed reference and comparison sequences:
  and
and , where i=1, 2,…, m, and z=1, 2,…, n.(v) Calculations of the grey correlation coefficient (
 ):
): , where
  is an identification factor, the
  value can be approximated to be 0.5, i=1, 2,…, m, and z=1, 2,…, n. (vi) The grey correlation grade (
 ) is an average of the grey correlation coefficients and is defined as:
  , where i=1, 2,…, m, and z=1, 2,…, n (Deng, 1988; Gau et al., 2006; Yan and Yang, 2009).
2.1.2. The Grey Model GM (1, 1)
- The grey forecasting model GM(1, 1) is a time series single variable first-order differential model. The grey model GM(1, 1) does not seek for statistics law and probability distribution, but probes the law from original dimensionless data to form regular time sequence data with original data processing. That is, the GM(1,1) model does not require any statistical assumptions. Previous literature showed that predictions of GM(1,1) are of high repeatability in trends including high reliability and efficiency (Mao and Chirwa, 2006). The grey model GM(1, 1) model can be constructed by establishing a first order differential equation of the accumulation generation operation (AGO) (
 ) via the following steps (Deng, 1988; Mao and Chirwa, 2006):(i) Organize the initial time sequence
 ,where
  is the original time series data at time i, n is the length of the initial time sequences and must be ≥4.(ii) Develop the new time sequenceThe new time sequence
  is created through the accumulated generating operation of
  to weaken variation tendency:
  , where z=1, 2,…, n.(iii) Derive the first-order differential equationThe first-order differential equation and its difference equation are derived as:
 and
and  where t is the time series variable,
  , α is the developing coefficient and μ is the grey input which can be obtained by the least square fitting method, respectively. The difference equation can also be rewritten as:
  where
where  is the
  background value, and
  .The grey model GM(1,1) is able to well fit equidistance and slow growth time sequences, but often performs very poor for quick growth time sequences (Mao and Chirwa, 2006). To widen the adaptability of grey model GM(1,1) to various kinds of time sequences, the improved equation of background value is then given as:
  , where
  , and
, and  (Deng, 1988; Mao and Chirwa, 2006; Li, 2008). (iv) Applying the ordinary least-square fitting method to the above difference equation, the predictions of
  are approximated as:
  , where
  is the predicted value of
  at time z, and z=2, 3, …, n (Deng, 1988; Mao and Chirwa, 2006).After the completion of an inverse-accumulated generating operation, the predicted value of
 is calculated as:
  , where
  is the predicted value of
  at time z, and z=2, 3, …, n (Deng, 1988; Mao and Chirwa, 2006).As a time series forecasting model, a thorough validation of the grey model GM(1,1) is difficult and usually requires a large of initial data sequence. Prediction accuracy of the grey model GM(1,1) usually were measured by the mean absolute error criterion (
 ):
): , where z=1, 2, …, n. In the study, the grey forecasting model GM(1, 1) is used to disclose the development phase process and predict the response of the dynamic development of the ecosystems. The mean absolute error criterion (
 ) was used to quantify prediction quality of GM (1,1).
2.2. Study Area
- The study area was located in Wenchang city, Hainan province of China at a latitude between 19°20′ and 20°10′ N and a longitude between 110°28′ and 111°03′ E (Figure 1). Surrounded by the sea on three directions, Wenchang city covers 2,488 km2 of land, about 7% of total land of Hainan Province. In 2011, the area includes pasture of 108,000 ha, pasture land of 37,333 ha, arable land of 42,667 ha, fresh water area of 2,667 ha, and waste land of 27,333 ha. Located in the tropical monsoon region, this area has annual sunshine of 1869~2032 hours, solar radiation energy of 451~481 kJ cm-2, and annual precipitation of 1875~2108 mm. The yearly average temperature is 24.2°C with the lowest temperature of 5.7°C. The area has slightly dryer winter and spring, and higher precipitation in summer. The area has six types of soil: paddy fields, red brick clay, tidal sand, coastal salt marsh soil, coastal salt soil and coastal sandy soil. The area is a famous tourist destination with the coastline of 207 km, a large area of mountain ridges and beach (Wenchang City Government of Hainan Province, 1994; Wenchang City Statistics Bureau of Hainan Province, 1996).
 | Figure 1. Study area located at longitudes between 19°20′and 20°10′North and latitudes between 110°28′and 111°03′East |
 | Figure 2. Schematic chart of the Chinese rubber (Hevea brasiliensis)- tea (Camellia sinensis)- chicken (RTC) agro-forestry model |
2.3. The Rubber (Hevea brasiliensis)-Tea (Camellia sinensis)-chicken (RTC) agro-forestry Model and Data Collection
- The RTC agro-forestry model was originated in Wenchang city, Hainan province of China. As a traditional agro-forestry system in Hainan Province, the RTC agro-forestry ecosystem is an intensive farming system that farmers raise chicken in a semi-closed rubber tree (Hevea brasiliensis (Willd.) Muell.-Arg.)- tea(Camellia sinensis (L.) Kuntze) intercropping agro-forestry system. Both of rubber tree and tea are cash plants which can increase farmers’ income. The rubber-tea intercropping systems have a significant higher soil organic matter, higher solar radiation, lower temperature and lesser pest populations like green leaf hopper (Emposa flavescens) than that in pure rubber plantations (Li et al., 1999). Those advantages increase the intercropping system productivity.In Hainan Province of China, the species of “Wenchang” chicken is commonly raised in the farming system model. “Wenchang” chicken is a local well renowned chicken variety with high-quality and delicious meat, high market demand, and supports significant income streams in Hainan Province and even over the county. As an intensive farming ecosystem, the RTC agro-forestry model integrated the modern chicken-raising technology and facilities with traditional farming management practices. The ecosystem model replaced the traditional hen-hatching for chicks with the machine hatching and centralized rearing in warm shelves before chicken was put into a rubber-tea intercropping systems. Then, matured chicken was brought into cages to be fattened. In detail, during the first 30 days after machine hatching, chicks were inoculated and reared in moderate temperature and fed with standard food to ensure high survival rate, strong bone structure and prevention from influenza disease. In the second stage (30-130 days), the chickens were raised in rubber-tea intercropping system to improve meat quality by self-feeding insect of rubber and tea trees. In the third stage (about 130 to 160 days), the mature chickens were fattened in cages to make chicken meat tender and delicious with the optimal balance of fat and protein. By combining centralized hatching, inoculation and feeding technology with conventional agro-forestry feeding practices, the systems could not only shorten the raising duration and reduce feed waste in the conventional way, but also improve the meat quality and sale prices of chicken. Data from 40 families who have developed the rubber-tea-chicken models were collected via questionnaire and on-the-spot consultations. Some local survey data came from agricultural and forestry statistics published by Forest Bureau, Agricultural Bureau and Statistics Bureau of Wenchang City, Hainan Province.
2.4. Grey Correlation and Forecasting GM(1,1) Model of the RTC Agro-forestry Ecosystem
- In accordance with the RTC agroforestry ecological processes stated in section 2.3, the grey system model includes three stages as well, i.e., the establishing, developing and maturing stages. In Wenchang farming systems, the RTC agro-forestry model directly related to the productions of forest, livestock and sideline components of the regional ecosystem. The mutual relationships of ecological components and contributions of an ecological component to the whole ecosystem productivity were determined with a regional-based perennial data. An annual average increment rate of the regional RTC model outputs was used to analyze the dynamic correlations of the ecosystem components. This is because the initial status of the RTC model components was different and developmental rates of the RTC models were heterogeneous spatially and temporally (Table 1).Grey correlation coefficients between the ecosystem components and variables were calculated at different stages of the ecosystems to ascertain interactions between the RTC ecosystem components and variables. In addition to the interactions of each RTC component, in the paper, grey correlation coefficients between an individual component and total regional ecosystem productivity were used to determine the contributions of each component to total regional farming system productions. Finally, the developmental trend of the ecosystem structures and functions were predicted with the GM(1, 1) model and the mean absolute error criterion was used to measure the model prediction accuracy.
3. Results and Discussions
3.1. Growth Rate and Grey Correlation Coefficients of the RTC Model during the Establishing Stage
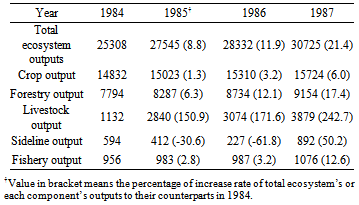
- During the establishing stage from 1984 to 1987, the components of the regional ecosystem did not grow evenly. Livestock output increased with the highest growth rate of 242.7%, followed by 50.2%, 17.4%, 12.6% and 6.0% for sideline, forestry, fishery and crop output, respectively. The growth rate of total ecosystem outputs was 21.4% (Table 1).
|
|
3.2. Grey Correlation Coefficients of Industries during the RTC Developing Stage
- During the developing stage from 1988 to 1991, total ecosystem output and various components’ outputs all increased rapidly except for crop production (Table 3). The growth rate of fishery productivity was as high as 159.2%, followed by livestock with a growth rate of 72.0%, sideline with a growth rate of 39.7%, forestry with a growth rate of 21.1%, and crop outputs with a growth rate of 3.8%. The total ecosystem output grew with the rate of 32.9% (Table 3). In comparison with the establishing stage, there were faster growth rates for fishery, forestry, crop and total ecosystem outputs. Livestock and sideline outputs increased at a slower pace.
|

|

3.3. Grey Correlation Coefficients of Industries during the RTC Stable Stage
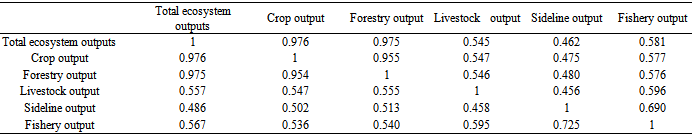
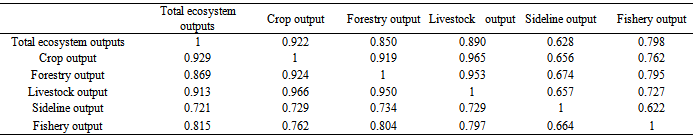
- During the stable stage, except for crop production, all of the growth rates of total ecosystem and its components’ outputs were lower than the counterparts in the developing stages. The growth rate of total ecosystem outputs were increased 28.9% from 1992 to 1996 (Table 5). The growth rate of fishery economic output was 86.8%, followed by crop production, livestock and forest components with the growth rates of 24.3%, 20.6% and 18.5%, respectively. Because of the competitions in resources between fishery and sideline productions, sideline production decreased by 26.8% and 12.2% in 1995 and 1996 respectively after growing by 23% and 47% in 1993 and 1994 (Table 5). However, crop outputs were increased by 24.3%.The correlation coefficients indicated that during the stable stage, the contributions of livestock, sideline and fishery productions to total agricultural output increased significantly (table 6). Although crop production still was the most important contributor to the farming system, the part which crop production took was decreased. The role of forestry in the ecosystem economic output was reduced as well.
|

|
3.4. Grey Models and Forecasting of the Regional total Ecosystem and its Components
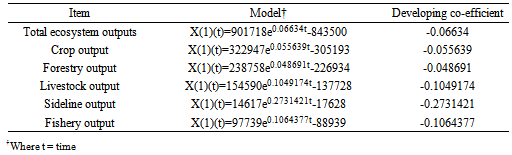
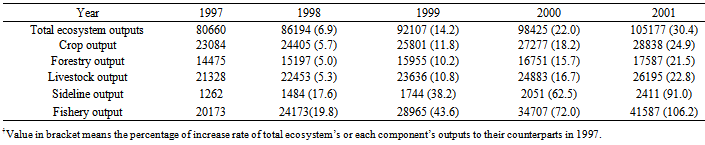
- The grey model GM(1,1) was developed to forecast the developmental trend and dynamic correlations of total regional ecosystem’s and each component’s outputs (Table 7). The developing coefficient of total ecosystem’s and each component’s outputs all were negative and listed in descending order: sideline, fishery, livestock, crop production, forest production, etc. (Table 7). This suggested that the total ecosystem and each component productions still had large developing potentials. The developing potentials of the sideline, livestock and fishery components were greater than others. In other words, with the development of the RTC ecosystem, the sideline, livestock and fishery components would be significantly improved further. An attention should be paid to forestry and crop components to optimize the structure and function of the regional ecosystem model. For instance, fishery and sideline production were forecasted to be increased 106.2% and 91.0% from 1997 to 2001, respectively (Table 8). The growth rate of crop, forest and livestock and gross ecosystem outputs were estimated to range from 21.5 to 30.4% (Table 8).
|
|
|

4. Conclusions
- Through analyzing the reciprocal relationships among the components of the regional RTC agro-forestry ecosystem using grey theory, following conclusions were drawn: (1) The driving forces and correlations of the RTC model and its components varied at various stages. The contributions of each component to the total ecosystems could be determined based on grey correlation coefficients. At the establishing and developing stages, the major driving forces of the model included crop, forest and livestock production components. At the stable stage, crop and livestock production became the two pivotal components of the model outputs, and grey correlation coefficients between crop production, livestock production and forest components were improved significantly. (2) The dynamics of relative indicators of the grey forecasting model GM(1,1), i.e., developing coefficient, could be used to predict the development trend of the RTC model and its components. The GM(1,1) predictions provided a reference guide for farming system managers to optimize structure, function and service of the ecosystems rationally. Further study is required for efficient application of grey correlation theory to management of a traditional complex agro-forestry model and thorough validation of a GM(1,1) model for trend predictions of the complex ecosystems.(3) With the grey GM(1,1) model, the developing potentials of the total ecosystem components could be sequenced in descending order: sideline production, fishery production, livestock production, crop production and forest production. As forest & crop productions were stable, and sideline and fishery productions had greater developing potentials. While maintaining the livestock production stable, forest and crop production, sideline and fishery components should be stimulated to improve the ecosystem productivity in a short term.
ACKNOWLEDGEMENTS
- The authors are grateful to Wenchang City Statistics Bureau and Wenchang City Agricultural Bureau of Hainan Province, China, for their generous support in collecting and surveying field data. Thanks are due to Joshua D. Jochem for help in improving English language of the manuscript.