-
Paper Information
- Next Paper
- Previous Paper
- Paper Submission
-
Journal Information
- About This Journal
- Editorial Board
- Current Issue
- Archive
- Author Guidelines
- Contact Us
International Journal of Agriculture and Forestry
p-ISSN: 2165-882X e-ISSN: 2165-8846
2013; 3(7): 294-302
doi:10.5923/j.ijaf.20130307.06
Determination of Potassium Levels in Intensive Subsistence Agricultural Soils in Nyamira County, Kenya
 Abstract
 Reference
 Full-Text PDF
 Full-text HTML
Kenyanya Omanga, Muthengia Jackson, Mbuvi Harun
Chemistry Department Kenyatta University, Kenya
Correspondence to: Mbuvi Harun, Chemistry Department Kenyatta University, Kenya.
| Email: |  |
Copyright © 2012 Scientific & Academic Publishing. All Rights Reserved.
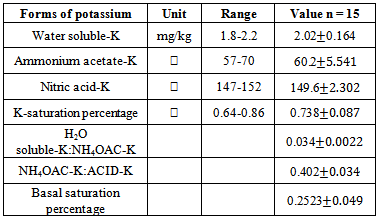
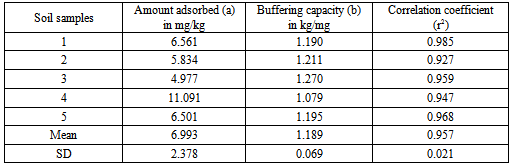
Assessment of potassium levels in agricultural soils of Nyamira County, Kenya was necessitated by the observed progressive drops in maize acreage yields over the years despite use of phosphorus and nitrogenous fertilizers. In the study, concentration levels of potassium and other soil fertility indices such as, organic carbon, cation exchange capacity, exchangeable cations, soil pH, available nitrogen, total and available phosphorus were determined. Five composite soil samples were collected at depths of between 0-30 cm from five farms that have consistently been under intensive cultivation. Fractionation of potassium was achieved by sequential extraction of soil sampleswith distilled water, ammonium acetate and nitric acid in that order. Concentration levels of potassium in the extracts were determined using a flame photometer. Potassium concentration levels obtained from the water soluble soil extracts were used to calculate thermodynamic parameters such as free energy of replacement, potassium activity ratio and ionic strength of the soil solution. The relationship between the adsorbed and equilibrium potassium concentration, quantity/intensity was determined by plotting Freundlich adsorption isotherms. The isotherm was used to determine the buffering capacity ofpotassium and the concentration levels of potassium adsorbed on un-specific sites in the soil. The suitability of the adsorption equation was determined by applying the least square regression analysis. From the study available potassium in the soils ranged from 57 to 70 mg/kg and had amean value of 60.2 mg/kg (ammonium acetate method). The water soluble potassium ranged from 1.8 to 2.2 mg/kg with a mean of 2.02 mg/kg. Nitric acid extracted potassium had a mean of 149.6 mg/kg. The mean free energy of replacement, was found to be indicating that the soils have low supplying power of potassium. The potassium buffering capacity of the soils was found to have a mean of 1.189 mg/kg. The amount of potassium adsorbed on un-specific sites of the soilshad a mean value of 6.993 L/kg. These findingsreveal the extent of potassium depletionin the soils of this region and will form a baseline for working acreage potassium doses required for remediation.
Keywords: Potassium Buffering Capacity, Adsorption, Freundlich Isotherm, Thermodynamics Parameters, Free Energy of Replacement, Soil Fertility Indices
Cite this paper: Kenyanya Omanga, Muthengia Jackson, Mbuvi Harun, Determination of Potassium Levels in Intensive Subsistence Agricultural Soils in Nyamira County, Kenya, International Journal of Agriculture and Forestry, Vol. 3 No. 7, 2013, pp. 294-302. doi: 10.5923/j.ijaf.20130307.06.
Article Outline
1. Introduction
- A major contributing factor to low agricultural yields in developing countries is low soil fertility[1]. This has mainly led to the decline in crop productivity in Kenya[2]. Soil fertility has been declining because of continuous use of the agricultural land without adequate replenishment of utilized nutrients[3] leading to reduction of nutrient stocks in the soil[4]. For instance, it has been reported that an annual depletion of -112 kg N ha-1, -31 kg P ha-1 and -70 kg K ha-1 occurs in Kisii and Western Kenya[5]. This has been attributed to poor agricultural practices that include: removal of crop residue for livestock, overgrazing, burning of stock to ease land preparation, limited usage of inorganic fertilizers, lack of knowledge on types of fertilizer and insufficient information on fertilizer usage[6,7].Potassium is a primary plant and animal nutrient that plays a major role in ensuring maximum growth and economic yields from agricultural farms. Management of potassium and other essential nutrients is key to achieving a balanced fertility program[8]. Potassium plays key roles in several physiological processes such as regulating the uptake of nitrates from soil, balancing phosphorus uptake, strengthening stalks of plants hence helping in resisting fungal and bacterial attacks as well as lodging. Further it promotes the formation of good quality seeds, influences the rate of transpiration, synthesis of carbohydrates, proteins and translocation of the synthesized food. In fact, more than 50 enzymes responsible for energy transfer and formation of sugars, starch and proteins are affected by presence of potassium in plants[9]. However, excess K levels can be harmful to crops by suppressing the uptake of boron and magnesium by plant roots and damages seeds during germination[10].The forms and concentration levels of potassium vary from place to place depending on the degree of mineral weathering and type of parent rock. For example, micaceous clay minerals such as illites and vermiculites can fix potassium to a greater extent than clays with low charge density such askaolinite. The four forms of potassium insoil include solution, exchangeable, fixed (non-exchangeable) and mineral potassiumin theirorder of availability to plants and microbes respectfully[11]. The equilibrium reactions between the four forms determine whether the applied potassium fertilizer is absorbed by plants, leached to lower layers or converted to forms unavailable to plants[12]. The equilibrium constant is important in predicting the levels available and remediation dose requirements.Many researchers have used variety of techniques, equations and mechanistic models in evaluating potassium requirement and availability to crops[13]. The traditional methods used include extraction with 1N ammonium acetate to determine the concentration levels in forms that are available for plant uptake and extraction with nitric acid to evaluate the total concentration levels in the soil. More recently, new techniques that use adsorption isotherms and thermodynamic parameters such as ionic activity, activity coefficient,ionic strength and free energy of replacement todetermine potassium levels and its availability for plant uptake have been reported[14].In Nyamira County, Kenyaan intensive subsistence farming system that ensures maximum utilization of all cultivable land is practiced. In fact, double or even triple planting is done within a single year. Despite this, there is limited information on the available and total concentration levels of potassium in these soils. Further, the farmers have limited themselves to sole use of P and N-fertilizers with the assumption that potassium is a non-limited nutrient in the soils. Therefore this study aims to determine the available and total concentration levels of potassium using thermodynamic measurement as well as ammonium acetate method.
2. Materials and Methods
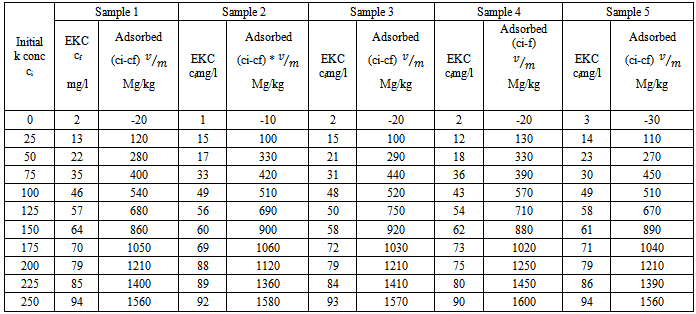
- Experimental siteThe experiments were carried out in Gachuba location of Nyamira County, Kenya. The soils found in the region are mainly classified as nitosol sand are well drained[15]. The area receives a mean annual rainfall of between 1700-1800 mm. Due to its high population density all the land in the region is under cultivation with only very small portion left for pasture. The main crops grown in the area include maize, beans, bananas, sugarcane, coffee, cassava, finger-millets, kales and cabbage.SamplingFive farms that have consistently been under cultivation were identified. From each farm acomposite sample was obtained from the farm’s soil within a depth between 0-30 cm. due to uniform soil characteristics in the area, grid sampling was employed whereby15 to 20 cores (a core is an individual boring or coring spot in a field) were collected from each farm at random with the help of a soil auger. The cores were mixed thoroughly in a clean plastic pail to make composite soil samples. The bulk composite samples were air dried, ground, passed through a 2 mm sieve, packed in clean polythene bags and kept to cool.Laboratory analysisThe physical-chemical parameters of the soil were determined using standard procedures described below. All chemical analysis was done in triplicate. Soil pH and electrical conductivity (EC) of soil pastes (soil to water weight ratio of 1:2.5) were determined using electrical pH and conductivity meters respectively. Total organic carbon was determined using the standard Walkey Black rapid titration method[16]. The concentration levels of phosphorus content were determined using the Olsen method[17] and calorimetric measurement[18]. Nitrogen concentration levels were determined by the Kjeldal method[19]. The concentration levels of potassium in the various forms were obtained by extracting with water, ammonium acetate and nitric acid as described in literature[20] and measurements in extracts done using a flame photometer, 410 Corning model. Adsorption studies2.50 grams of the soil samples were put in 25mL solutions of 0.01M CaCl2 that contained potassium concentrations of 0, 25, 50, 75, 100, 125, 150, 175, 200, 225 and 250 mgL-1 and shaken for 24 hours at 25±1°C to achieve equilibration. The contents were filtered using Whatman filter papers No. 42. The concentration levels of potassium in the filtrate were measured using a flame photometer.Calculations of thermodynamic data Adsorption isotherms were constructed as per the method described by Rowell[21]. The amount of K adsorbed was obtained by subtracting the amount found in filtrate from the initial amount that was in solutions as shown in equation 1.
 | (1) |
 | (2) |
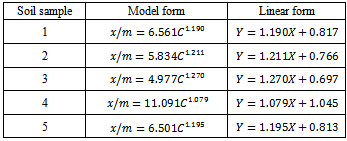
 is the mass of adsorbed Kper unit mass of soil (mgkg-1), C is the equilibrium K concentrations of solutions (mgL-1), a and b are constants obtained from the intercept and slope respectively.The ionic strength in the soil was calculated by a formula proposed by Griffin and Jurinak[23] in 1993 as shown in equation 3.
 | (3) |
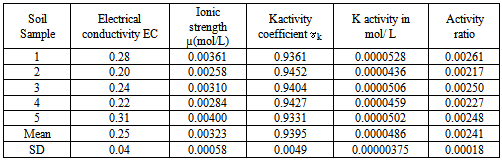
 is the electrical conductivities of soil pastes in mmhos/cmActivities of calcium, potassium and magnesium ions, (ai), in the water extracts were tabulated as the product of their activity coefficients, (fi), and their concentrations, (ci), as shown in equation 4.
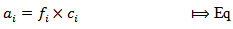 | (4) |
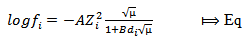 | (5) |
 for water at 298 Kelvin,
  for water at 298 Kelvin,
  = effective size of hydrated ions and
  = Ionic strength of cationThe activity ratio of potassium ions were tabulated using equation 6
 | (6) |
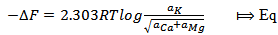 | (7) |
 , T = Absolute temperature at 25
 = 298 K and a = activity of the metal ions.
3. Results and Discussion
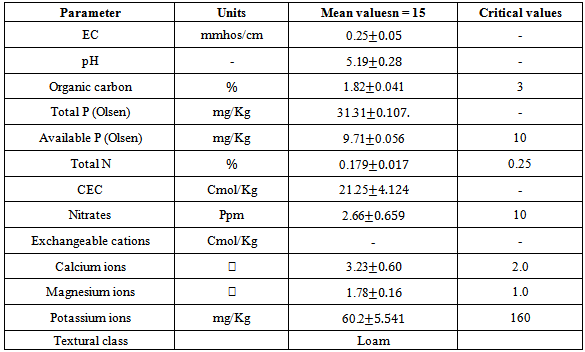
- Basic soil characteristicsThe percentage of the total organic content was found to range between 1.10-2.07% and a mean value of 1.82± 0.41%. This falls within the moderate range that is considered to range from 1.5 to 3.0%. The concentration levels of available phosphorus were found to range from 9.62 mg/kg to 9.77 mg/kg with a mean value of 9.71±0.056 mg/kg.These levels were below the critical level of 10 mg/kg[24]. The low levels of available phosphorus obtained are illustrative of phosphorus insufficiency that is endemic in many of the farms in the region. Phosphorus deficiency in many soils in Kenya is largely due to low occurrence of phosphorus containing minerals and inadequate phosphorus fixation[25]. Concentration levels of total nitrogen content obtained in the study ranged from 0.173-0.196% and had a mean of 0.179±0.017%. This is below the critical levels[8]. Low crop yields due to the low availability soil phosphorus and nitrogen nutrients are expected from these findings in consistence with the FAO, 2004 report[26]. The concentration levels of available potassium obtained from ammonium acetate extracts ranged from 57-70 mg/kg with a mean of 60.2±5.541 mg/kg. The cation exchange capacity of the soil ranged from 17.25-28.05 Cmol/kg with a mean of 21.25±4.124 Cmol/kg. These medium values of cation exchange capacity indicate that the soils can moderately hold nutrients. The soil pH ranged from 4.81-5.61 with a mean of 5.19±0.28 indicating that the soils were strongly acidic. The electrical conductivity which is an indirect measure of total amounts of soluble salts in soil was found to range from 0.20-0.31mmhos/cm with mean of 0.25±0.05 mmhos/cm an indication these soils are non-saline.
|
|
|
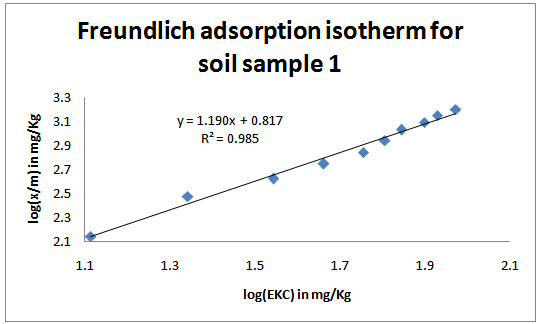 | Figure 1. Freundlich adsorption isotherms for the studied soil sample 1 |
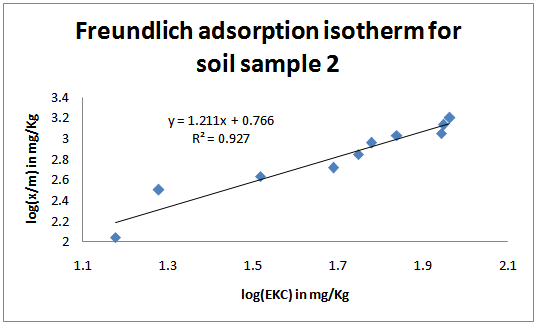 | Figure 2. Freundlich adsorption isotherms for the studied soil sample 2 |
|
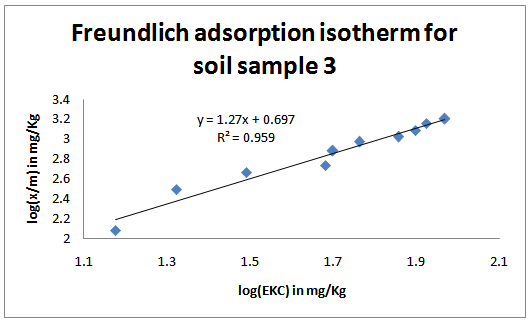 | Figure 3. Freundlich adsorption isotherms for the studied soil sample 3 |
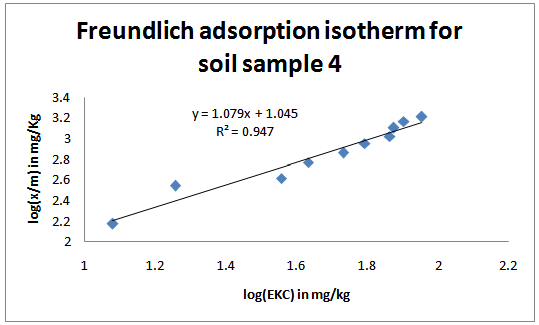 | Figure 4. Freundlich adsorption isotherms for the studied soil sample 4 |
|
|
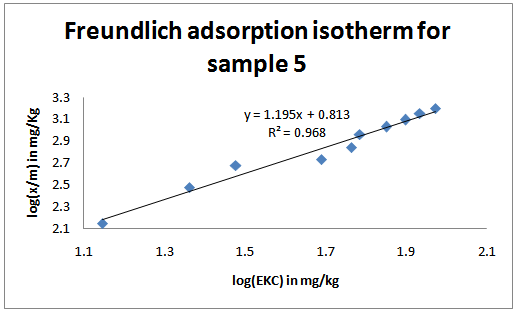 | Figure 5. Freundlich adsorption isotherms for the studied soil sample 5 |
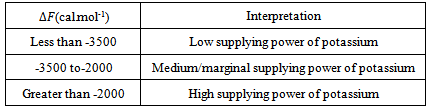
 : The free energy of replacement was tabulated using equation 7. These values are used to classify the supplying power of potassium in soils shown in Table 7[35].According to the table, soils with lower than (
 ) – 3500 cal.mol-1 have poor supplying power of potassium and those with -3500 to - 2000 cal.mol-1 have medium supplying power of potassium. Finally, soils with less than - 2000 cal.mol-1 are poor in supplying power of potassium. The values obtained from our study ranged from -3632 to -3523 cal.mol-1 and averaged to the value -3572±44.98cal.mol-1 as shown in table 8. This implies that the soils had poor supplying power of potassium.
|
4. Conclusions
- From the result, it’s clear that the soils are not only poorly supplied with the various forms of potassium but also with the other basic major nutrients such as nitrogen and phosphorus. Therefore the farmers’ assumptions that potassium is a non-limited nutrient are inaccurate. Thisimplies that addition of considerable amounts of potassium to the soils is required to improve on yields.
|

5. Recommedations
- With the low fertility status of the soils, fertilization is necessary; specifically with potassium, nitrogen and phosphorus fertilizer to boost crop yield. Using this data, optimum potassium acreage dosage for the soils is in progress.
ACKNOWLEDGEMENTS
- The authors give special thanks to Chemistry Department of Kenyatta University and Food Science Department of Jomo Kenyatta University for proving the required apparatus, equipment and technical assistance.