Francis Mwakapuja1, Evaristo Liwa1, Japhet Kashaigili2
1School of Geospatial Sciences and Technology, Ardhi University, P. O. Box 35176, Dar Es Salaam Tanzania
2Faculty of Forest and Nature Conservation, Sokoine University of Agriculture, P. O. Box 3013 Morogoro, Tanzania
Correspondence to: Evaristo Liwa, School of Geospatial Sciences and Technology, Ardhi University, P. O. Box 35176, Dar Es Salaam Tanzania.
| Email: |  |
Copyright © 2012 Scientific & Academic Publishing. All Rights Reserved.
Abstract
This paper address the use of Indices Combination with Supervision Classification methods to extract urban built-up areas, vegetation and water features from Landsat Thematic Mapper (TM7) imagery covering Dar es Salaam and Kisarawe peri-urban areas. The study uses three indices; Normalized Difference Built-up Index (NDBI), Modified Normalized Difference Water Index (MNDWI), and Soil Adjusted Vegetation Index (SAVI) to reduce the seven bands Landsat TM7 image into three thematic-oriented bands. Data correlation, spectral confusion and redundancy between original multispectral bands were significantly reduced upon application of the techniques. As a result, the spectral signatures of the three urban land-use classes are more distinguishable in the new composite image than in the original seven-band image since the spectral clusters of the classes are well separated. Through a supervised classification on the newly formed image, the urban built-up areas, vegetation and water features were finally extracted effectively; with the accuracy of 82.05 percent attained. The results show that the technique is effective and reliable and can be considered for use in other areas with similar characteristics.
Keywords:
Landsat, Indices Combination Supervised Classification, Built-up Areas
Cite this paper: Francis Mwakapuja, Evaristo Liwa, Japhet Kashaigili, Usage of Indices for Extraction of Built-up Areas and Vegetation Features from Landsat TM Image: A Case of Dar Es Salaam and Kisarawe Peri-Urban Areas, Tanzania, International Journal of Agriculture and Forestry, Vol. 3 No. 7, 2013, pp. 273-283. doi: 10.5923/j.ijaf.20130307.04.
1. Introduction
Land-Use and Land Cover (LULC) changes are among the most important factors for environmental change such as deforestation, urbanization and forest degradation ([12]). Urban areas have been enlarging very fast and rates of population growth in urban areas are higher than the overall population growth in most countries. This occurs because urban areas are the locus of economic activities and transportation nodes ([5] as cited in[14]. The urban land changes, referred to as urban sprawl, have effects for the environmental and socio- economic sustainability of communities ([11];[15]). Timely and accurate LULC maps are needed for urban planning and forest management, these maps have to distinguish accurately features of the built environment from vegetation in the area.Expansion of Dar es Salaam and Kisarawe peri-urban areas, within Dar es Salaam City and Coast Region respectively, encroaches on surrounding valuable natural lands such as forest reserves of Pugu and Kazimzumbwi. The increased closeness between developed areas and the forest reserves that usually accompany new development places the forests are at risk of being encroached. In Kisarawe town, built-up areas are located in forest reserve - urban interface areas (see Figure 1) and that situation is likely to worsen as the district population continues to grow ([8]). The timely availability of the data is vital for urban planners and decision makers, but the challenge is most of the data (field survey, aerial photography) are expensive to acquire and time consuming to process. This pose a burden to under- funded and under-staffed local authorities entrusted with urban/rural planning and forest reserve management. Satellite remote sensing technology can be used to over- come these challenges, because it provide consistent and repetitive measurements of the Earth’s surface conditions. Remote sensing imagery can be used to separates urban lands from non-urban lands, but, this may not produce satisfactory accuracy because of spectral confusion of the heterogeneous urban built-up land class. Many studies have been done in combined classification methods to improve the extraction of the urban built-up lands ([14])Transformation enhancement, one of the image - processing techniques, calculates new values for each image pixel, based not only on the values within a particular spectral band but also on some function of values in other spectral bands. Vegetation indices are ratios of bands that are designed to numerically separate or stretch the pixel value of different features in the image. Many indices have been developed that implement various band combinations. They use the distinctive feature of leaf chlorophyll absorption (maximum at about 0.69 μm) and lack of absorption in the adjacent near infrared region (at 0.85 μm) to isolate different features. The outcome is a strong absorption contrast in the 0.65 - 0.85 μm wavelength interval ([4]). Vegetation indices utilises this contrast through the combinations of bands red/near-infrared reflectance. There are a number of vegetation indices, such as the Normalized Difference Vegetation Index (NDVI), that are function of the visible bands of multispectral data and the near infrared bands. It has been determined that these indices often give a very simple and fast interpretation of Landsat satellite data in terms of vegetation health. Likewise, there are other indices using different spectral bands that may be calculated to allow more efficient interpretation of features ([3]) For this study the following indices have been used; Normalized Difference Built-up Index (NDBI), Modified Normalized Difference Water Index (MNDWI), and Soil Adjusted Vegetation Index (SAVI). Using an NDVI-differencing approach, ([5]), extracted urban built-up areas of the Washington D.C. metropolitan area from Landsat images incorporating unsupervised classification and realised accuracy of 85 percent. For example,[13] extracted urban built-up lands of Fuqing, a city in southeastern China, by a combining signature analysis and supervised classification techniques. Based on the analysis of spectral response differences between built land and other classes within multispectral bands, urban land information was isolated and then integrated with a classification layer to generate a final product with accuracy of 85 percent ([13]). Xian and Crane (2005) (cited in[14]) measured urban land expansion of the Tampa Bay watershed of Florida by using a regression tree algorithm to map urban impervious surfaces and an unsupervised classification to reveal related land-cover classes which achieved an accuracy greater than 85 percent. In this study a thematic-oriented Index Combination technique is used to extract 3 bands (urban, build-up areas and vegetation cover) from 7 bands Landsat TM imagery of 2010. The extraction is based on a new 3 bands image derived from three thematic indices applied to Landsat TM imagery. The indices are SAVI, NDBI and MNDWI.The objective of this study was to extract urban built-up and vegetation features of Dar es Salaam and Kisarawe peri-urban area by employing index combination technique and supervised classification method.
2. Materials and Method
2.1. Study Area
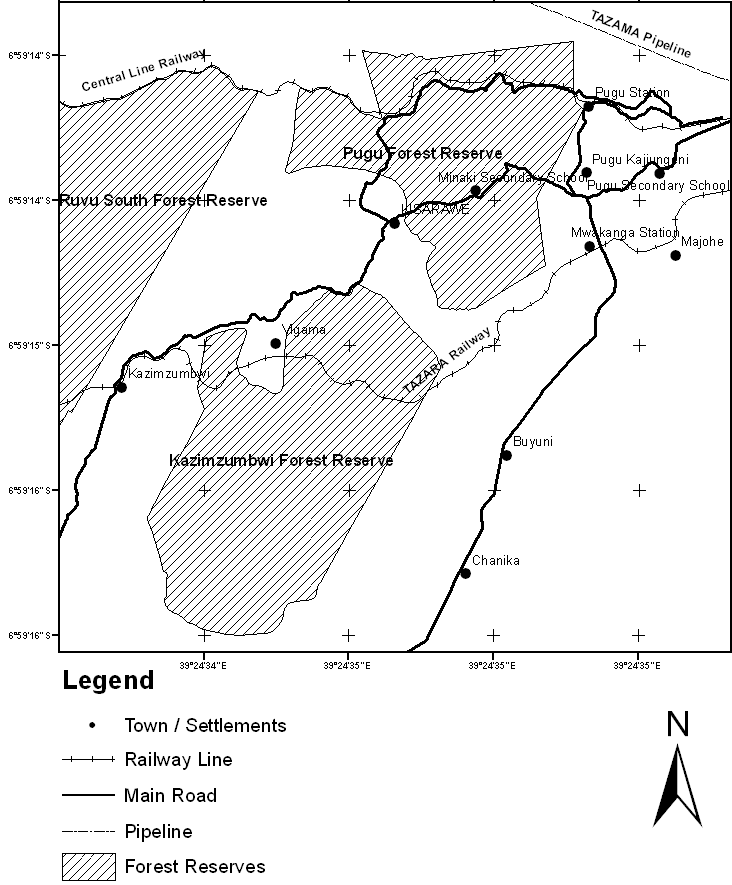
The study area covers about 333 km2 (approximately 33 000 ha), geographically it spans from Longitude 39o 00′ 28′′E to 39o 10′ 50′′E and Latitude 6o 49′ 50′′S to 6o 59′ 18′′S. It includes Pugu and Kazimzumbwi Forest Reserves in Kisarawe District (approximately 20 km from Dar es Salaam City) and part of Dar es Salaam peri-urban area, which includes Pugu Kajiungeni, Chanika and Buyuni neighbourhoods. The study area is depicted on Figure 1 and Figure 2. Kisarawe District population distribution as per the 2002 census was 95,323 while 2005 projection was 101,638 ([8]). The Coast region, in which Kisarawe is located, has the average temperature of about 28oC. The region experiences average annual rainfall ranging between 800 and 1100 mm. Pugu and Kazimzumbwi Forest Reserves are opposite to each other, they are among the oldest coastal forest reserves in Tanzania. This lowland coastal forests are the remnants of a belt of thick forest that covered the east coast of Africa from Mozambique to Kenya more than ten million years ago ([5]), they are among Tanzania’s 83 coastal forests. They were gazetted as protective forest in 1957 ([7]). The Pugu Forest Reserve has an area of 2,179 hectares while Kazimzumbwi Forest Reserve acreage is 4,887 hectares. Peri-urban of Dar es Salaam is a stretch from Julius Kambarage Nyerere International Airport (JKNIA) to Gongo la Mboto and all the way towards Kisarawe. 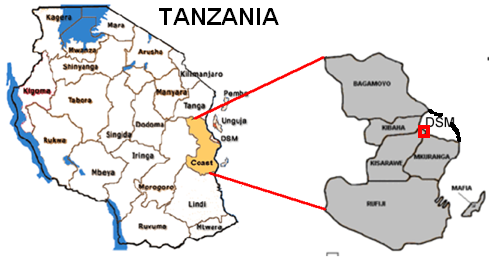 | Figure 1. Study area location within Tanzania |
 | Figure 2. Study area; Dar es Salaam/Kisarawe peri-urban area (part of) |
2.2. Data and Processing
| Table 1. Data used in the study. |
| | SN | Data Type | Description | | 1. | Landsat TM imagery | Scene p166r 065 datedJuly 2010; a dry season at study area. | | 2. | Topographical sheet | National standard sheet number 186/3 at scale of 1:50000 of 1987. | | 3. | Ground survey | GPS ground truth data observed in November 2012; a dry season at study area. | | 4. | Google Earth image | Image of November 2010 retrieved on 6th October 2012. |
|
|
Landsat Thematic Mapper (TM) imagery of the study area for the year 2010 and secondary data were used. The data, shown on Table 1, were Landsat Thematic Mapper (TM) with seven (7) bands at scene of path 166, row 65 (p166r065) acquired in July 2010, standard Topographical Sheet of Kisarawe (Kisarawe Sheet 186/3), Google Earth image of November 2010 downloaded from the internet on 6th October2012 and handheld Global Positioning Systems (GPS) coordinates captured during ground truth field work at study area. The data were pre-processed and geo-referenced to UTM Zone 37 S (WGS84) coordinate system using topographical sheet and Google Earth image for identifying control points. The study area sub-scene was extracted from the Landsat image and topographical sheet.
2.3. Indices Determination
2.3.1. Making of Index Derived Images
Urban area ecosystem is complex, Xu It can be simplified[14] by dividing it into three elements, namely, built-up land, vegetation, and open water. Based on these components, three indices, Normalized Difference Built-up Index (NDBI), Soil Adjusted Vegetation Index (SAVI), and Modified Normalized Difference Water Index (MNDWI), were selected in this study to constitute built-up land, vegetation and open water classes respectively. The study area consists of urban built-up land features, water bodies and water courses imbedded in vegetation. The study explore three indices, namely NDBI, MNDWI and SAVI to represent main urban land-use classes, namely, built-up land, open water body, and vegetation.
2.3.2. Soil Adjusted Vegetation Index Image
For quantitative characterisation of temporal and spatial vegetation patterns, indices are used to improve vegetation sensitivity by considering the effects of atmosphere and soil. SAVI was developed to minimize soil influences on canopy spectra by putting a soil adjustment factor in the NDVI equation ([9]). Vegetation information, in remote sensing, can be enhanced by rationing a near-infrared (NIR) band to a Red band, this capitalise on the high vegetation reflectance in NIR spectral range (e.g. TM band 4) and high pigment absorption of red light (e.g. TM band 3) ([2]). SAVI is used in the study, instead of NDVI, to highlight vegetation features since it can perform in area with low plant cover even as low as 15%, while NDVI can only work in the area with plant cover above 30% ([14]). The SAVI is obtained from the following formula by[1] | (1) |
where κ is a correction factor which ranges from 0 for very high plant-coverage (densities) to 1 for very low densities, for our study area we chose κ to be 0.4 in producing enhanced vegetation image.
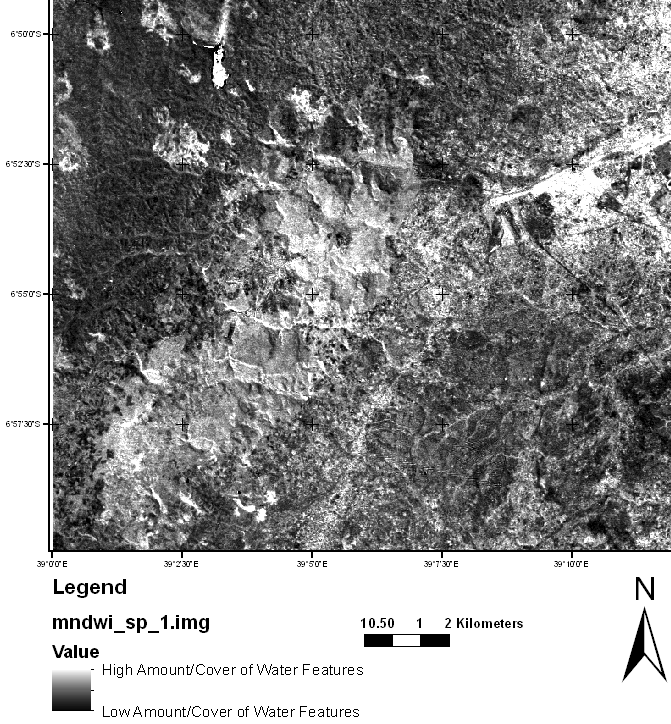
2.3.3. Modified Normalised Difference Water Index Image
Normalised Difference Water Index (NDWI) was presented by ([6]) to delineate open water features: | (2) |
where Green is the green band (e.g. TM band 2), and NIR is a near infrared band such as TM band 4. This index enhances water features because of positive values for green light wavelengths while vegetation and soil are suppressed (low reflectance of NIR) due to having zero or negative values. However,[14] modified NDWI formula by using a mid infrared (MIR) band, such as TM band 5, instead of NIR band in Equation (2) for NDWI, this was done because the output were noisy since built-up lands also have positive values in the NDWI-derived images. The modified NDWI (MNDWI) is expressed as follows: | (3) |
MNDWI can enhance open water features while effectively suppressing and even removing built-up land, vegetation and soil noises. The enhanced water information using the NDWI is often mixed with built-up land noise and the extracted area of water is thus overestimated. MNDWI is more suitable for enhancing and extracting water information for water within a background dominated by built-up land areas because of its advantage in reducing/removing built-up land noise over the NDWI.
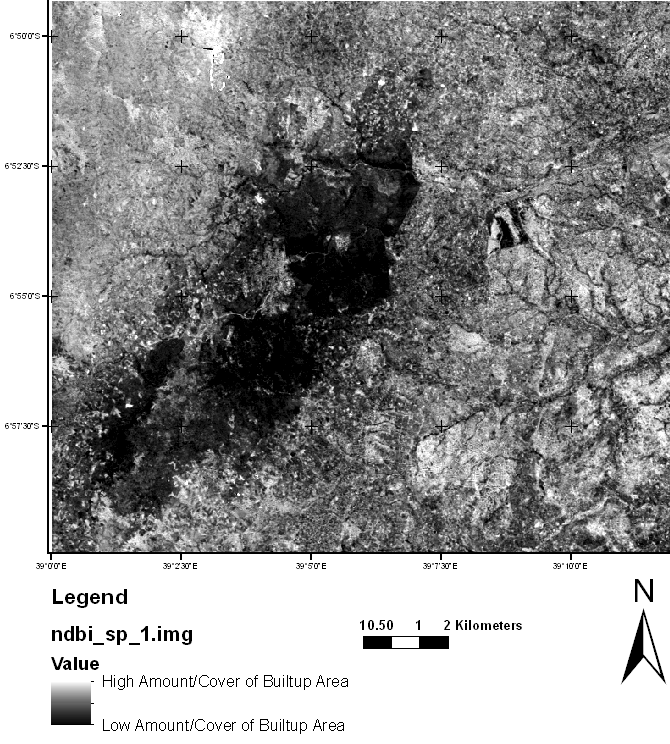
2.3.4. Normalised Difference Built-up Index Image
Built-up areas are effectively mapped through arithmetic manipulation of NDVI and NDBI images derived from TM imagery. The devised NDBI method was applied to map urban land in the city of Nanjing, eastern China. The mapped results had an accuracy of 92.6% indicating that it can be used to fulfill the mapping objective reliably ([16]). NDBI is represented by the following equation: | (4) |
2.3.5. Using Modeler to Make Images
Model Maker, a part of ERDAS Imagine software package was used to calculate MNDWI, NDBI and SAVI indices. The Model Maker tool palette was used to draw the model to be used in calculation, the input raster was declared as float and Nearest Neighbour interpolation method was selected. The single band images of SAVI, MNDWI and NDBI of the study area are shown in Figure 3, Figure 4 and Figure 5 respectively.
2.4. Feature Extraction
2.4.1. Multi-band Image Creation
Using Layer Stack process, three-band image composed of MNDWI, NDBI and SAVI images was formed. The conversion of seven-multispectral- band image into three-thematic-band image reduced significantly correlation among the bands, also the three major urban land-use classes were well separated and spectral signature analysis was simplified.
2.4.2. Supervised Classification
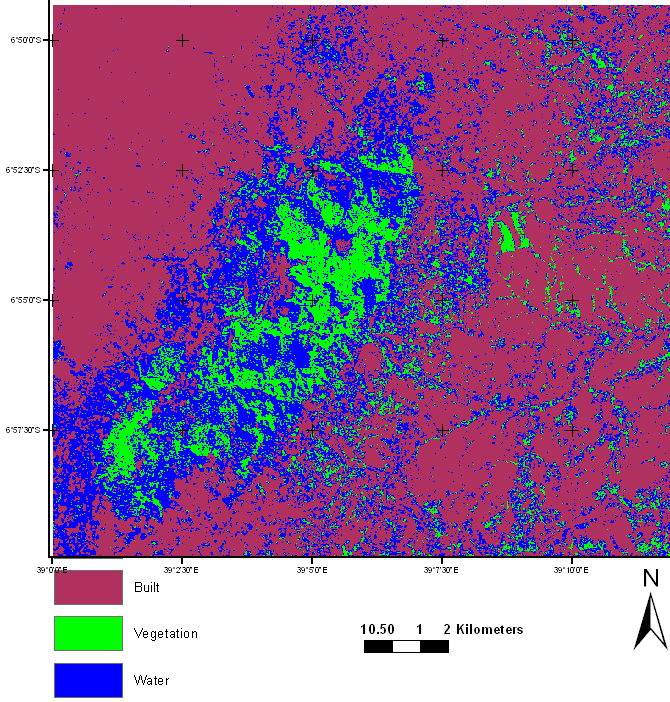
The first classification, Supervised Classification I, was performed on study area for Landsat TM7 Image before its reduction through MNDWI-NDBI-SAVI indicesmanipulation/process to form 3 Band stacked image. Since there was no variability within chosen training areas, large areas per feature class were preferred than several smaller training areas. The three classes; Built Up, Vegetation and Water bodies, were extracted using visual interpretation techniques on Topographical Sheet 186/3 of Kisarawe and downloaded Google Earth image. Information captured using handheld GPS during ground truthing was also used to carry out supervised classification on Landsat TM7 image of the study area. The signatures of three classes (Built Up, Vegetation and Water) created during supervised classification were evaluated within 3 bands combination in feature space and the output scattergrams with two band combinations; Band 1- Band 2 , Band 2- Band 3 and Band 3-Band 1 was visualised. Scattergrams conveyed the spectral nature of the signatures being analyzed, from the scattergrams it was observed that there is substantial overlap between Water and Built Up classes (Band 1 and Band 2), while there is minimal overlap between Built Up and Vegetation classes (Band 2 and Band 3) also minimal between Water and Vegetation classes (Band 1 and Band 3); this shows that in the latter combinations the pixels are not mixed-up thus no confusion in classification as compared to the former combination.The second classification, Supervised Classification II, was performed on new dataset, 3 band stacked image (Figure 6), created as a result of MNDWI-NDBI-SAVI indices manipulation/process on Landsat TM7 imagery. The extraction was carried out in ERDAS Imagine, the vegetation areas were extracted from the classified image to form a binary-image with the vegetation class assigned a value of 1 and all non-vegetation classes assigned 0, then, non-vegetation areas were masked out. The masking rendered non-vegetation areas pixels to be eliminated from further consideration and processing. Non-vegetation areas vector polygon outline was used in masking, and only the vegetation within the study area were left as vegetation lands; the same procedure was repeated for the Built-up class and Water bodies. 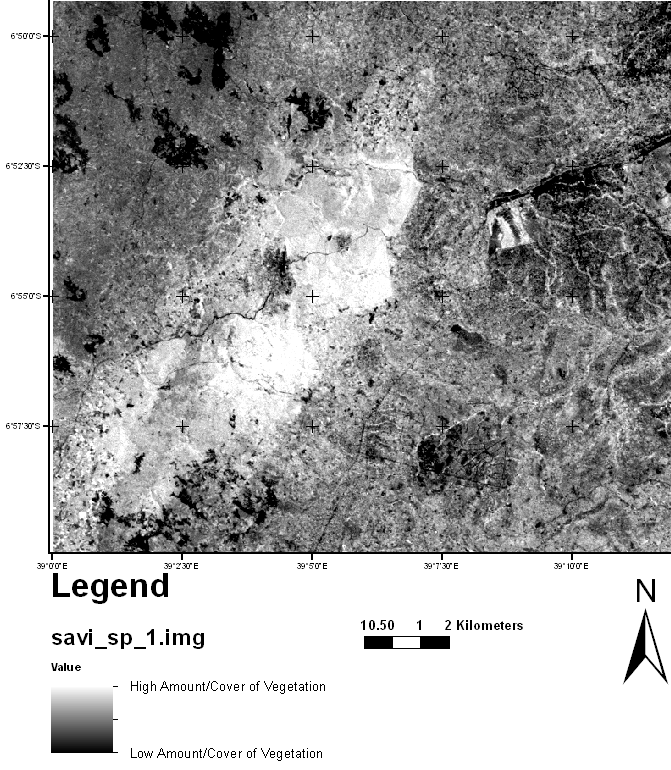 | Figure 3. The SAVI image |
 | Figure 4. The MNDWI image |
 | Figure 5. The NDBI image |
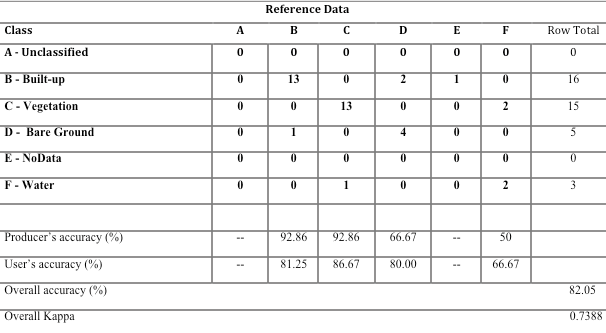
Table 2. Confusion matrix for the image classification; overall accuracy was 82.05% and Kappa statistic was 0.74
 |
| |
|
2.5. Accuracy Assessment
Supervised maximum likelihood classification method was used to classify original seven-band Landsat TM image, then, using the same signature file three-band image was classified. The visual inspection on classification outputs showed that the three - band image classification was superior to classified seven-band Landsat TM image. Also accuracy assessment was performed on ERDAS environment for classes extracted from the 3-band image, Table 2 gives summary of the accuracy assessment results on confusion matrix and it shows that the overall extraction accuracy of vegetation features to be 82.05%.
3. Results
The images from MNDWI, NDBI and SAVI indices manipulation (shown in Figure 3 – 5) were realised by the uses of the advantage of the spectral response of built-up areas, vegetation and water bodies land covers to isolate the classes effectively. Comparison between the Supervised Classification I (on original 7 band Landsat TM image) and Supervised Classification II (applied on 3 band image) is shown on Figures 7 and 8 respectively. 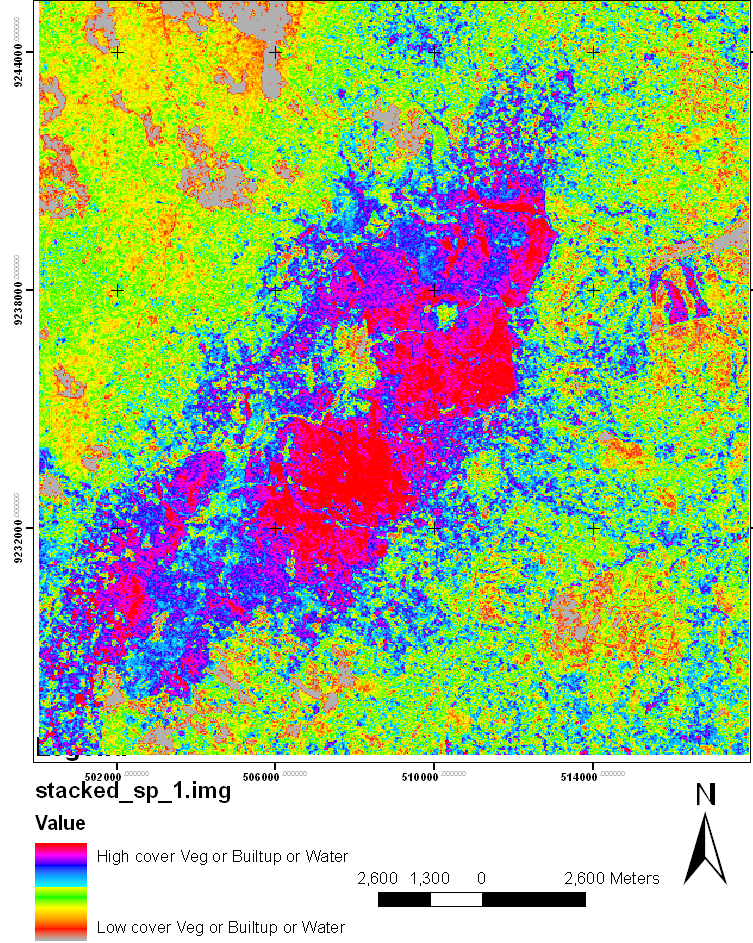 | Figure 6. MNDWI, NDBI and SAVI images stacked into a single image |
 | Figure 7. Supervised Classification I of study area on Landsat TM image for built-up, water and vegetation classes |
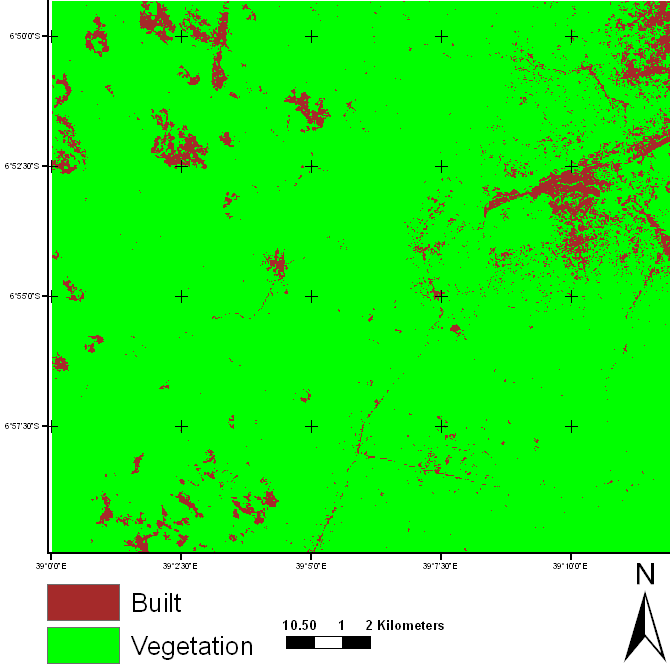 | Figure 8. Supervised Classification II of study area on 3 Band stacked MNDWI-NDBI-SAVI image for built-up and vegetation classes |
Differences are remarkable between the two products: the spectral signatures are more distinguishable in the 3 band stacked imagery than on the raw Landsat TM imagery. The accuracy values reflect these differences.
4. Discussion
The urban built-up and vegetation features of Dar es Salaam and Kisarawe peri-urban area were extracted from Landsat imagery of the study area successfully by using index combination technique and supervised classification method. The technique will be helpful in addressing the existing information gap (of lack of land use/cover maps) by using the technique in preparing the land-use/cover (LUC) maps of the study area efficiently. The method based on indices usage to automate the process of converting Landsat satellite imagery into LUC maps is efficient, timely and economical viable when compared with methods of manual interpretation and parametric image classification. The process takes advantage of the unique spectral response of built-up areas, vegetation and other land covers. Three LUC classes, namely Built-up area, Vegetation and Water bodies were mapped from Landsat TM7 satellite image for the study area. These classes were isolated by indices use and further by the use of supervised classification, however if different levels of detail per class are needed for study purposes or due to the existing complexity a hierarchical approach can be used. The study area is mostly characterized by built-up area and vegetation cover, the vegetation cover is mostly covered by the forest reserves and characterized by small patterns of agricultural land. Agricultural areas are concentrated along road networks and in the outskirts of built-up patterns. Built-up areas are characterized by clustered buildings along road networks with a minimum number on isolation within the study area.
5. Conclusions
This study was undertaken objectively to extract urban built-up and vegetation features of Dar es Salaam and Kisarawe peri-urban area by employing index combination technique and supervised classification method using Landsat imagery of July 2010. The LUC classes of particular interest for this study namely Built-up area, Vegetation and Water bodies were isolated efficiently and accurately from the Landsat TM7 imagery. The spatial resolution of Landsat TM7 could not facilitate effectively ground truth tasks for the study, thus, Topographical Maps at scale of 1:50,000, Google Earth images and ground survey data were used for the task. The classification on 3-band stacked image proved to be superior to the original 7-band image. The accuracy should be sufficient to apply the technique/methodology on widely available and affordable Landsat multispectral data, thus, decision makers and local authorities can utilize the same. Also it was noted that the use of indices and supervised classification in extracting features in Landsat TM7 image increased the spectral contrast between major land-cover use classes, therefore, through the combined methods high accuracy of extraction can be attained.
ACKNOWLEDGEMENTS
This research was supported by NORAD funded research programme in Tanzania – Climate Change Impacts, Adaptation and Mitigation (CCIAM) through the Analysis of the Impacts of Urban Land Use and Climate Change on Coastal Ecosystems and Management (IULUCC –CFM) research project.
References
| [1] | Huete, A. 1988, A soil-adjusted vegetation index (SAVI), Elsevier: Remote Sensing of Environment, 25(3):295-309. |
| [2] | Jensen, J. 2000, Remote Sensing of the Environment: An Earth Resource Perspective, Prentice Hall, Upper Saddle River, New Jersey, p. 544. |
| [3] | Kemp, K. K. 2008, Encyclopedia of Geographic Information Science - Image Processing, ed. K. K. Kemp (SAGE Publications, Inc.), 224–227. |
| [4] | Liwa, E. J. 2006, A Neural Network Model for Classification of Coastal Wetlands Vegetation Structure With Moderate Resolution Imaging Spectro-Radiometer (MODIS) Data, PhD. Dissertation, Department of Oceanography and Coastal Sciences, Louisiana State University. |
| [5] | Masek, J.G., F.E. Lindsay and Goward, 2000. Dynamics of urban growth in the Washington DC metropolitan area, 1973-1996, from Landsatobservations - International Journal of Remote Sensing - 21(18): pg.3473-3486. |
| [6] | Malugu, I. 2007, Resource-use Conflicts and Management Challenges for Pugu and Kazimzumbwi Forest Reserves in Kisarawe and Ilala Districts, Tanzania - Discovery and Innovation Journal (Special Edition 1 & 2) (pp. 149-174), 19. McFeeters, S. 1996, The use of normalized difference water index (NDWI) in the delineation of open water features, International Journal of Remote Sensing, 17(7):1425-1432. |
| [7] | Mligo, C., and Rocky, J. 2012, Regeneration pattern and size-class distribution of indigenous woody species in exotic plantation in Pugu Forest Reserve, Tanzania - International Journal of Biodiversity and Conservation Vol. 4(1), (pp. 1-14). |
| [8] | NBS. 2007, Coast Region Socio-Economic Profile, Tech. rep., National Bureau of Statistics (NBS). |
| [9] | Qi, J., Chehbouni, A., Huete, A., Kerr, Y., & Sorooshian, S. 1994, A Modified Soil Adjusted Vegetation Index - Elsevier: Remote Sens. Environ. (pp. 119-126), 48. |
| [10] | Rego, L. F. G. 2003, Automatic Land-cover Classification Derived from High- resolution IKONOS Satellite Image in the Urban Atlantic Forest in Rio De Janeiro, Brasil by means of Object-oriented Approach, Project Report. |
| [11] | Squires, G. D. 2002, Urban Sprawl and the Uneven Development of Metropolitan America. Urban sprawl: Causes, consequences, and policy responses (pp. 122). Washington, D.C. |
| [12] | Turner II, B., Skole, D. L., Sanderson, S., et al. 1995, Land-use and Land-cover Change - Science/ Research Plan - Stockholm and Geneva: IGBP Report No.35 and HDP Report No. 7. |
| [13] | Xu, H. 2002, Spatial Expansion of Urban/town in Fuqing and its Driving Force Analysis, Remote Sensing Technology and Application, 17(2):86-92. |
| [14] | Xu 2005: Hanqiu Xu 2005. Modification of normalized difference water index (NDWI) to enhance open water features in remotely sensed imagery. - International Journal of Remote Sensing - 24(14): pg. 3025-3033. |
| [15] | Xu, H. 2007, Extraction of Urban Built-up Land Features from Landsat Imagery Using a Thematic-oriented Index Combination Technique - Photogrammetric Engineering Remote Sensing Vol. 73, No. 12, pp. 1381-1391. |
| [16] | Yuan, F., Sawaya, K. E., Loeffelholz, B. C., & Bauer, M. E. 2005, Land cover classification and change analysis of the Twin Cities (Minnesota) Metropolitan Area by multi-temporal Landsat remote sensing - Elsevier: Remote Sensing of Environment (pp. 317-328), 98. |
| [17] | Zha, Y., Gao, J., & Ni, S. 2003, Use of normalized difference built-up index in automatically mapping urban areas from TM imagery, International Journal of Remote Sensing, 24(3):583-594. |
 Abstract
 Reference
 Full-Text PDF
 Full-text HTML