-
Paper Information
- Next Paper
- Previous Paper
- Paper Submission
-
Journal Information
- About This Journal
- Editorial Board
- Current Issue
- Archive
- Author Guidelines
- Contact Us
International Journal of Agriculture and Forestry
p-ISSN: 2165-882X e-ISSN: 2165-8846
2013; 3(6): 209-219
doi:10.5923/j.ijaf.20130306.02
Study on the Release of N-Available (NH4+ and NO3-) of Urea-Humate
 Abstract
 Reference
 Full-Text PDF
 Full-text HTML
Retno Suntari1, 2, Rurini Retnowati3, Soemarno2, Mochammad Munir2
1Agricultural Sciences Graduate Program, Faculty of Agriculture, University of Brawijaya, Indonesia
2Soil Science Department, Faculty of Agriculture, University of Brawijaya, Indonesia
3Chemistry Department, Faculty of Mathematics and Natural Sciences, University of Brawijaya, Indonesia
Correspondence to: Retno Suntari, Agricultural Sciences Graduate Program, Faculty of Agriculture, University of Brawijaya, Indonesia.
| Email: |  |
Copyright © 2012 Scientific & Academic Publishing. All Rights Reserved.
Vertisols with 2:1 type clay minerals have the ability to swell and shrink, as well as having a negative charge that can lead to fix ammonium (NH4+). Engineering of the urea-humate is believed able to minimize effects of this ammonium fixation. This study was performed to examine interactions between urea and potassium-humate at various concentrations in terms of the release of N-NH4+ and N-NO3- in ricefield Vertisols. Five concentrations of potassium-humate were applied in urea-humate engineering. Vertisols have a low content of N-total and C-organic, high CEC, acidic pH, and clay texture with 80% clay fraction. The content of carboxyl group in potassium-humate is lower than OH-phenol group, and these functional groups were interacted with urea at a concentration of 26 ppm, 130 ppm and 260 ppm. Urea-humate in these concentrations formed an aromatic-amide in wave numbers 1677,95 cm-1 and 1679,88 cm-1, and has a higher bond strength on treatment with higher concentrations of humate. Urea-humate of 260 ppm has the lowest release of N-NH4+ (<50%) and the lowest release of N-NO3- (8.54%) in the third week of soil incubation. While the release of N-NH4+ and N-NO3- from the urea was 500,91% and 145,53% at the third week of soil incubation. The release of N-NH4+ reached maximum level at pH 6,08, whereas the release of N-NO3- reached maximum level at pH 6,01.
Keywords: N-NH4+, N-NO3-, Urea-humate, Vertisol
Cite this paper: Retno Suntari, Rurini Retnowati, Soemarno, Mochammad Munir, Study on the Release of N-Available (NH4+ and NO3-) of Urea-Humate, International Journal of Agriculture and Forestry, Vol. 3 No. 6, 2013, pp. 209-219. doi: 10.5923/j.ijaf.20130306.02.
Article Outline
1. Introduction
- The main problem of urea application on farmlands is its low efficiency, about 30-40% of its nitrogen can be absorbed by plants, some of its nitrogen loss through NH3 volatilization (20-53%) and losses through other ways can reach 60%[33, 17]. Efforts to improve urea efficiency has been carried out by Ahmed[1], urea application in combination with humic acid and phosphate are able to form NH4+ more than NH3, and it can reduce environmental pollution. Soil application of the humic-acid increase soil water retention, and inhibit solubility of inorganic fertilizer[1]; NH3 losses during 15 days of incubation is only 24,62% when compared to the losses of NH3 from urea about 48,80%. Ahmed[2] reported that humic-acid in the urea-zeolite-humic acid (UZA) plays a role in chelating inorganic bases and heavy metal in soil. However, the use of humic UZA is less effective because of clumping during its storage. Tikhonov[30] found that application of humic-acid from coal-mine at the concentration of 0,1 gL-1. can stimulate growth of soil bacteria Acinetobacter sp. Wang[31] showed that pH decrease and increase of Ca concentration can enhance diffusion of humic-acid. Under condition of high pH, humic-acid has a negative charge due to ionization of COOH-carboxyl and OH-phenol. Under condition of low pH, this group experienced protonation which makes humic-acid lack of negative charge and their intramolecular electric bondings are lower. Furthermore, humic-acid can be transformed from the large-molecule, flexible, and low ionic bond under alkaline condition, into the a small molecule, rigid and high ionic bond under acidic condition. In improving efficiency of N-fertilizer, urea-humate engineering is required, the urea-humate more stable and suggest a slow release of its nitrogen. Interaction of humic-acid with urea is not permanent, nitrogen can be released into the available forms. Interactions of humic-acid and urea can be analysed using FT-IR; it is expected that interaction between urea and humic-acid results in slower release of N-NH4+ and N-NO3-. This study is performed to examine interaction between urea and humic-acid at various concentrations in terms of N-NH4+ and N-NO3- release.
2. Material and Methods
- This experiment was conducted from July 2011 to October 2011 in the greenhouse of University of Brawijaya, Indonesia. Soil samples were taken from the ricefield Ngawi-vertisols. Soil samples at a depth of 0-30 cm were taken from The Experimental Station of Research Center for Legume and Tuber Crop, Ngale, Ngawi, East Java, Indonesia. Soil samples were grinded through 20 mesh sieve. Potassium humate (KH26) is a formula derived from Leonardite sediment of Victoria's gippland Australia. Urea (46%N) is product of Pupuk Kalimantan Timur, Bontang, Indonesia.Analysis of chemical and physical properties of soil, humic-acid, and its functional group were done by the standard procedures. Analysis of C-organic used Walkey and Black method[20]. Analysis of N-total, N-NH4+ and N-NO3- used Kjeldahl method[11]. Carboxyl group, phenol group, and total acidity of humic-acid is determined by the Schnitzer method in Stevenson[27]. Characterization of humic urea by FT-IR (Fourier Transform Infra Red) used KBr pellets. This study begins with the engineering of urea-humate with different concentrations. Five concentrations of humic-acid used in coating urea, are: 5 ppm (UH1), 10 ppm (UH2), 26 ppm (UH3), 130 ppm (UH4) and 260 ppm (UH5). Method used for urea-humate 26 ppm coating engineering is by mixing 10 mL KH 26 with 90 mL distilled water. The next step is spraying the solution on 1 kg of urea fertilizer until it was well covered, then left to dry naturally for 7 days. After perfectly dry, it will produce blackish brown urea - humate fertilizer with level of 26 ppm. The manufacture of 130 ppm and 260 ppm is by adding 50 mL KH 26 with 50 mL distilled water and 100 mL KH 26 in 1 kg of urea fertilizer. The 5 ppm and 10 ppm were made of 2 mL and 4 mL KH 26 added with distilled water until it becomes 100 mL by mixing method as described above. The tools used are plastic pots with diameter 17 cm, height 14 cm, and volume of 3 L.Urea, urea-humate 5 ppm, 10 ppm, 26 ppm, 130 ppm, and 260 ppm, respectively 0,1 g applied in pots containing 1 kg of soil sample based on weight of 1 acre plough layer (2 x 10⁶ kg). Pot containing 1 kg of soil sample without fertilizer was used as a control. Amount of fertilizer applied is based on the recommendations for ricefield in Ngawi, East Java, Indonesia, that is 200 kgha-1. Concentration of humic-acid is based on research results from Khaled and Fawy[14], in which soil application of humic acid is more efficient at a concentration of < 0,2 % and foliar application at a concentration of < 0,1 %.This study begins with an analysis of physical and chemical properties of vertisol soil; carboxyl group, phenol group, total acidity, and characterization of urea-humate using FT-IR method. Analysis of soil N-available, N-total, and soil pH are every week during five weeks of soil incubation. Soil samples were taken at depths of 0 to 7,5 cm for analysis of pH, N-NH4+, N-NO3- and N-total. The completely randomized design involved the seven treatments, i.e. control, Urea, UH1, UH2, UH3, UH4 and UH5, were replicated three times. Analysis of variance and the Duncan test were to evaluate significance of treatment effects.
3. Results and Discussion
3.1. Chemical and Physical Characteristics of Vertisol Soil
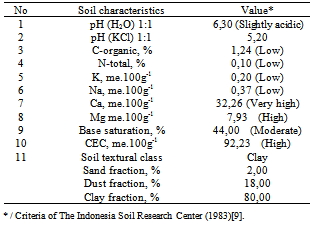
- Soil characteristics analyzed in this research are soil-pH (pH(H2O) and pH(KCl)), C-organic (%C), N-total (%N), CEC, Base-Saturation, soil-textural class (% sand, % silt, and % clay). Results of soil analysis are presented in Table 1.Table 1 shows that soil acidity is the slightly acidic. This suggests that ricefield vertisol soil tends to have low level of the available-N. The low content of N-total in the soil is caused by the intensive N-losses through leaching of N-nitrate, volatilization of ammonia and plant uptake. On the other hand, vertisol soil has a high CEC, high content of alumino-silicate clay-mineral of 2:1 type (montmorillonite). This clay suggests an ability to shrink and swell intensively and a high negative charge which can result in ammonium fixation[21].The Ngale vertisol soil has a clay texture which consist of 2 % sand, 18 % silt, and 80 % clay fraction. This is consistent with results from Kasno[12] which stated that Ngale Vertisol has the clay-texture, slightly acidic, lower C-organic content, lower K extracted HCl 25% and lower N-NH4+ extracted NH4OAc. Organic matter plays an important role in supplying available N, P, and S[27]. Unbalanced nutrient status and low C-organic content are also related to the low soil-N content. This is supported by the characteristics of vertisol soil which has exchangeable cation dominated by Ca+ and Mg2+ (Table 1). This is in accordance with the results from Prasetyo[19] that vertisol soil is strongly influenced by the alluvium parent materials, limestone, and peridotite ultrabasic materials. In the processes of SOM decomposition, CO2, NH4+, H2PO4-, and SO4-2 were released into the soil, and these nutrients are absorbed by plant roots and soil microorganisms[3].
|
3.2. Characteristics of Potassium Humate
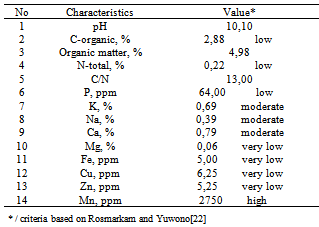
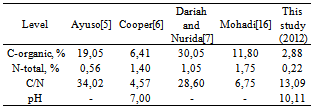
- Humic-potassium analysis are shown in Table 2. Macro nutrients content of C-organic (2,88%), N (0,22%), and P (64 ppm) are the low level; content of K (0,69%), Na (0,39%), and Ca (0,79%) are the moderate level, content of Mg is very low (0,06%), and pH = 10,10. Micro nutrient content of Fe (5 ppm), Cu (6,25 ppm), and Zn (5,25 ppm) are the very-low level, on the contrary Mn content is high (2750 ppm). This is in contrast with results of the humic acid analysis from Leonardite[6] that C-organic content is high (6,41%) and N-total is very high (1,4%). Ayuso[5] obtained a high N content (0,56%) and very high C (19,05%) in the Leonardite sample.
|
|
3.3. Composition of Functional Groups on Urea-humate
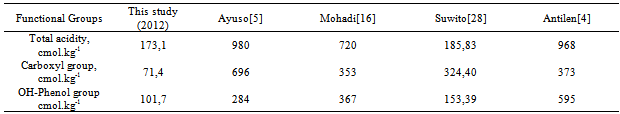
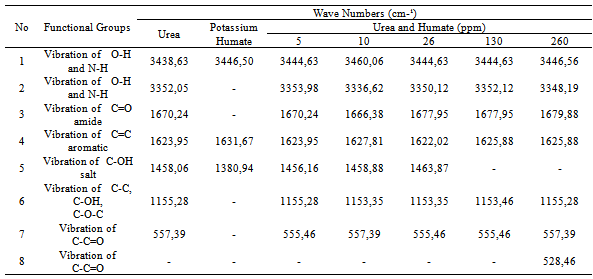
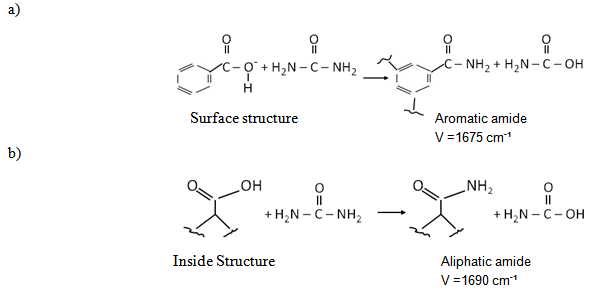
- Functional group analysis of urea, potassium humate, and urea-humate fertilizers using FT-IR are presented in Table 5 and Figure 1. The existence of vibrational absorption in the region of 3400 cm-¹ suggested that potassium-humate and urea-humate contained O-H chain with the intramolecular H-bond in the form of polymers[23]. Furthermore, vibrational absorption at the wave number of 3300 cm-1 suggested the chain O-H and N-H[29].Interaction between potassium-humate and urea shown by the FT-IR spectra indicated the difference between the urea-humate spectrum and urea spectrum. Interpretation of the FT-IR spectra at the Urea-humate 5 ppm suggested the value remains the same as urea, i.e. 1670,24 cm-¹, whereas at the Urea-humate 10 ppm showed a vibrational absorption at 1666,38 cm-¹. This suggests that there is an interaction between urea and humic-acid (Table 5).Spectrum of the Urea-humate at concentration of 26 ppm and 130 ppm in the wave number of 1677,95 cm-¹ and the Urea-humate at concentration of 260 ppm in the wave number of 1679,88 cm-¹ suggesting any uptake of aromatic-amides. It suggests that there has been interaction between humic-acid and urea, producing aromatic-amide group (R-C=O-NH2) with the wave number of 1675 cm-¹[15]. This is supported by Silverstain et al.[26] that the FT-IR spectra in the vibration absorption of 2000-1650 cm-¹, 1600-1585 cm-¹, 1500-1400 cm-¹, 1300-1000 cm-¹, and 900 - 675 cm-¹ is an aromatic compound. This is also in accordance with the opinion of Kemp [13]. CO-carbonyl group was derived from humic-acid and amines group was derived from urea.Potassium-humate showed absorption bands at the wave numbers of 1380,94 and 1631,67 cm-¹. Tan[29] and Ayuso [5], suggested that these are carboxyl group (1400-1380 cm-¹) and aromatic compounds (1620-1575 cm-¹). These are in line with results obtained by Ayuso[5], potassium-humate used is derived from Leonardite which have undergone humification and the aliphatic amide compound (R-C = O- NH2) at the wave number of 1675 cm-¹. This is supported by the research results[8], that the absorption band of 1632 cm-¹ in humic-acid showed the C=C aromatic group.Humic-acid hypothetical structure contain OH-phenolic group, -COOH, which is attached to the aromatic ring and quinones through the nitrogen and oxygen bridges[28]. Humic acids with a molecular weight of 1500 is not likely to form inclusion with crystalline urea. Urea-humate complex reaction can occur through the two possible models[29].
|
|
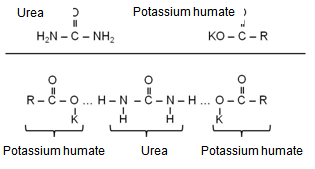 Interaction Model 2: When one potassium humate molecule binds two molecules of urea
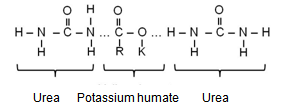
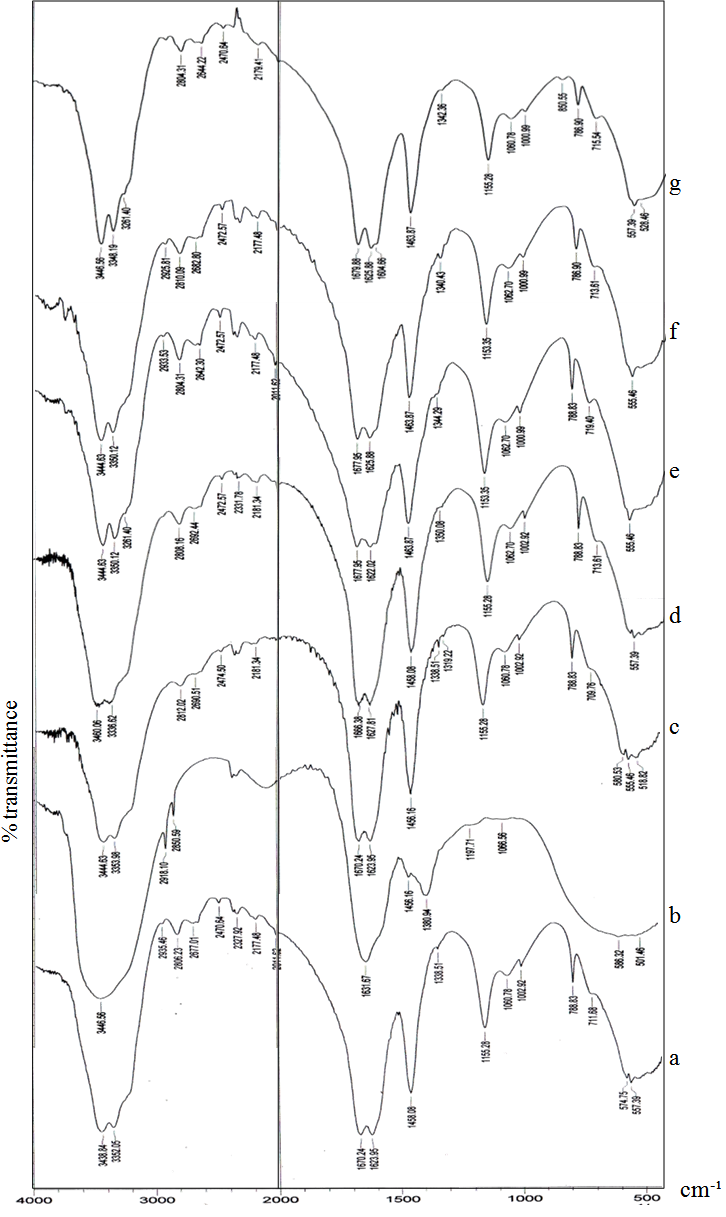 | Figure 1. FT-IR spectra of Urea Fertilizer (a); Potassium Humate (b); Urea-Humate Fertilizer 5 ppm (c), 10 ppm (d), 26 ppm (e), 130 ppm (f) and 260 ppm (g) |
3.4. Effects of Potassium Humate Concentration on the Soil pH
- Increased concentrations of potassium humate in the urea fertilizer does not change soil pH drastically, wherein the pH value in the first week to the fifth week after incubation is still in the range of slightly acidic, pH = 5,73 to 6,50 (Figure 2). pH value in the first week generally indicates that the treatment with addition of potassium humate increases soil pH. Treatment with addition of potassium humate 260 ppm and 130 ppm are significantly different compared to the control treatment, but did not differ by treatment with urea. In the second and third weeks, potassium -humate application results in a lower soil pH. In the fourth week until the fifth week, application of potassium-humate showed no significant differences compared with the control and urea.Potassium-humate application results in a comparable soil pH with others treatments; it due to the nature of humic-acid which can buffer soil pH[10]. Humic acid has the potential to buffer pH in value of 5,5-8,0 [18].
3.5. Effect of Potassium Humate on the Release of N-NH4+ and N-NO3- from Urea-Humate
- Release of N-NH4+ from the urea-humate during five weeks incubation are presented in Figure 3.Addition of the urea-humate 260 ppm (UH5) shows the lowest release of N-NH4+. Number of N-NH4+ released from urea-humate in the first and second week are in the range of 8-38 %, while release of N-NH4+ at the between second and third week are in the range of 20 - 44%. This is supported by the results of statistical analysis which showed highly significant differences between urea and urea-humate treatments at the second, third and fourth week of incubation. The low release of N-NH4+ from urea-humate suggested any reactions in Model-1 in which one urea molecule binds two molecules of humic-acid. On the other hand, the active side of the aromatic amide group in terms of molecules geometry have less hindrance when compared to aliphatic amide groups, and it affects the availability of N-NH4+ in soils. The highest level of N-NH4+ in the UH5 treatment of 59,989 mg kg-1, 59,606 mg kg-1, and 68,325 mg kg-1 are very significant (p=0,01) when compared with the urea treatment during the second weeks, third week, and fourth week of incubation (Figure 3).The higher concentration of urea-humate is followed by high levels of N-NH4+ during the fourth week of incubation. This suggested that there is no inclusion structure of urea, it results in the easier release of NH4+ from urea. This study also suggested the interaction between urea with any active sides on acid groups attaching to aromatic ring (v = 1677 cm-1) and acid groups attaching to aliphatic (v = 1690 cm-1). This is indicated by the presence of vibrational absorption at the wave number of 1680 cm-1 , it is the carbonyl vibration of COO- asymmetric chain[25]. It is supported by the results of analysis which shown the low carboxyl group and higher value of OH-phenol group (Table 4). The negative charge on the carboxyl group can bind NH4+, the urea-humate fertilizer showed a slower release of NH4+. Interactions in urea-humate binding involved covalen bonds and hydrogen-bonds[29]. Covalen bond between aromatic group of carbonyl in humate and amide group in urea forming a more stable aromatic-amide compound. This bond makes urea humate more difficult to degrade. On the other hand, the existence of hydrogen-bonds in the dipolar water molecule can bind urea and potassium humate.The largest decrease of N-NH4+ levels (77,145 %) occurred in the urea treatment with the lowest N-NH4+ level (6,458 mg kg -1) at the third week. Furthermore, urea treatment increased by 500,194 % at the fourth week so levels of N-NH4+ becomes 38,807 mg kg -1. But this value is still lower than the urea-humate 260 ppm treatment (UH5) with N-NH4+ levels of 68,325 mg kg -1. In the 5th week all treatments showed similar patterns and levels of N-NH4+ decreased from week 4 in the range of 34-81 %. This is supported by the pH value at week 1, week 2, and week 3 which is significantly (p=0,01) affected by treatment of potassium humate on urea.
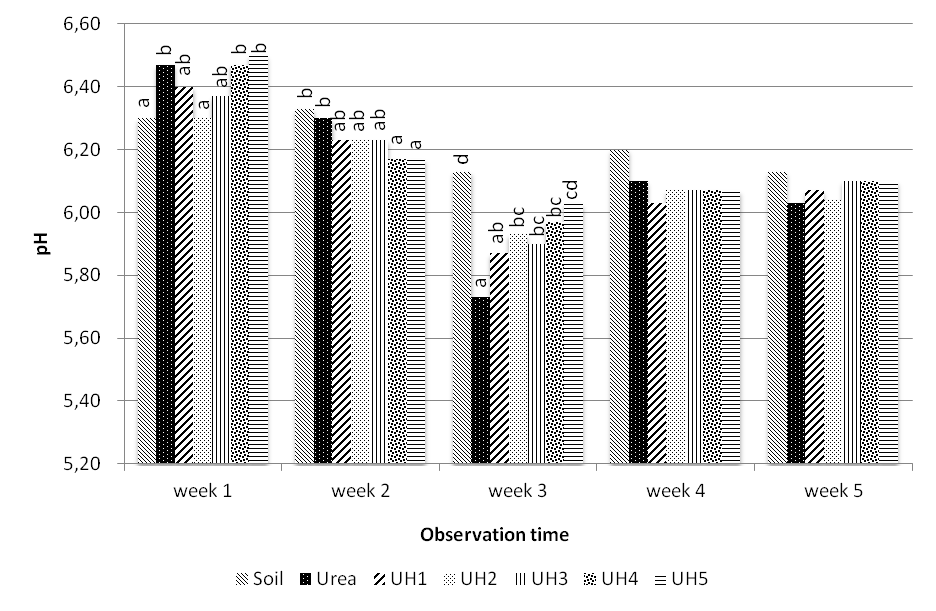 | Figure 2. Soil pH during five weeks incubation |
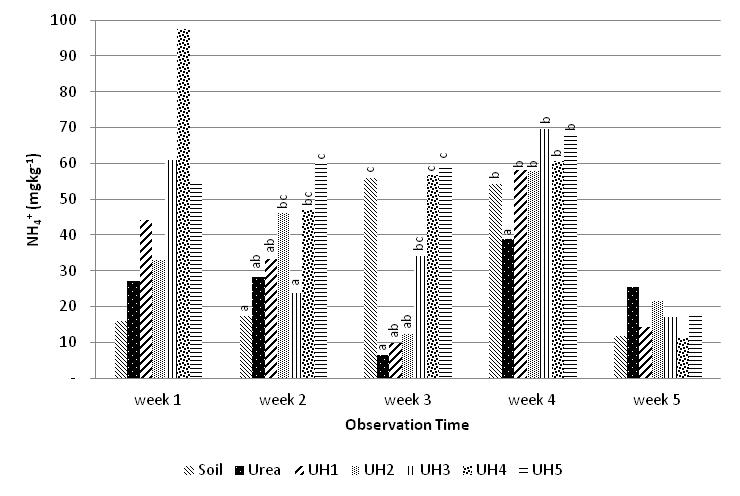 | Figure 3. Effect of potassium humate on the release of N-NH4+ |
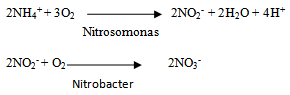 These N-transformation process maybe also affects content of N-total in soil as shown in Figure 5.The increase of urea-humate concentration was only significantly different from control (without fertilizer) in terms of N-soil content. During the first week until the fifth week of incubation, content of N-soil are relatively low.The addition of potassium humate on urea with high concentrations is likely to stimulate growth of soil nitrifying bacteria so the N-NO3- is the highest on UH5 treatment until the fourth week. This is consistent with research findings[30] that application of potassium-humate improved growth of Acinetobacter sp. bacteria.
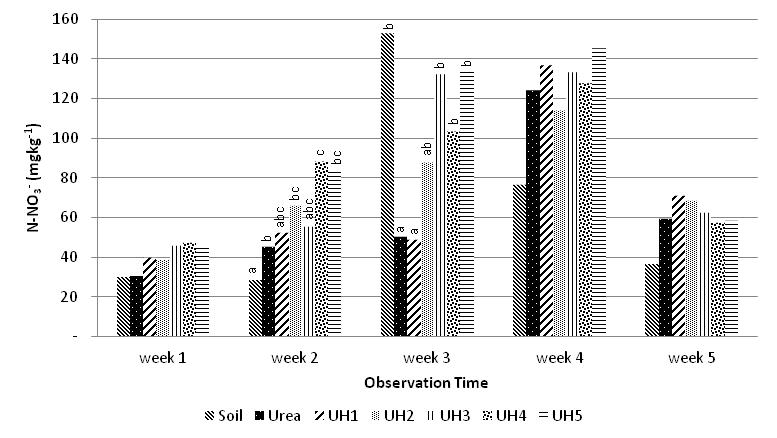 | Figure 4. Effect of potassium humate on the release of N-NO3- |
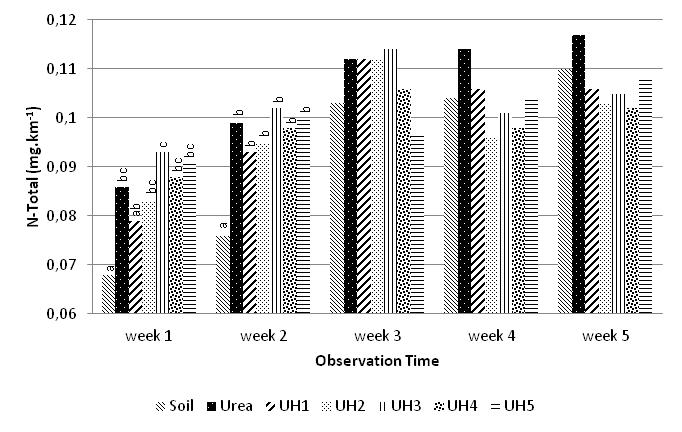 | Figure 5. Effect of humic-acid on the N-total of soil |
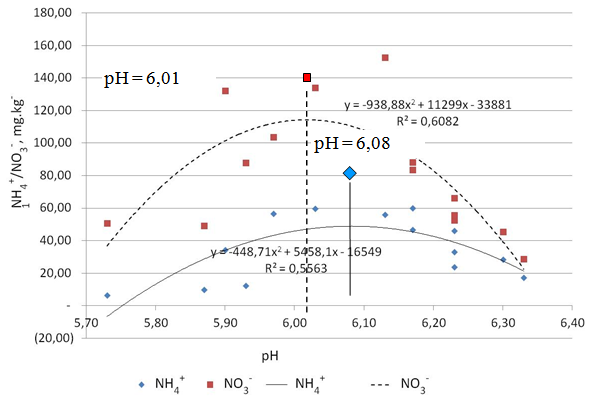 | Figure 6. Effect of soil pH on the release of N-NO3- and N-NH4+ |
3.6. Effects of Soil pH on the Release of N-NO3- and NH4+-N from Urea-Humate
- Effects of pH on N-NO3- and N-NH4+ suggest the quadratic pattern as shown in Figure 8. The equation of the relationship between soil pH and N-NO3- is Y = -938,88 x2 + 11299 x - 33881 (R2 = 0,6082). While the relationship between soil pH and N-NH4+ is Y = -448,71 x2 + 5458,1 x - 16549 (R2 = 0,5563). Statistical analysis showed that the N-NO3- and N-NH4+ is very significantly affected by soil pH.Figure 6 shows that the N-NO3- increase to a maximum level at pH 6,01 and decline again under condition of pH > 6,01. It also occurs in N-NH4+ which increased to a maximum level at pH 6,08 and decreased again under condition of pH > 6,08. Decrease in N-NH4+ is presumably due to the nitrification process, while decrease in N-NO3- due to denitrification. Havlin[10] found that N2O is widely available at pH 6,5 as a result of N-NO3- denitrification.
4. Conclusions
- The potassium humate contain carboxyl group about 71,4 cmol.kg-1 and OH-phenol group about 101,7 cmol.kg-1, both of these groups interact with urea at the concentration of 26 ppm, 130 ppm, and 260 ppm. Urea-humate at the concentrations of 26 ppm, 130 ppm, and 260 ppm suggest any formation of aromatic-amide at the wave numbers of 1677.95 cm-1 and 1679.88 cm-1; the bond strength was higher under condition of a higher concentration of humic-acid. Urea-Humate 260 ppm (UH5) shows the lowest release of N-NH4+ (<50 %) and the lowest release of N-NO3- (8.54 %) during the third week of soil incubation. Release of N-NH4+ and N-NO3- from urea were 500,91 % and 145,53 % . Release of N-NH4+ reached maximum level at pH 6,08, whereas the release of N-NO3- reached maximum level at pH 6,01.
ACKNOWLEDGMENTS
- This research was funded by the Directorate General of Higher Education of the Ministry of Education and Culture, Indonesia; through the Agricultural Sciences Graduate Program, Faculty of Agriculture and supported by facilities from Soil Chemistry Laboratory, Faculty of Agriculture, and Chemistry Laboratory, Faculty of Mathematics and Natural Sciences, University of Brawijaya, Malang-Indonesia.