Maruod E. Maruod1, Elkhalil E. Breima2, Elrasheid E. Elkhidir1, Ahmed M. El Naim3
1Department of Agricultural Economics and Rural Development, Faculty of Natural Resources and Environmental Studies, University of Kordofan, Elobeid, Sudan
2Agricultural Research Corporation, Elobeid Research Station, Elobeid, Sudan
3Department of Crop Science, Faculty of Natural Resources and Environmental Studies, University of Kordofan, Elobied, Sudan
Correspondence to: Ahmed M. El Naim, Department of Crop Science, Faculty of Natural Resources and Environmental Studies, University of Kordofan, Elobied, Sudan.
| Email: |  |
Copyright © 2012 Scientific & Academic Publishing. All Rights Reserved.
Abstract
This study was designed to test and identify the impact of improved seeds on small farmers’ productivity, income and livelihood in Umruwaba locality of Sudan. 60 households participants were selected randomly through a field survey during 2011 for 2008/2009, 2009/2010 and 2010/2011 cropping seasons. The study applied Multi-stage random sample technique. The results also showed positive change in production patterns, resource use (467, 471, 468, 467 and 200% for land, cash income, labour, seed supply and productivity, respectively under existing and optimal plan). The optimal plan under reallocation of resources indicated an improvement in gross margin and cash income per hectare by 467% and 981%, respectively. Partial crop budgeting indicated that, all treatments were financially gave positive returns. Dominance analysis showed that Okra crop (Khartoum-red) and Groundnut (Soderi) were dominant and gave the highest net returns. Cost overrun and benefit reduction by 10% for sensitivity analysis indicated highly stability for groundnut (Soderi ) with MRR 165 and 163%, respectively. Improved seeds Productivity trend compared to local were increased in all varieties.
Keywords:
Improved Seed, Linear Programming, Dominance, Marginal Analysis
Cite this paper: Maruod E. Maruod, Elkhalil E. Breima, Elrasheid E. Elkhidir, Ahmed M. El Naim, Impact of Improved Seeds on Small Farmers Productivity, Income and Livelihood in Umruwaba Locality of North Kordofan, Sudan, International Journal of Agriculture and Forestry, Vol. 3 No. 6, 2013, pp. 203-208. doi: 10.5923/j.ijaf.20130306.01.
1. Introduction
North Kordofan state is located between latitudes 11-16o N and longitudes 27-32o E. Umruwaba locality lies between latitudes 13-14o N and longitudes 30-32o E. The project was selected by the proceeding IFAD mission in the consultation process with federal and state government for its concentration of deprived population, relative lack of development but reasonable potential[1]. Improved seeds can achieve its purpose only if it is transferred to and adopted by farmers[13],[14]. Effective technology of improved seeds can result in higher agricultural production and increased incomes of farming families, which has positive affect rural poverty Improved crop yields will reduce costly imports of agricultural commodities and the cost of production of basic raw materials for agro-industries. In the long run the adoption of improved seed technology by farmers can make agro-industries more competitive in the international markets[2]. According to[3] improving smallholders’ access to new crop varieties has long been recognized as critical step for increasing agricultural productivity. The main features of farming in North Kordofan, especially Umruwaba locality are characterized by continuous deterioration in its natural resources base and production. Such deterioration has resulted from various influential factors among them, poor genetic resources and biophysical factors. Our ultimate goal was to determine the relationship between improved seeds and farmers, productivity, income and livelihood. We hypothesized that investors would get the benefit when grow improved seeds. Therefore, the objective of this study to determine the effect of improved seeds on small farmers productivity, income and livelihood in Umruwaba, North kordofan of Sudan.
2. Materials and Methods
Questionnaires households’ survey regarding crop production activities was conducted to collect primary data through direct interviewing with IFAD farmers. A form of multistage random sampling of 60 respondents was selected from fourteen villages to represent three administrative units (mid Umruwaba, Errahad and Wad ashana). Secondary sources of data were also used. Linear programming model, partial crop budgeting, dominance, marginal and sensitivity analysis were applied.
2.1. Linear Programming Model
As references[4] reported that linear programming model is a method of determining a profit maximization combination of farm enterprises that is feasible with respect to a set of farm constraints.[5] applied linear programming (LP) model to test the impact of improved seeds, the model was specified in terms of its objective function, activities and constraints under normal conditions to determine the optimum resource allocation for specific activities for improving the income level at the household level.[6] Stated that linear programming requires the information of, the farm and non-farm activities and options with their respective resource requirements and any constraints on their production, the fixed requirements and other maximum, minimum constraints that limit family or farm production, cash costs and returns of each activity and defined objective function. In this context a linear programming model has been developed to determine the area to be used for different crops for maximum contribution and for improving farmers' income. The model expressed as follows:* Objective equation Maximize Z = ∑cjxj j = 1Subject to: ∑aijxj ≤ bi = 1 to nXj ≥ 0 all j = 1 to m non-negativity constraint activities Where: Z = Gross margin cj = Price of production activities xj = level of jth production activityaij = the ith resource required for a unit of jth activitybi = the resource available with the sample farmersj = refers to number of activities from 1 to ni = refers to number of resources from 1 to m* Constraints(i) Land∑aijxj≤ OL and ∑aijxj≤ RL,Where: OL and RL are the size of owned land and rented land holding, respectively. (ii) Family labour∑atj-htxj ≤ Lt, htxj ≤ AtWhere: Lt and At = available family labour and hired labour in the t th period. ht = is the amount of hired labour required in the t th period for jth* activity. Atj = is the amount of labour required in the t th period for jth activity.(iii) Working capital ∑kijxj ≤ WKWhere: WK = is the amount of available working capitalKij = is the amount of working capital required for production and non production activities. Working capital is the value of inputs (purchased or owned) allocated to an enterprise with the expectation of a return at a later point. The cost of working capital is the benefit given up by the farmer by trying up the working capital in the enterprise for a period of time[7].(V) Seed supply∑ Pix ≤ IMPSWhereIMPS = is the amount of improved seeds supply available with the sample farmers. Pij = is the amount of seed supply required for production activities.(vi) Crop Productivity∑Sij ≤ PDWherePD = is the amount of seed productivity available with the sample farmer.Sij = is the amount of seed productivity required for production activities. *The objective function: maximize z.Z=ax1+bx2+cx3+dx4+ex5+fx6+gx7+hx8+ix9+jx10+kx11+ LX12Where a, b, c, d, e, f, g, h, I, j, k and L are coefficients of objective function.The general formula of the inequalities: Ax1+Bx2+Cx3+Dx4+Ex5+Fx6+Gx7+Hx8+Ix9+ Jx10+Kx11+ Lx12 ≤ HWhere A, B, C, D, E, F, G, H, I, J, k and L are the coefficient of the constraints inequalities and H is the right hand side. The improved production activities and decision variables used in the study are: X1 = Millet ashana, x2 = Dura yarwasha, x3 =Dura arouselrimal, x4 = Dura arfagadamak and x5 = Dura wad Ahmed, X6 = Sesame hirhri, x7 = Sesame Obeid1, x8= Seame kenana and x9= Groundnut sodri , X10 = Cowpea ainelgazal, x11= Guar improved and x12= Okra Khartoum-red table (1).
2.2. Farm Model
This model was conducted to identify and analyze the empirical crop-mix problem of farmer who has to allocate his fixed resources like land, labor and working capital for different crops. The link between the tableau and algebraic formulations of the model can be illustrated as: twelve crops can be grown and each of which has specified per hectare requirements. Production of one hectare requires 4, 4, 5, 5, 4, 4, 4, 5, 4, 4, 4, 3, and 47, 18, 72, 42, 17, 29, 3, 29, 192, 36, 11, and 19 man hours and working capital for the above decision variables, respectively. A total of 134 man hours of labour is potentially available, being the amount provided by family workers during season. The activity gross margins in the objective function are differing for each unit hectare and groundnut is much profitable through, with a gross margin of SDG 6490.
2.3. Partial Crop Budgeting
Partial crop budgeting is another tool to determine the costs and benefits of the various alternatives ([7]. The technique for selecting costs that vary (cash costs and opportunity costs) with particular treatments being analyzed and the net benefits of each treatment is stated.
2.4. Dominance Analysis
Dominance analysis is carried out in order to rank the treatments in order of increasing costs that vary (Cash costs and opportunity costs). Any treatment has net benefits that are less than or equal to those of treatment with lower cost that vary is dominant (marked with D).
2.5. Marginal Analysis
Marginal analysis is conducted to know returns to investment and thus the less benefited treatments were eliminated by making the use of dominance analysis. Marginal rate of return indicate what farmers can expect to gain, on average, in return for their investment when they decide to change from one practice to another[7]. Marginal values were calculated as: Maximizing TPP when
 Where: TPP = total physical productivity (output price per unit)Mpp = marginal physical productivityx = input used (cost price per unit)
2.6. Sensitivity Analysis
The sensitivity analysis was done to check risk factors which cause price variability. The analysis was done assuming costs over run by 10% keeping the benefits same, and then by assuming benefits reduction by 10% keeping costs same.
2.7. Crop Productivity
Productivity is the amount of output per unit of input. It refers to the volume of output produced from a given volume of inputs or resources. Productivity used to know and explore the trend of improved seeds versus local.
3. Results and Discussion
3.1. Existing Farm Situation
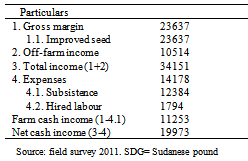
The results of this section deals with analysis of the existing farm situation of small holders in order to explore the potential for improvement in agricultural production, productivity, labour use efficiency and hence the gross margins per unit of land at household/ micro level. Farmers derived income from both farm and non-farm activities. Based on the existing farm situation and prevailing price levels, the sample farmers were obtaining SD 236367 as gross margin to cover all expenses including subsistence and livelihood requirements and hired labour expenses. Results revealed that, Farmers obtained net cash income and off-farm income of 199733 and SD105142 respectively, Table 1.Table 1. Sources of cash income and expenses of the sampled farmers (Averages taken from 2008/2009 to 2010/2011) in SDG
 |
| |
|
3.2. Optimal Solution or Plan
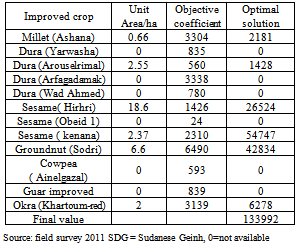
Based model was solved and the algebraic versions depend on linear programming model. The results of optimal solution or farm plan for crops with their relevant unit area hectare which presented in table 2 indicated that out of twelve only six crops were optimized and acceptable these were, millet (Ashana), Dura (arooselrima), Sesame (herhri), sesame ( kenana), groundnut (sodri) and okra (Khartoum-red) with net returns of SD 2181, 1428, 26524, 54747, 42834, and 6278, respectively. A total gross margin is equal to SDG 133992 obtained by farmers and thus groundnut is the most profitable one. This implies that the profit was maximized and gross margin increased when moved from iteration to another. Table 2. Optimal solution or farm plan for the base model in SDG/ha
 |
| |
|
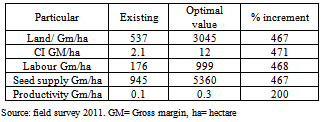
Farm income: the optimal plan under reallocation of resources indicated an improvement in gross margin and cash income per hectare by 467% and 981% or by 4.67 and 9.81 units respectively, Table 3. This indicated that agricultural production supported by improved seeds increases productivity thereby increasing farm income. Similar results were obtained by many workers[15],[16]. The references[17] reported that the adoption of improved seed is an important component of agricultural productivity, food security and sustainable economic growth.Table 3. Change in farm income under optimal base model over existing plan (Sample holdings from 2008/2009 to 2010/2011 cropping seasons) in SDG
 |
| |
|
Resource productivity: land GM/ha, cash income GM/ha, labour GM/MH, seed supply GM/ha and productivity GM/ha were increased in optimal plan by 467, 471, 468, 467 and 200% over existing farm situation. This implies that, resource productivity has a positive sign on household income. The available labour productivity of gross margin per man hour (GM/MH) was the total of man equivalent for the representative farm, Table 4.Table 4. Marginal value productivities of various resource under existing and optimal plan (Sample holding from 2008/2009 to 2010/2011 cropping seasons) in SDG
 |
| |
|
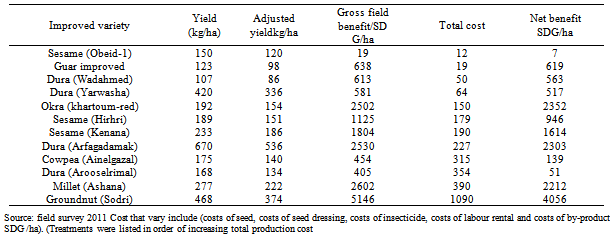
Results of partial crop budgeting indicated that all improved crops gave positive returns and the highest net returns were obtained by groundnut sodri and okra Khartoum-red, respectively. This is actually might be attributed to higher field prices and lower costs of production in such seasons, Table 5. The reference[14] mentioned that, the price fluctuation associated with low crop production. Table 5. Partial crop budgeting for different improved crops in Umruwaba locality (Averages taken from 2008/2009 to 2010/2011 cropping seasons) in SDG
 |
| |
|
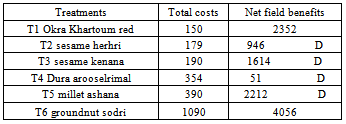
Dominance analysis was done; total costs that vary were subtracted from gross field benefit. The results revealed that Sesame herhri, Sesame kenana Dura arooselrimal and Millet ashana were dominated and eliminated by Okera Khartoum-red and Groundnut sodri and the net field benefit were highest for T6,Therefor T6 was accepted as best treatment. This result denoted that these treatments were economically efficient because it gave the highest net returns and relatively lower costs. Table 6 Table 6. Dominance analysis of improved seeds in SDG/ hectare
 |
| |
|
Bearing in mind the minimum acceptable rate of returns was assumed to be 100%. Marginal rate of returns for T6 was higher than minimum acceptable rate of returns, However T6 was emerged as the best and every SD 1.00 invested in improved seeds cultivation farmer can expect to recover the SD 1.00 and obtained additional SD 1.8113, Table 7. Table 7. Marginal analysis of improved seeds in SDG/ ha
 |
| |
|
Costs over run sensitivity analysis showed that treatment six (Groundnut soderi) is significant with MRR 165%, Table 8. Table 8. Sensitivity of marginal analysis for costs over run in SDG/ha
 |
| |
|
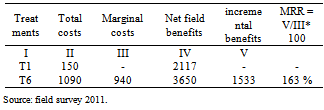
Sensitivity analysis that assumed benefits reduction by 10%, also founded that T6 was the best and highly stable among alternative with MRR 163%, Table 9. Improved seeds Productivity trend compared to local were increased in all varieties; this ensured what has been said that improved seed increases crop productivity. The role of improved seed in increasing productivity in crops recorded by many workers[8],[9],[10] in Sudan and by[12] in Guatemala. On others, hand the[11] concluded that, whatever the sources of the value of crop biodiversity test, the hypothesis observed that that the correlation between diversity and productivity is positive. Table 9. Sensitivity of marginal analysis for benefits reduction in SDG/ha
 |
| |
|
4. Conclusions
The optimal base model or farm plan for crops with relevant unit area hectare of linear programming indicated that, six crops (millet Ashana, dura Arooselrimal, sesame herhri, sesame kenana, groundnut sodri and okra Khartoum red) were optimized. And groundnut is the most profitable one. The optimal plan under reallocation of resource showed positive improvement in gross margin, cash income, and resource use and production patterns. Resource productivity of land, labor, seed supply and crop productivity were also increased in optimal plan over existing farm situation. Partial crop budgeting revealed that, all improved crops financially gave positive returns. Dominance analysis observed that, the non dominated okra Khartoum red and groundnut Sodri were obtained highly net benefit. Marginal rate of returns revealed that farmer can benefit from investment in improved seed. Results of sensitivity analysis founded highly stability among treatment six. Crop productivity trend goes up in some improved varieties compared to the local ones. Therefore, small farmers in Umrawaba locality, North Kordofan of Sudan are advised to use improved seeds versus their own seeds to increased productivity and maximized the returns.
References
| [1] | IFAD, (1999). North Kordofan Rural Development Project (NKRDP) reappraisal report, volume 1: Main report. |
| [2] | Bauer, S. and Karki, L. (2004). Rural poverty reduction through research for development and transformation. Technology adoption and household food security, Analyzing Factors Determining Technology Adoption and Sustainability of Impact- A Case of Smallholder Peasants in Nepal. Giessen University press, Germany. PP 84. |
| [3] | Muliokela, S. W. (2004). Seed utilization by small holders. Technology transfer in rural communities of sub-saharan African- seeds as a bridging tool. http:// www. Fao. Org. / ag/ AGP/ AGPS/ Abidjan/. Accessed on 9 February 2004. Golden valley Agricultural Research trust, Lusaka, Zambia, PP 2 of 12 |
| [4] | Hazell, P. B. R. and Norton, R. D. (1986). Mathematical programming for economic analysis in agriculture. Macmillan publishing company, University of New Mexico press, New York, USA. PP 1-77 |
| [5] | Grover, D. K. and Temesgen, A. (2004). Agricultural technology dissemination program. Alleviating rural poverty through efficient smallholders farming system in Ethiopia: Relevance of macro polices with ground relation. Punjab Agricultural University press, Ludhiana, India. PP 11. |
| [6] | Pomeroy, C., Gough, A., Baker, M. and Hildebrand, P. (2005). The influence of household composition upon a diversified tropical Hillside farming project. (file:// A //: / Huyam.htm). Accessed on 30 March 2005. The Dominican Republic. University of Florida press, PP 4. |
| [7] | Cimmyt, (1988). From agronomic data to farmer recommendation: An economic training manual PP 8-37. |
| [8] | El Naim, A. M, Eldey, E M, Jabereldar, A A, Ahmed, SE, Ahmed, A A. (2012). Determination of suitable variety and seed rate of sesame in sand dunes of Kordofan. International Journal of Agriculture and Forestry. 2(4): 175-179. |
| [9] | El Naim, A M, Jabereldar, A A, Ahmed, SE, Ismaeil, F. M. Ibrahim E A. (2012). Determination of suitable variety and plants per stand of cowpea (Vigna unguiculata L, Walp) in sandy soil, Sudan. Advances in life Sciences (USA). 2(1):1-5 |
| [10] | El Naim, A M; Ibrahim, I M; Abdel Rahman, M E; Ibrahim E A (2012). Evaluation of Some Local Sorghum (Sorghum Bicolor L.Moench) Genotypes in Rain-Fed. International Journal of Plant Research (USA). 2(1): 15-20. |
| [11] | Falco,S.D,Bezabih, M., Yesuf, M. (2010). Seeds for livelihood: Crop biodiversity and food production in Ethiopia. Ecological Economics 69: 1695–1702 |
| [12] | Warren,W. (2005). ALivelihoods Analysis ofSPFS-Promoted Seed Multiplication in Eastern Guatemala. LSP Working Paper 20. FAO. 2005 |
| [13] | Oyekale, A.S. and Idjesa, E.(2009). Adoption of Improved Maize Seeds and Production Efficiency in Rivers State, Nigeria. Academic Journal of Plant Sciences. 2 (1): 44-50 |
| [14] | Ojo, S.O., 2003. Productivity and technical efficiency of poultry egg production in Nigeria, Intl. J. Poultry Sci., 2(6): 459-464 |
| [15] | Awotide, B. A., Diagne, A. and Monona, B.T.O. (2002). Impact of Improved Agricultural Technology Adoption on Sustainable Rice Productivity and Rural Farmers Welfare in Nigeria: A Local Average Treatment Effect (LATE) Technique. A paper Prepared for Presentation at the African Economic Conference October 30-November 2, 2012, Kigali, Rwanda |
| [16] | Dontsop -Nguezet, P.M, A. Diagne, V.O.Okoruwa and V.E.T. Ojehomon (2011). Impact of Improved Rice Technology Adoption (NERICA varieties) on Income and Poverty among Rice Farming Households in Nigeria: A Local Average Treatment Effect (LATE) Approach. Quarterly Journal of International Agriculture 50(2011), no.3:267 291 |
| [17] | Dixon, J., L. Nalley, P. Kosina, R. La Rovere, J. Hellin, and P. Aquino, 2006. “Adoption and Economic Impact of Improved Wheat Varieties in the Developing World”. Journal of Agricultural Sciences, Vol. 144, pp. 289-502. |

 Maximizing TPP when
 Where: TPP = total physical productivity (output price per unit)Mpp = marginal physical productivityx = input used (cost price per unit)
 Abstract
 Reference
 Full-Text PDF
 Full-text HTML


