-
Paper Information
- Previous Paper
- Paper Submission
-
Journal Information
- About This Journal
- Editorial Board
- Current Issue
- Archive
- Author Guidelines
- Contact Us
International Journal of Agriculture and Forestry
p-ISSN: 2165-882X e-ISSN: 2165-8846
2013; 3(4): 185-189
doi:10.5923/j.ijaf.20130304.10
Decomposition and Nutrient Release Patterns of Some Farm Wastes under Controlled Room Temperature
 Abstract
 Reference
 Full-Text PDF
 Full-text HTML
Ipinmoroti R. R.
Cocoa research Institute of Nigeria, PMB, 5244, Ibadan
Correspondence to: Ipinmoroti R. R., Cocoa research Institute of Nigeria, PMB, 5244, Ibadan.
| Email: |  |
Copyright © 2012 Scientific & Academic Publishing. All Rights Reserved.
Decomposition rate of five commonly used organic fertilizer materials for tea production in Nigeria – cocoa husk (CH), tea fluff (TF), cow-dung (CD), poultry droppings (PD) and siam weed (SW), was determined under controlled laboratory room temperature range of 28 – 32℃ using carbon-dioxide evolution as an index, while the pH, amount of N, P and K released over four months incubation were assessed. The amount of CO2 evolved significantly (p≤0.05) increased for the first 2 months and decreased in the subsequent months for SW, TF, CH and CD, with one peak of upsurge, while it increased for PD in the 1st month, decreased in the 2nd month, increased in the 3rd month and drastically decreased at the 4th month. Carbon-dioxide evolved was highest for TF followed by CH, PD, SW, CD and least for control. Total N (151-265mg/mL), P (7.24-9.1mg/kg) and K (3.1-5.4g/kg) released and the soil pH (6.36-6.61) differed between the manures and were significantly (P≤0.05) higher compared to control with 59.0mg/mL N, 5.98mg/kg P, 2.30g/kg K and pH of 5.28. The significantly higher value of the soils amended with organic wastes for CO2, N, P and K from the onset of incubation indicated immediate commencement of nutrient release by the organic wastes, which suggests their capacity for gradual release of nutrients to meet the need of tea plants.
Keywords: Fertilizer, Crop Nutrient Supply, Incubation, Optimal Yield, Soil Organic Matter
Cite this paper: Ipinmoroti R. R., Decomposition and Nutrient Release Patterns of Some Farm Wastes under Controlled Room Temperature, International Journal of Agriculture and Forestry, Vol. 3 No. 4, 2013, pp. 185-189. doi: 10.5923/j.ijaf.20130304.10.
Article Outline
1. Introduction
- Soils under tea cultivation on the Mambilla Plateau, Nigeria are highly leached with very low N, P and basic elements[1]. The quantity of tealeaf currently produced from the area is just about 20% of the present demand by tea processing industries in the locality[2]. This supply is grossly inadequate, which was attributed to low tealeaf production as a result of nutritional problems[2]. Fertilizer rates of 150 kg N, 30 kg P and 30 kg K ha-1 year-1 have been established for consistent optimal tealeaf harvest on the Mambilla Plateau[1], which were based on the use of inorganic fertilizers. Unfortunately, fertilizer supply has been inadequate, erratic and costly to be procured by the peasant poor resource farmers for the past few decades[3]. Their usage over time makes the soil moribund andunsuitable to grow tea and or other crops[4]. Unfortunately, tea cannot grow economically without fertilizer application[5]. Fertilizer application amounts to over 50% of the total annual farm inputs in tea production[6]. Nigerian farmers have been advised on the use of readily available farm wastes as alternative sources of nutrient supply on tea farms in order to remain in production at optimal profit, and to maintain good physical, chemical and biological conditions of soils under tea cultivation[7]. There are arrays of farm wastes that are used to advantage on cultivated lands in Nigeria for arable and tree crops[8, 9, 10] but the most readily available and commonly used on tea farms includes cocoa husk, cow-dung, poultry droppings and tea fluff[2, 7]. The rates of mineralization and nutrient release patterns of the farm wastes have not been adequately studied. This investigation was conducted to determine the decomposition rate and nutrient release patterns of these farm wastes using CO2 evolution and amount of nutrients released as indices
2. Materials and Methods
- The decomposition rate of five organic materials which are common sources of nutrient supply to tea farms were assessed using the CO2 evolved and the amount of nutrient released over the months of incubation in the laboratory as indices with the following procedures:
2.1. Carbon Dioxide Evolution Study
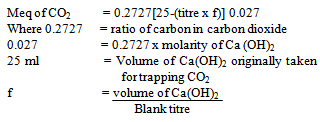
- Carbon dioxide evolution study was carried out according to procedure previously described[11]. Fifty grams of 2 mm sieved topsoil were weighed into each of 24 incubation flasks, with four flasks representing each of the five organic material types and the control with no amendment. Each of the milled organic materials was weighed and mixed with the soil in the flasks at the rate of 10 tones ha-1 (0.25g 50 g-1 soil). The flasks’ contents were moistened to 70 % water holding capacity of the soil and incubated in the laboratory at room temperature (28 – 32℃). The moisture content of the flasks was adjusted fortnightly with de-ionized water and the carbon dioxide evolved from the flasks was led through a delivery tube into a bottle containing 25 ml of 0.1 M Ca (OH)2. The amount of carbon dioxide evolved was determined by titration with 0.05 N HCl, usingphenolphthalein as indicator.The amount of carbonate formed was calculated using the following equation[11]:
2.2. Nutrient Release Patterns during Incubation in the Laboratory
- Sieved (2 mm) topsoil (40 g) + river sand (10 g) were weighed into each of 96 Petri dishes and arranged in 6 rows of 16 Petri dishes per row. Each row was labeled against a manure material and the control. The manures were added to their representative row of dishes at 0.25 g/dish and the Petri dishes were randomly arranged on the laboratory bench. The contents of each Petri dish were mixed thoroughly and moistened periodically to keep contents at 70% water holding capacity and allowed to remain at room temperature. Four Petri dishes were retrieved per treatment monthly and the contents transferred into 100 ml beakers at soil/water ratio of 1:2.5, and the pH determined using pH meter. The beaker contents were then leached into separate 100 ml volumetric flask, using funnel fitted with What-man 42 filter paper and filtrates analyzed for total N, NO3-- N, NH4+ N, P using Vanado-Molybdate method calorimetrically and K contents by flame photometer. Statistical analysis of variance was used to determine significant mean differences, which were separated using Duncan Multiple Range Test {DMRT} at p< 0.05.
2.3. Soil and Organic Materials Analysis
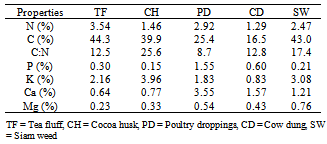
- Determination of the initial nutrient contents of the soil and organic materials used for the study were carried out as follow: The soil pH was measured electronically with glass electrode pH meter in soil/water ratio of 1:2.5. organic carbon was determined by wet oxidation method[12], total N by microjeldahl digestion, while available P was determined colorimetrically by molybdenum blue method[13]. The exchangeable cations were extracted by leaching 5 g soil with 50 mL of 1N NH4OAC at pH 7 and the K in the leachate was determined with flame photometer, while Ca and Mg were measured by atomic absorption spectrophotometer (AAS). Total N of the organic material samples was determined by Kjeldahl method; the P, K, Ca and Mg were determined after wet digestion using acid mixtures. The P was determined using Vanado-molybdate yellow method and read using UV-VIS recording spectrophotometer (UV – 2400PC) at 420 nm, the K by flame photometer, while the Ca and Mg were by AAS.
3. Results and Discussion
3.1. Nutrient Contents of Soil and Organic Materials
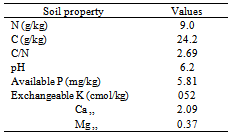
- The soil organic carbon and total soil N contents were 24.2g/kg and 9.0g/kg soil respectively with C: N ratio of 2.69 (Table 1). The soil organic carbon and total soil N contents were below the 30.0 and 10.0 gm kg-1 soil ideal for suitable soil for tree crop production[14]. The P value of 5.81 mg/kg was moderate, while the K, Ca and Mg contents of 0.52, 2.09 and 0.37 cmol/kg respectively were all below their soil critical values of 1.2, 8.0 and 0.80 cmol/kg soil respectively[14]. This suggests the need to increase the soil organic matter (SOM) content in order to allow for optimal and sustainable cropping on the soil. The low nutrient content of the soil is a general characteristic of most Nigerian soils[15] which indicates that the soil could not be cropped profitably without fertilizer application for optimal plant growth and productivity, however, the soil pH value of 6.2 was optimum for tea cultivation.
|
|
3.2. Carbon Dioxide Evolution Study
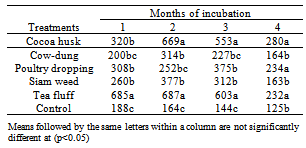
- The amount of CO2 evolved increased for the first 2 months and decreased in the subsequent months for SW, TF, CH and CD, with one peak of upsurge. For PD, the CO2 evolved had two peaks of upsurge (Table 3). It increased for the first month, decreased in the second month, increased again at the 3rd month and drastically decreased at the 4th month. The TF gave the highest amount of CO2 evolved and was followed by CH, PD, SW, CD and control in descending order. The organic materials produced significantly (p< 0.05) higher amount of CO2 than the control. The higher values of CO2 released by the manures over the control might probably be due to upsurge in the microbial population and the resultant increase in their activities that might have taken place in the amended soils. The reduction in CO2 evolved after the initial upsurge indicated that the more rapidly oxidize-able labile contents like sugars, starch and cellulose had been exhausted. The upsurge in CO2 values after initial decline indicated that the high molecular weight carbohydrates and lignin were being decomposed[18, 19]. Higher values of CO2 evolved in the organic material-treated soils over the control from the onset indicated that decomposition commenced immediately the organic materials were added to the soil. Continual decrease in CO2 values from the 3rd month and thereafter showed that decomposition of the organic materials had attained a peak after which their nutrient contents could be made available for crop plants usage.
|
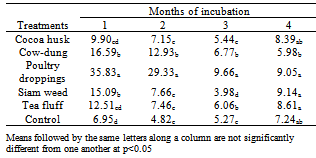
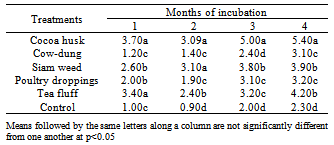
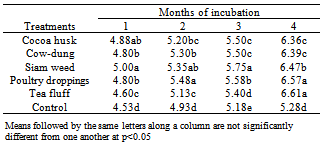
3.3. Nutrient Release Patterns of Manures and PH Change over Four Month’s Incubation
- The NO-3 –N released by the soils amended with manures were significantly (p<0.05) higher than the control (Table 4). The difference was between 29-200 % over the control after one month incubation. Total N released by the manures treated soils was significantly (p<0.05) higher than for the control. The NO-3 –N constituted about 98.01 - 99.96 % of the total N released. At the second month, NO-3 - N generated by soils treated with manures were higher than for control by a range of 6.41 – 287.91 %. The NH4+ - N content produced by TF was highest compared to other treatments. The NO-3 – N constituted 98.41 - 99.91% of the total N. At the third month, the results showed that CH, PD and control resulted to decrease in the amount of NO-3 – N released compared to the preceding month, whereas CD, SW and TF gave increased values. The NO-3 – N generated by manure treated soils were between 21.9 - 880.82% higher than for control, while NH4+ - N values were higher than values obtained for previous months. Total N generated showed that 91.45- 100% was made up of NO-3 – N. At the end of fourth month the NO-3 N generated decreased across the manure treated soils and control. Tea flush (2 leaves + bud) harvest is carried out forthrightly with great demand for NO-3 N. The higher quantity of total N and more importantly NO-3 N in the organic material treated soils indicated that the organic wastes could readily supply the N need of tea plants. However, rational use of the organic wastes is needed to checkmate excess release of NO-3 N that could be detrimental to the environment through underground water pollution[20].
|

|
|
|
4. Conclusions
- Based on the trend of CO2 evolved and pattern of N, P and K released over the incubation period, it suggests that mineralization and nutrient released by the evaluated farm wastes would be without inhibition on the field for eventual crop benefits. The quantum of NO-3 N would be enough to meet the high demand of tea for N. Its gradual release is advantageous especially for tea plants with long gestation period.
ACKNOWLEDGEMENTS
- Authors acknowledged the permission of the Executive Director of Cocoa Research Institute of Nigeria to publish this work.