-
Paper Information
- Next Paper
- Paper Submission
-
Journal Information
- About This Journal
- Editorial Board
- Current Issue
- Archive
- Author Guidelines
- Contact Us
International Journal of Agriculture and Forestry
p-ISSN: 2165-882X e-ISSN: 2165-8846
2013; 3(3): 71-76
doi:10.5923/j.ijaf.20130303.01
Effects of Human Induced Activities on Carbon Emission in Chittagong District, Bangladesh
 Abstract
 Reference
 Full-Text PDF
 Full-text HTML
Mustainur Rahman1, Monzer Hossain Sarker2, Tamanna Hossen2
1USDA funded project “Degradation of upland watershed in Bangladesh”, Institute of Forestry and Environmental Sciences, University of Chittagong, Chittagong-4331, Bangladesh
2Department of Environmental Science, Stamford University Bangladesh
Correspondence to: Monzer Hossain Sarker, Department of Environmental Science, Stamford University Bangladesh.
| Email: |  |
Copyright © 2012 Scientific & Academic Publishing. All Rights Reserved.
The study was conducted in the Chittagong Division including Hasnabad, Feni, Heyanko, Ichamoti, Chuniti, Fatickchari and Mandakini area. The aims of this study were to find out the effects of deforestation and clear felled effects on carbon sequestration in upland watershed of Bangladesh. Soil bulk density was 1.40 g cc-1 in natural forest, 1.52 g cc-1 in clear felled area and 1.33 g cc-1 in deforested land. Mean carbon storage in natural forest was 21.85 t ha-1 of which Hasnabad block, 22.56 t ha-1, Feni block 21.76 t ha-1, Heyanko Block 22.17 t ha-1, Ichampti Block 19.80 t ha-1, Chuniti Block 21.17 t ha-1, Fatickchari Block 23.26 t ha-1and Mandakini Block 21.57 t ha-1; in clear felled area mean carbon was 17.67 t ha-1 of which Hasnabad block, 16.68 t ha-1, Feni block 20.58 t ha-1, Heyanko Block 14.47 t ha-1 and Ichampti Block 18.92 t ha-1; mean carbon sink in deforested land was 17.71 t ha-1 for Chuniti Block 16.33 t ha-1, Fatickchari Block 17.67 t ha-1and Mandakini Block 16.33 t ha-1.
Keywords: Natural Forest, Deforested Land, Bulk Density, Moisture Content, Carbon Emission, Organic Carbon Stock
Cite this paper: Mustainur Rahman, Monzer Hossain Sarker, Tamanna Hossen, Effects of Human Induced Activities on Carbon Emission in Chittagong District, Bangladesh, International Journal of Agriculture and Forestry, Vol. 3 No. 3, 2013, pp. 71-76. doi: 10.5923/j.ijaf.20130303.01.
Article Outline
1. Introduction
- Carbon dioxide (CO2) cycles naturally between the atmosphere and the biosphere as a result of photosynthesis, respiration, decomposition and combustion. The amount of carbon in an ecosystem changes as it develops and evolves[1]. Carbon is absorbed by water, phytoplankton and vegetation, creating significant stores in the oceans, biomass and soils. Globally, soils contain about three times the amount of carbon in vegetation and twice that in the atmosphere[2,3]. Human activities are changing directly and indirectly the rate of CO2 exchange[2] and the amount of stocks[1] by reducing the capacity of ecosystems to sequester and store CO2 and by producing significant greenhouse gas (GHG) emissions due to the burning of fossil fuels and to land clearance and deforestation[4]. Agriculture is the second largest source of greenhouse gases in the UK but emissions in this sector have been declining steadily since 1990[5], mainly as a result of changes in agricultural practices, such as reducing the use of synthetic fertilizers[6]. Land management choices can either maintain or increase the carbon store for long periods of time or result in net emissions. Therefore, land use and management choices can have an important role in determining the amount of carbon released into the atmosphere or stored in the soil (mitigation) and, as a consequence, in global climate regulation[7, 8]. Land use change, such as deforestation and agricultural intensification, is a major source of global emissions (about 1.8 Gt C yr-1)[2]. There is also increasing evidence that degraded peatlands are a significant source of CO2 emissions[8]. Carbon storage by marine and coastal habitats has been less studied than terrestrial stores, but recent evidence[9] indicates that they may be of comparable importance to terrestrial stores. In addition to local impacts on ecosystems, deforestation causes global impacts by emitting carbon dioxide and other greenhouse gases that cause climate change. Greenhouse gas emissions from human activities have increased to 9 billion ton carbon per year entering the atmosphere at twice the rate at which vegetation and oceans can naturally sequester carbon[10]. The increase in atmospheric carbon dioxide has raised global mean surface temperature 0.7 ± 0.2 ºC in the 20th Century, while continued emissions at current rates could raise global temperatures 1.8–4ºC in the 21th Century[10]. Climate change is damaging ecosystems and human wellbeing by shifting vegetation, increasing wildfire, raising sea level, and intensifying storms[10]. Fossil fuel power plants, vehicles, and cement plants produce approximately 80% of global carbon emissions while deforestation produces approximately 20%[10]. At the same time, deforestation decreases the provision of ecosystem services, including watershed protection and biodiversity conservation. In response, natural resource management agencies and conservation organizations are implementing forest conservation and reforestation projects to conserve ecosystem functions and to reduce climate change through carbon sequestration. For this reason measurement of carbon storage in soil is very important. Thus this study was launched to find out carbon storage in different type of land use.
2. Material and Method
2.1. Site Description
- The study included four pair of natural or plantation forest and clear felled Blocks of Chittagong North Forest Division, namely, Hasnabad Block, Feni Block, Heyanko Block and Ichamati Range under Chittagong North Forest Division. Thus, four pair of blocks lies between 22°18′N to 22°38′ N latitudes and 91°58′ E to 92°90′ E longitudes. And three pair of natural or plantation forest and deforested blocks, namely Fatickchari, Mandakani and Chuniti blocks range under Chittagong Forest Division. Thus, three pairs of blocks lies between 22° 08'N to 220 48'N latitude and 91° 58'E to 92° 05'E longitude.
2.1.1. Hasanabad Block
- Hasanabad Forest Block was under Chittagong North Forest Division. This block contained a pair of site, representing one natural forest and one clear felled area.Natural forest site: This site was near to the office of Hasnabad Forest Range having a patch 10 year old natural garjan forest on flat hill top at 37 m elevation of 37 m. Previously this site was under mixed forest of Dipterocarpus turbinatus (garjan), Syzygium grande (dhaki jam) and Artocarpus chaplasha (chapalish). Canopy coverage of natural garjan forest was 90% with few scattered undergrowth. Undergrowth was mainly of Calamus guruba (jalibet) and seedlings of Dipterocurpus turbinatus. Forest floor was covered with thick layer of fresh and partially decomposed litter. Clear felled area: Clear felled site was 50 m west of the patch of natural garjan forest having similar elevation and topography. Previously clear felled area was covered with garjan, which felled in 2006. Undergrowth coverage of clear felled area was 10% with few scattered vegetation, mainly of Calamus guruba (jail bet). Litter coverage thickness at this area was very thin compared to natural forest.
2.1.2. Feni Block
- Feni Forest Block was also in Chittagong North Forest Division. This contained a pair site, representing one plantation and one clear felled area.Plantation site: This plantation was situated at the southern side of the Bhanga to wer under the Feni block at Korerhat sadar Beat and Range. This was 41 year old Tectona grandis (teak) plantation and established in 1966. Plantation site was lying on the middle part of 17% hill slope. Coverage of plantation was 60% with Imperata cylindrica (sungrass) as characteristic undergrowth in the plantation. Other under growth species were bhat, dhumki etc.
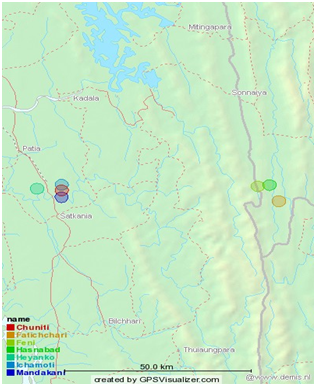 | Figure 1. Map of the study area |
2.1.3. Hyanko Block
- Hyanko Forest Block was situated at Chittagong North Forest Division. This contained a pair of site, representing one plantation and one clear felled area.Plantation: This plantation was situated at the southern part of the Koila Bazaar under the Hyanko Block and Beat in Korerhat Forest Range. This was 25 year old garjan plantation, established in 1982. This site was on middle part of 19% hill slope. Canopy coverage of site was 90% and undergrowth consisted of Calamus guruba (jalibet), Melastoma malabathricum (bon tejpata) and different kinds of herbs.Clear felled area: This was a 2003 clear felled area, 200 m south side of garjan plantation. Before clear felling 40 year old teak plantation was present there and then planted with teak, garjan, mahagoni, dhaki jam, champa, chickrassi, arjun, haritaki etc. This site was on middle of 15% hill slope. This site possessed 60% canopy coverage with undergrowth mainly of Imperata cylindrica (sungrass), Melastoma malabathricum, Calamus guruba etc.Feni Forest Block was also in Chittagong North Forest Division. This contained a pair site, representing one plantation and one clear felled area.
2.1.4. Ichamoti Block
- Study sites both 1956 teak plantation and clear felled areas were situated at Thandachori block of Ichamoti beat. Administratively, this site is situated at Rajanagar union under Rangunia Upazilla in Chittagong District. Rangunia Upazilla lies between 22°18′N to 22°38′ N latitudes and 91°58′ E to 92°9′ E longitudes.Plantation site: Plantation began in 1949 with Teak Garjan, Horitaki, Bohera, Arjun, Jarul, Telsur, and Sal, which till now continued. Plantation site was lying on the middle part of 17% hill slope. Coverage of plantation was 60% with Imperata cylindrica (sungrass) as characteristic undergrowth in the plantation. Other under growth species were bhat, dhumki etc.Clear felled area: This was a clear field area, 70 m west of teak plantation. This site was also on mid hill of 20% slope. Tree canopy coverage at this site was 8% and undergrowth mainly Imperata cylindrica (sungrass), dhumki and Citrus lemon (lemon).
2.1.5. Hazarikhil
- The present study site is situated at Hazarikhil Beat and Range, under Chittagong North Forest Division. The total forest area in Hazarikhil Range is 4255 ha, legal status of which is a reserve forest. The Hazarikhil Range is situated at 45 km north of Chittagong city.Deforested land: Hazarikhil was under Chittagong North Forest Division. This location contained 5 pair sites representing natural forest and deforested land. The deforested sites were of 15, 23, 33, 38, and 43 years old. Sampling points in the natural forest and deforested land were at least 50 m inside from the boundary to avoid interaction between the two land use types. Natural forest: Natural forest consisted of a mixture of different species in association with bamboo jungle having 97% vegetation coverage. In deforested land coverage was 20%, each for trees, shrubs and herbs. At Hazarikhil soil sampling was done from 0-5 cm and 5-15 cm depth.
2.1.6. Mandakini
- Mandakini was under Chittagong North Forest Division. This location contained a pair of site representing one natural forest and one deforested land. Both deforested land and forest land covered an area of 25 ha. Plantation site: Plantation was 9 year old mixed species consisted of Acacia auriculiformes (Akashmoni) and Acacia mangium (Mangium). This site was situated on the southern side of Mandakini Beat office on 15% slope with 70% canopy coverage. Undergrowth covered area was not uniform over the whole plantation. Undergrowth in this plantation included Mimosa pudica (Lajjabati), Caealpinia cristael (Kootumkanta), Hyptic sauveolens (Tokma), Eupatorium odoratum (Assamlata) etc. with a number of vines and creepers. Spacing of the trees in the plantation was 2 m 2 m. The number of trees were 1650 /ha with an average height of 9.5 m.Deforested land: In deforested land had no tree and undergrowth consisted of Mimusa pudica (Lajjabati), Caealpinia cristael (Kootumkanta), Eupatorium odoratum (Assamlata), Mikania cordata (Tarakanta) etc. At Mandakini soil sampling was done from 0-10 cm and 10-30 cm depth both from plantation and deforested land.
2.1.7. Chuniti
- The study area was located at Chunuti Beat and Range under Chittagong South Forest division. The Chunuti wildlife sanctuary covered a total area of 7764 ha of reserved forest under the Chittagong forest division[14].Deforested land: The land was 500m apart and to the west of the first deforested land. The topography of this land was also hilly and lied at an elevation of 20m. The distance from the adjacent wildlife sanctuary land was 180m and to the east of the first deforested land. According to records of Chunuti Forest Range, the site was deforested in the beginning of 1978 and therefore the deforestation age of this land was 27years. The land was sampled on 5th January 2005.Natural forest: On this land, only 20% species was natural and 80% species artificially planted by Forest Department in 1977. The land was also hilly with an elevation of 30m. the dominant species of this land was Garjan (Dipterocarpus turbinatus). The land was sampled on 13th January 2005.
2.2. Selection of Site
- Two adjacent sites were selected from each Block, one from clearfelled area and another from adjacent natural forest or plantation and similarly one from deforested land and another from adjacent natural or plantation forest. Adjacent sites were having more or less similar topography and site conditions. Thus 14 sites were selected from 7 Blocks.
2.3. Soil Sampling
- In both clear felled and plantation area, 8 soil profiles were dug at a distance of 20 m from each other. Sampling plots in clearfelled area and another from adjacent natural forest at least 50 m inside from the boundary to avoid any boarder effect. Similarly, 6 soil sample were collected in both deforested and natural or plantation forest. From each profile soils were sampled at a depth of 0-15 cm. About 1kg soil was collected from each depth into appropriately labeled air tight plastic bags and carried to the laboratory for subsequent analysis. About two kilogram of soil was collected from each depth into appropriately labeled air tight plastic bags and carried to the laboratory for subsequent analysis.
2.3.1. Determination of Bulk Density
- For the determination of bulk density, 2 undisturbed soil cores were collected from each sample plot in the field from upper 0 - 4 cm depth. Thus, 14 samples were collected from plantation/natural forest land and another 14 cores from clear felled and deforested areas in each sampling season. For bulk density sampling, cores were driven vertically into the soil using a wooden hammer. The cores were then carefully dug out using a sharp knife and excess soil from the bottom end was removed before the soil from each core placed into a labeled plastic bag. The field moist soil cores were then weighed, allowed drying in an oven at 105℃ for 8 hours, cooled in a desiccator and reweighed. Both the field moist and oven dry weights of the cores were divided by the volume of each core (100 cm3) to determine wet and dry bulk density, respectively.
 W1 = Weight of core W2 = Weight of core + dry soil V = Volume of core (100 cm3)
 2.3.2. Determination of Soil Moisture
- For determination moisture content of soils at different depth, soil taken on the pre-weighted Petridis. It keeps in an oven at 105℃ for 8 hours; cooled in a desiccators and weight again[16]. For calculating moisture content following calculations were used:Calculation
 Where, W1= Weight of petridish W2 = Weight of petridish +field moist soil W3= Weight of petridish +dry soil
2.3.3. Determination of Organic Carbon in Soil
- For determination organic carbon of soils, washed silica crucibles were dried in oven at 105℃ for 30 minutes, cooled in desiccators and then weight were taken. Dried soils were grind by pistol and then exactly 5g of grind soil were kept in silica crucibles and weighted by an electric balance. The crucibles with soils were then transferred to an electric muffle furnace for igniting at 850℃ for one and half an hour. Then crucibles with soils were cooled in a desiccators and reweight to determine the percent loss of ignition (LOI %). Percentage of LOI was calculated as follows:
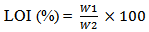 Where, W1 = Loss in weight and W2 = weight of oven dry soilPercentage of carbon calculated from the following relationship[15].Organic carbon (%) = 0.476 × (% LOI – 1.87)
3. Results and Discussion
3.1. Natural Forest and Clear Felled Area
3.1.1. Bulk Density
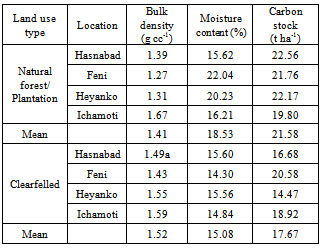
- Bulk density of the soil was lower in natural forest/plantation than the adjacent clearfelled sites in all the four blocks (Table 1). Mean bulk density of the surface soil was 1.39 g cc-1, 1.27 g cc-1, 1.31 g cc-1 and 1.67 g cc-1 respectively, for the natural forest/plantation sites, while their corresponding values in the clearfelled sites were 1.49 g cc-1, 1.43 g cc-1, 1.55 g cc-1 and 1.59 g cc-1 in four blocks of Hasnabd, Feni, Heyanko and Ichamoti respectively. Higher bulk density in the clearfelled sites may be due to lesser amount of organic matter, excessive erosion, logging operation in clearfelling etc., which increased the compaction of surface soil.
3.1.2. Moisture Content
- Mean moisture content was higher in natural forest/plantation sites compared to clearfelled sites in all the four blocks (Table 1). Mean moisture content of the natural forest of Hasnabad Block was 15.62% while in adjacent clearfelled site it was 15.60%. In Feni Block mean moisture content was 22.04%, while their corresponding values in adjacent clearfelled site was 14.30%. In Heyakhon Block mean moisture content in plantation was 20.04%, while in adjacent clearfelled site it was 15.56%. In Ichamoti block mean moisture content in plantation was 16.21%, while in adjacent clearfelled site it was 14.84%. The lower value of moisture content in the clearfelled sites was due to the increased evaporation of soil moisture in absence of forest cover.
|
3.1.3. Organic Carbon Stock
- In all the four Blocks organic carbon content was higher in natural forest/plantation compared to clearfelled sites in both surface and sub-surface soil (Table 1). In natural forest of Hasnabad Block organic carbon content was 22.56 t ha-1, while their corresponding values were 16.68 t ha-1 in adjacent clearfelled site. In Feni Block organic carbon content of soil in plantation was 21.76 t ha-1, while their corresponding values in adjacent clearfelled site was 20.58 t ha-1. In Heyanko Block organic carbon content in plantation was 22.17, while their corresponding value was 14.47 in adjacent clearfelled site. In Ichamoti block organic carbon content in plantation was 19.80 t ha-1, while their corresponding value was 18.92 in adjacent clearfelled site. Reduction of organic carbon was associated with burning following clear felling and lesser amount of litter accumulation.
3.2. Natural Forest and Deforested Land
3.2.1. Bulk Density
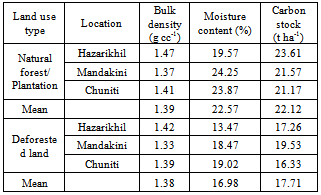
- Bulk density of the soil was higher in natural forest / plantation than the adjacent deforested sites in all the three blocks (Table 2). Mean bulk density of the surface soil was 1.47 g cc-1, 1.37 g cc-1 and 1.41 g cc-1 respectively, for the natural forest/plantation sites, while their corresponding values in the deforested sites were 1.42 g cc-1, 1.33 g cc-1 and 1.39 g cc-1 in three blocks of Hazarikhil, Mandakani and Chuniti respectively. Higher bulk density in the deforested sites may be due to lesser amount of organic matter, excessive erosion, logging operation in deforested etc.
3.2.2. Moisture Content
|
3.2.3. Organic Carbon Stock
- In all the three Blocks organic carbon content was higher in natural forest/plantation compared to deforested sites in both surface and sub-surface soil (Table 2). In natural forest of Hazarikhil Block organic carbon content was 23.26 t ha-1, while their corresponding values were 17.67 t ha-1 in adjacent deforested site. In Mandakani Block organic carbon content of soil in plantation was 21.57 t ha-1, while their corresponding values in adjacent deforested site was 19.53. In Chuniti Block organic carbon content in plantation was 21.17 t ha-1, while their corresponding values were 16.33 t ha-1 in adjacent deforested site. Reduction of organic carbon was associated with deforested land and lesser amount of litter accumulation.
3.3. General Discussion
- Many areas of upland watershed in Bangladesh are now being clear felled or deforestation. Few studies so far have been conducted to find out clear felling and deforestation effects on soil properties in this region. From the study, it is clear that both the clear felling and deforestation have negative impact on soil. Both the practices reduce the quality of soils. A better quality soil ensures a better forest cover. But in our country both the practices are increasing day by day. For facing the population pressure, most of the forests are being destroyed by clear felling. This practice gives possibility for the human encroachment which is dangerous for the protection of forest. In the clear felled area, there was no undergrowth as well as ground vegetation at the time of initial sampling i.e.just after clearfelling. In teak plantation area, negligible amount of undergrowth or ground vegetation was present. In the clearfelled site due to clearing of the vegetation had no vegetative cover and in the teak plantation, naturally coming vegetation was less. After one and half year, the clear felled area was covered with grass and various weeds heavily which indicated that sunlight made the environment favourable for weed growth. Takahashi and Ikeda[12] also reported that weed vegetation regrew quickly from the second year of clearfelling. Presence of lesser amount of organic matter in the later sampling also suggested that clear feling decrease humus content of soil. Findings of litter thickness and accumulation of dry litter value also suggested for the presence of lesser amount of humus layer. Leblance[13] also reported that clearfelling teared up the humus layer and exposed the mineral soil. Sienkiewicz (1988) also reported a small but degraded trend for changes in humus content.Deforestation is a problem not only confined to Bangladesh but also a problem of global concern. World’s forest recourses are now depleting at an alarming rate .The problem is more serious in Bangladesh comparing to global perspectives. The most striking evidence of this is high and increasing rate of deforestation that has reached 3.3% during 1981- 1990, thus resulting in a total loss of 8300 ha. The corresponding rate for south Asian countries is 0.6%.the estimated annual loss due to deforestation presently varies 0.5-to 1.5% of GDP.
4. Conclusions
- Forestry appears to offer a relatively low-cost approach to sequestering carbon. The most serious problems with using forestry to sequester carbon would occur if forestry activity were truly undertaken on a very large scale. Rapid deforestation and clear felling reduce the opportunity to absorb carbon from atmosphere and stored in soil. For that cause create different environmental problem such as climate change and global warming. Plants acts as a medium for transfer of atmospheric carbon into the soil in the form of carbon-containing compounds. It`s contribute significant quantities of carbon deposited in sub-surface soil. These deposits have the potential for a greater contribution to long-term soil carbon sequestration due to slow oxidation than surface soil. The exact amount of sequestration depends on land-management practices, climate and the amount and quality of plant and microbial inputs. Carbon sequestration will certainly contribute in reducing atmospheric CO2 concentration and will mitigate drought, salinity stress and desertification. Thus, sequestered soil carbon may be used for agriculture, forestry and help to mitigate global climate change.
ACKNOWLEDGEMENTS
- The authors would like to acknowledge Professor Dr. S.M. Sirajul Haque, Institute of Forestry and Environmental Sciences, University of Chittagong for his inspiration and suggestive criticism in conducting the research and preparing the report.