-
Paper Information
- Previous Paper
- Paper Submission
-
Journal Information
- About This Journal
- Editorial Board
- Current Issue
- Archive
- Author Guidelines
- Contact Us
International Journal of Agriculture and Forestry
p-ISSN: 2165-882X e-ISSN: 2165-8846
2012; 2(6): 315-323
doi: 10.5923/j.ijaf.20120206.09
Carbon Inventory Methods in Indian Forests - A Review
 Abstract
 Reference
 Full-Text PDF
 Full-Text HTML
Akhlaq A. Wani 1, 2, P. K. Joshi 3, Ombir Singh 1, Rajiv Pandey 4
1Silviculture Division, Forest Research Institute, Dehradun 248006 India
2Krishi Vigyan Kendra, Pombay, P.O. Gopal Pora, Sher-e-Kashmir University of Agricultural Sciences and Technology of Kashmir, J&K, 192233, India
3Department of Natural Resources, TERI University New Delhi , 110070, India
4Department of Forestry, Post Box No: 59, HNB Garhwal University Srinagar Garhwal Uttarahand, 246174
Correspondence to: Akhlaq A. Wani , Silviculture Division, Forest Research Institute, Dehradun 248006 India.
| Email: |  |
Copyright © 2012 Scientific & Academic Publishing. All Rights Reserved.
Under the United Nations Framework Convention on Climate Change (UNFCC), participating countries are required to report national inventory of greenhouse gas (GHG) emissions or uptake. The current challenge is to reduce the uncertainties in producing accurate and reliable activity data of Carbon (C) stock changes and emission factors essential for reporting national inventories. Improvements in above ground biomass estimation can also help account for changes in C stock in forest areas that may potentially participate in the Clean Development Mechanism (CDM), REDD plus and other initiatives. The methods adopted for such estimations vary with respect to geography, objective of the study, available expertise, data and scientific excellence adopted. However the current objectives for such estimates need a unified approach which can be measurable, reportable, and verifiable. This might result to a geographically referenced biomass density database for tropical forests that would reduce uncertainties in estimating annual biomass increment and forest aboveground biomass. In the light of above requirements, this paper intends to present an overview of the methodologies adopted in India from local to country level estimates to assess C sequestration potential in different forest components. The paper also discusses remote sensing and Geographical Information System (GIS) initiatives taken in this field and the possibility of adopting an integrated approach for reliable, accurate and cost effective estimates.
Keywords: Carbon Inventory Methods, Forests, Biomass, CDM, REDD Plus
Cite this paper: Akhlaq A. Wani , P. K. Joshi , Ombir Singh , Rajiv Pandey , "Carbon Inventory Methods in Indian Forests - A Review", International Journal of Agriculture and Forestry, Vol. 2 No. 6, 2012, pp. 315-323. doi: 10.5923/j.ijaf.20120206.09.
Article Outline
1. Introduction
- At the first Conference of Parties (COP), which took place in Berlin in 1995, the parties agreed that the specific commitments of the convention for the Annex I parties were not adequate because they were too vague and after two and a half year of intense negotiations, the Kyoto protocol was adopted at the third COP on 11 December 1997 in Japan. This protocol is the first international implementation of a cap and trade scheme. Kyoto Protocol in its Article 12 of Clean Development Mechanism (CDM) allows Annex I countries to achieve ‘additional’ emissions and reduction in non-Annex I countries. Forests play a critical role[1] in stabilizing CO2 concentration for it acts as significant source of global CO2 and also provides opportunities to act as sink through soil, vegetation and wood products. Intergovernmental Panel on Climate Change (IPCC) provides us the guidelines for estimation of Carbon (C) inventory for land use change and forest sector[2] and for agriculture, forest and other land uses[3] and good practice guidance for land use, land use change and forestry (LULUCF) sector[4]. Adoption of C inventory methods and guidelines should lead to accurate, reliable and cost effective estimates of C stocks and changes for a given land use system and period[5]. Implementation of sustainable C forestry and C storage led forest management in India warrants for specific research support for status monitoring and technology generation. Considerable variations in terms of assumptions and estimates on C sequestration call for standardization of estimation of C estimation emissions for forest and other resources and land-use changes[6]. Worldwide numerous ecological studies have been conducted to assess C stocks based on C density of vegetation and soils[7,8,9]. The results of these studies are not uniform and have wide variations and uncertainties probably due to aggregation of spatial and temporal heterogeneity and adaptation of different methodologies[10].Five pools have been identified in Marrakech Accord viz. above ground biomass, below ground biomass, soil carbon, dead organic matter and litter. Among these only those pools need to be measured and monitored under CDM which are most likely to be impacted by the project activities. Various methods are available for estimation of carbon and flux in these pools but these methods vary on account of accuracy, precision, cost and scale of application. The broad categories of programmes requiring carbon inventory[5] are for national green house inventory, climate change mitigation projects, Clean Development Mechanism projects, projects under the global environment facility and forest grassland and agroforestry development projects. Hence, it becomes extremely important for a developing country like India where there is an excellent opportunity of having 26 million degraded land as a potential storage for carbon to evolve and refine the methodology as per the objectives. The present paper gives an insight into the varied methodologies adopted by different workers as per their objectives of study for estimations at various levels related to carbon in India. India having diverse vegetation coupled with variation in climates, the inventory experts need to explore all sources of information from all local sources and create data bases on the basis of inventory parameters (pools) and factors like growth rates, wood density etc. to improve the quality of carbon inventory.
2. Biomass Carbon
- Biomass is defined as the total quantity of live and inert or dead organic matter, above and below the ground, expressed in tones of dry matter per unit area, such as hectare. (Biomass carbon = above ground biomass carbon + below ground biomass carbon + dead organic matter). Above ground biomass is the most important visible and dominant C pool in forests and plantations, although not in grasslands and croplands5.
2.1. National Level Estimates
- A study was conducted[10] to estimate contribution of India’s forests from 1995 to 2005 towards C sink using secondary data of growing stock from various sources. Suitable biomass increment values (expansion and conversion for calculating total tree above ground biomass) and the ratio of below and above ground biomass (for calculating total tree biomass above and below ground) as available in different studies covering a range of forest types of the country were used with a conservative value of C 40 % and 20 % of moisture content on dry basis (mcdb) for realistic estimations[11,12].
 Spatial data bases of climatic, edaphic, and geomorphologic indices, and vegetation were used to estimate the potential carbon densities (without human impacts) in above and below ground biomass of forests in 1980. All data were processed in GIS environment[13]. Land use data and carbon estimates for South and Southeast Asia were collected and analysed to help reduce the uncertainty associated with the release of C in the atmosphere caused by land use change. The database was developed in Lotus 1-2-3 TM using a sequential bookkeeping model. The source data were obtained from historical and geographical documents (Fig. 1)[14]. The total amount of C sequestered in live vegetation of each ecological zone for 1880, 1920, 1950, 1970 and 1980 was calculated using the equation as
  Where total C stock of vegetation at time i (TCi) is calculated based on Lji which is the total C (above and below ground) in vegetation type j at time i. Aji is the area in vegetation of type j at time i and n is the total number of land use categories within the zone.
  | Figure 1. Flow sheet illustrating spreadsheet methodology used in analysis of changes in land use changes and C (Source: Richards and Flint)[14] |
 Similarly[15,16] a book keeping model was developed that tracks the C content of each hectare disturbed by human activity. In another study[17] estimated forest cover, growing stock and biomass for the year 1984. This was done at state level for the entire country using information available from the vegetation maps, thematic maps and ground forest inventory collected by Forest Survey of India (FSI). For this purpose all the states and union territories were divided into grids of 2.50
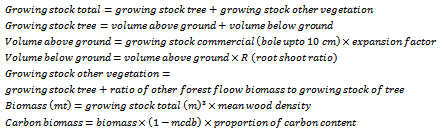
  2.50. Data was collected for parameters related to growing stock from 170000 grids. The growing stock of each state was estimated by calculating the number of grids for each combination of density and forest composition. The volume per ha (termed as wood volume factor) for a particular combination of density and forest composition was generated using data of forest inventory surveys. Three wood volume factors were calculated for each stratum and density class for each map sheet for each state. The estimated volume (or growing stock) was converted into biomass by using specific gravity[18,19] of dominant tree species in each grid and C stock was computer employing the formulae,
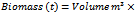
 .A study was conducted[20] to estimate C flux through litter fall in forest plantations in India. Data on 24 species from 82 stands was tabulated so as to cover the entire country. Mean litter fall (total and alone) from the plantation was computed. A C fraction of 0.45 was used for converting litter fall to C flux. Above ground biomass was recorded at the site for shrubs and grasses whereas standard relationship was used to record tree biomass at the site in arid and semi arid areas of Rajasthan and 0.48 part of C was assumed in vegetation on dry weight basis[21].In another study CO2 FIX a stand level simulation model[22] was used to quantify the carbon storage and sequestration potential of selected tree species in India using published data on growth rate and biomass with a carbon factor of 50%. Allometric equations[23] (models) have been suggested for national level studies in estimating Above ground tree biomass (AGTB) developed[24] on the basis of climate and forest stand types. Biomass stock densities are converted to carbon stock densities using the default carbon fraction[2] of 0.47. Furthermore root-to-shoot ratio value[25] of 1:5 was suggested to estimate below-ground biomass as 20% of above-ground tree biomass. Carbon sequestration projected 26] upto year 2050 has been calculated for forestry options under different land use scenarios in India from standing biomass, wood products and fossil-fuel use and the equation used is carbon = carbon in standing biomass + carbon in wood products + carbon in fossil fuel. Carbon in standing biomass is determined by multiplying the area of each land use category by its average biomass and then multiplying the sum by the carbon content of biomass, which is assumed to be 0.5. If there is an insufficient amount of fuel wood in the project region, the model automatically begins to burn fossil fuel which results in increasing carbon emissions[26]. The model estimates the amount of carbon sequestered by approximating land use and relative biomass changes in the landscape over time.
 2.2. Regional Level Estimates
- Carbon mitigation potential[27] and cost effectiveness of different tree of medicinal importance of Haryana have been estimated for a period of 30 years (2008-2038) using spreadsheet model (PRO-COMAP), acronym, Project Based Comprehensive Mitigation Assessment Process. The model uses data on selected carbon pools as collected from the field, viz. above ground biomass, below ground biomass, soil carbon and woody litter along with data on costs and benefits. Above ground biomass was calculated by laying quadrates and Mean Annual Increment (MAI) was calculated using volume equations as given in Forest Survey of India publication[28]. Below ground biomass was has been calculated using IPCC default value which is above ground biomass x 0.27 and carbon[2] sequestered was obtained after multiplying the biomass with 0.45). For soil organic carbon three samples were taken from each quadrant and samples were collected at the depths of 15 cm, 30 cm and 45 cm and Walkley’s method was used for estimation of Soil Organic Carbon (SOC). A similar study[29] was carried out to estimate eligible carbon pools under CDM for medicinal trees of Haryana in which observations on growth (height, girth and crown cover) of selected plantation interventions was taken as per the structured data sheets. For calculation of Mean Annual Increment (MAI) of plantation intervention on private lands restricting to bund plantations, it was assumed that the farm size will be 0.25 ha (50 x 50 m) and 32 trees would be planted at a spacing of 7 m as commonly practiced in that area. Biomass expansion factor and wood density have been used as per good practice guidelines by IPCC. Default value of 0.27 has been for below ground carbon and SOC has been calculated as per Walkley’s method. Spreadsheet model PRO-COMAP was used for data analysis.
2.3. Local Level Estimates
- A study[30] was conducted to evaluate C sequestration through community based forest management in Sambalpur Forest Division Orissa. Two villages with total area of 200 ha were selected on the basis of number of years for which the allotted peripheral reserved forests have been protected. Quadrates were laid and observations were recorded for girth and height for each species of trees, shrubs and herbs. The data collected during 1997-98 was used for the estimation of growing stock and other indices. The growing stock was calculated using the regression equation[31] as (Standing Woody Biomass (tonnes/ha) = -1.689 + 8.32
 BA).Sequestration potential of natural forests in seven village forests of Chindwara Forest Division of Madhya Pradesh was estimated for different density classes using harvested method of stratified tree technique. Quadrates were laid and sample trees were felled and roots excavated for determination of above and below ground biomass. The whole tree biomass without foliage was recorded for different components viz. twigs, branches, bole and roots and presented on oven dry weight basis[32]. In a study carried out to find[33] C content of some forest tree species the plant samples of various parts were subjected to oven drying. Calcium was estimated by flame photometer and C was carried out using Walkley and Black’s rapid titration method and regression equation method developed between Calcium and C of various tree components. Ash content method was also used to estimate C. In another study[34] to access carbon sequestration potential under agroforestry in Rupnagar district of Punjab PRO-COMAP (Project based Comprehensive Mitigation Analysis Process) model was used for the period (2005-2030) as also suggested by Ravindranath[35] and five sample plots of 0.1 ha each were selected for measurements. Below ground biomass was calculated as AGB
  0.26. Sequestered carbon was calculated in the model by multiplying the dry biomass with a default value of 0.45. In a study[36] to assess comparison between different methods for estimation of biomass in a forest ecosystem it was concluded that stratified tree technique is the best but urged to develop estimating equations of wide applicability to obtain reliable estimates of stand biomass without destructive sampling. Carbon allocation in different parts of three year old agroforestry species was studied[37] adopting destructive method of sampling. Field measurements taken were fitted into regression equation with a general form factor of 0.5 regardless of the actual form or taper[38]. The carbon and nitrogen content percent in each plant component was estimated on CHNS analyser. Similarly destructive sampling[39] was adopted to assess carbon sequestration potential of selected bamboo species of Northeast India. Total dry biomass of sample component was calculated by multiplying weight of oven dry sample with total fresh weight of plant component and divided it by fresh weight of plant sample component taken. The total oven dry weight of each component was then multiplied by the total number of plants in that category. Carbon content was estimated by indirect method[40] using a factor of 0.48.
3. Remote Sensing and GIS Based Estimates
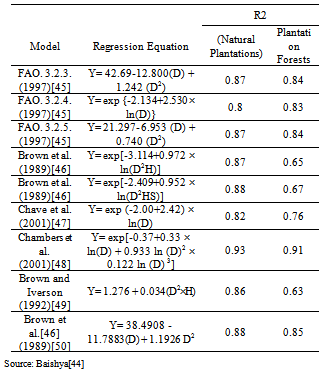
- A study was conducted on biomass distribution of natural and plantation forests of humid tropics in northeast India using GIS and different types of forests were mapped using IRS LISS III imageries through supervised classification and a forest type map within the study area was prepared. Sampling of vegetation in the two forests was carried out by belt transect method. Because of high species richness in tropical forests, it is difficult to use species-specific regression models, as used in the temperate zone[41,42,43]. Therefore, mixed species tree biomass regression models (Table: 1) were used for AGB estimation of natural and plantation forests[44].Geospatial technology[50] was used to estimate C stock in natural forests of Eastern Ghats Tamil Nadu. IRS 1D LISS III digital data and Survey of India topo sheets were used to prepare the forest cover density map and plot sampling technique was followed to estimate the stand density. Volume of about 1000 trees was estimated using Smalian’s formula by Chaturvedi and bi-variate equations were derived using calculated volume, girth at breast height (gbh) and height for different girth class. Volume was multiplied with wood density to obtain biomass. C was obtained following standard methodology[51] by with 49.1 as the conversion factor.On the basis of thematic maps prepared by FSI and survey done by FSI for forest inventory, growing stock, ground biomass and C stock was determined[52] for the assessment years 1979-1981 and 1994-1995 for a particular combination of density and forest composition in Ranchi district. Estimated volume of growing stock was converted to biomass based on specific gravity[18,19] of dominant tree species in each grid and dry biomass was multiplied by the factor 0.48 for estimating Carbon[40]. Similarly satellite data was used in a study[53] to estimate carbon pool in Govind Wildlife Sanctuary and National Park to generate forest type and density maps by visual and digital interpretation methods. Field measurements of height and girth were taken to calculate volume of sample plots of 0.1 ha using the site specific volume equations provided by FSI. Volume was multiplied with specific gravity to obtain biomass and later the results of biomass were extrapolated in the stratified forest type map. Carbon from biomass was calculated and the minimum value of 48 % was adopted as the conversion factor[51]. All above ground woody components have been assumed to have 47-50 % organic carbon[54].
|
4. Soil Organic Carbon
- After careful comparison of the different international standards to be followed for forest carbon estimation, the carbon fraction (CF) 0.47 default value[2] is proposed to convert the biomass value of standing trees into carbon stock[23]. A study[60] was carried out to estimate soil organic carbon store in different forests of India for which map sheets of all the states/UTs of the country were marked with 2.5’ x 2.5’ (latitude and longitude) grids. Data on the extent of forest cover, forest stratum, density and volume per ha for each grid were collected. The major forest stratum in grid was marked using thematic maps prepared by FSI (forests of India have been stratified into 24 species strata). Grid volume for a grid was calculated stratum wise. Map sheet wise addition of growing stock for all the map sheets falling in a particular state/UT gives the total estimated growing stock of that state. Soil Organic Carbon (SOC) values under different forest species in various locations in India were collected from published literature in different journals, reports, books etc.Six different eco zones were selected in arid and semi arid areas of Gujarat and Rajasthan and data presented for only common access resources. Soil samples were collected in triplicate from each type of land upto 75 cm depth divided into 0-25, 25-50 and 50-75 cm soil layers and analysed for SOC[21]. A study recommended[23] the collection of soil samples at 0-10, 10-20, and 20-30 cm depths and calculation of carbon stock density[62] as
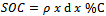 , where, SOC = soil organic carbon stock per unit area[t ha-1],
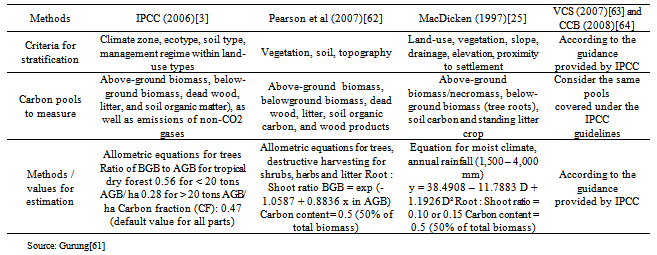
 = soil bulk density[g cm-3], d = the total depth at which the sample was taken[cm], and %C = carbon concentration[%]. Different although not too different methodologies have been adopted in various studies[61] and methods vary in the choice of stratification, measuring carbon pools and values or factors of estimation (Table: 2).In a study to assess carbon sequestration potential in Rupnagar district of Punjab[34] samples were drawn from each selected plantation and soil from within a depth of 30 cm and soil carbon was analysed by Walkley and Black rapid titration method[65]. In another study C sequestration potential in natural forests of Tamil Nadu[50] was studied using digital data and Survey of India topo sheets and adopted systematic sampling technique to collect soil samples at pre-determined sampling points. Soil samples were collected from three layers and after analysed using the equations as:
|
 Where, SOC = Representative soil organic carbon content for the forest type and soil of interest, tonnes C(ha)-1, SOC = Soil organic carbon content for a constituent soil horizon, tonnes C(ha)-1, (SOC) = Concentration of SOC in a given soil mass obtained from analysis, g C (kg soil)-1, Bulk Density = Soil mass per sample volume, tonnes soil m-3 (equivalent to Mg m-3), Depth = Horizon depth or thickness of soil layer, m, C fragments = % volume of coarse fragments/100.In another study[69] to estimate soil organic carbon pool under different land uses in Champawat district of Uttarakhand the same methodology and equations were used. In an experiment to assess carbon sequestration potential in Himalayan region of Himachal Pradesh, split plot design[70] was adopted to assess carbon sequestration potential in Himalayan region of H.P. using six land use systems viz. natural grassland, Hortipastoral, Agriculture, agri-horticulture and agri-horti-silviculture each system replicating thrice. Agroforestry system formed the main plot and soil sampling depth as sub plot. The soil organic pool expressed as Mega grams ha-1 for a specific depth was computed[71] by multiplying the soil organic carbon (g kg-1) with bulk density (g cm-3) and depth (cm). A study[9] was carried out in India’s forests for the assessment of forest carbon stocks using primary data for the soil carbon pool. The study covered a total of 571 samples in forest area and 101 additional samples in the nearby non-forest areas collected from a pit of 30 cm wide, 30 cm deep and 50 cm in length .Soil organic carbon was estimated by standard Walkley and Black method and bulk density was estimated using standard Clod method.
 5. The Way Forward
- Worldwide numerous ecological studies have been conducted to assess carbon stocks based on carbon density of vegetation and soils[6,7,8]. The results of these studies are not uniform and have wide variations and uncertainties probably due to aggregation of spatial and temporal heterogeneity and adaptation of different methodologies[9]. A participatory approach for forest boundary delineation should be adopted by involving GIS experts, forest technicians, and members of community forest user groups (CFUGs). High- resolution satellite images printed on a large scale can be to find the different land cover and natural boundaries and to trace individual forest blocks easily. For establishment of baseline scenario of the area local socio economic situation and regional economic trends should be taken into consideration. To create uniformity in estimations the IPCC Good Practice Guidelines 1996, 2003 and 2006 must be adopted as per requirement; however an integrated approach to combine various methods is necessary for specific studies for which guidelines are not addressed. It is further reported[10] that IPCC guidelines till now do not provide guidance on certain methods and parameters. The use of GIS technology offers an approach to develop a biomass map of forests. It can be extended to areas in which data are not available because consistent patterns of biomass density frequently result from similar biophysical characteristics in the study area. A geographically referenced biomass density database for tropical forests would reduce uncertainties in estimating annual biomass increment and forest aboveground biomass.
ACKNOWLEDGEMENTS
- The authors are highly thankful to the concerned persons to allow reproducing the tables from their works in the present study and to the anonymous reviewers for their useful comments.