International Journal of Agriculture and Forestry

p-ISSN: 2165-882X    e-ISSN: 2165-8846

2012;  2(6): 300-306

doi: 10.5923/j.ijaf.20120206.06

Thresholding and Fuzzy Rule-Based Classification Approaches in Handling Mangrove Forest Mixed Pixel Problems Associated with in QuickBird Remote Sensing Image Analysis

Othman Mohd , Nanna Suryanna , Shahrin Sahib Sahibuddin , Mohd Faizal Abdollah , Siti Rahayu Selamat

Faculty of Information and Communication Technology, Technical University of Malaysia Melaka, 76100 Melaka, Malaysia

Correspondence to: Othman Mohd , Faculty of Information and Communication Technology, Technical University of Malaysia Melaka, 76100 Melaka, Malaysia.

Email:

Copyright © 2012 Scientific & Academic Publishing. All Rights Reserved.

Abstract

Mangrove forest is an important costal ecosystem in the tropical and sub-tropical coastal regions. It is among the most productivity, ecologically, environmentally and biologically diverse ecosystem in the world. With the improvement of remote sensing technology such as remote sensing images, it provides the alternative for better way of mangrove mapping because covered wider area of ground survey. Image classification is the important part of remote sensing, image analysis and pattern recognition. It is defined as the extraction of differentiated classes; land use and land cover categories from raw remote sensing digital satellite data. One pixel in the satellite image possibly covers more than one object on the ground, within-class variability, or other complex surface cover patterns that cannot be properly described by one class. A pixel in remote sensing images might represent a mixture of class covers, within-class variability, or other complex surface cover patterns. However, this pixel cannot be correctly described by one class. These may be caused by ground characteristics of the classes and the image spatial resolution. Therefore, the aim of this research is to obtain the optimal threshold value for each class of landuse/landcover using a combination of thresholding and fuzzy rule-based classification techniques. The proposed techniques consist of three main steps; selecting training site, identifying threshold value and producing classification map. In order to produce the final mangrove classification map, the accuracy assessment is conducted through ground truth data, spectroradiometer and expert judgment. The assessment discovered the relationship between the image and condition on the ground, and the spectral signature of surface material in identifying the geographical object.

Keywords: Mangrove, Remote Sensing Satellite Image, Threshold, Fuzzy Rule-Based Classification

Cite this paper: Othman Mohd , Nanna Suryanna , Shahrin Sahib Sahibuddin , Mohd Faizal Abdollah , Siti Rahayu Selamat , "Thresholding and Fuzzy Rule-Based Classification Approaches in Handling Mangrove Forest Mixed Pixel Problems Associated with in QuickBird Remote Sensing Image Analysis", International Journal of Agriculture and Forestry, Vol. 2 No. 6, 2012, pp. 300-306. doi: 10.5923/j.ijaf.20120206.06.

1. Introduction

Mangrove area is an important costal ecosystem in the tropical and sub-tropical coastal regions. It is among the most productivity, ecologically, environmentally and biologically diverse ecosystem in the world. Managing of mangrove is challenging and complex balancing between ecosystem protections and enabling human to enjoy and use these natural resources. Knowledge to obtain information on ecosystem including mangrove community is important.
With the improvement of remote sensing technology, it provides the alternative for better way of mangrove mapping because covered wider area of ground survey. Furthermore it reduces human energy, time and cost. The information from remote sensing satellite has been recorded remotely andtransformed into remote sensing images. The information that may be generated is directly linked the related characteristics of the images and produces spatial resolution (pixel size), spectral resolution (wavelength ranges utilized) and spatial extend (ground area represented). Reflectance from each pixel is measured at many narrow, contiguous wavelength intervals. Nevertheless the increasing of spatial resolution associated with most satellite sensor systems imaging is higher than the normal sizes of object on the ground.
Image classification is the important part of remote sensing, image analysis and pattern recognition[1]. It is defined as the extraction of differentiated classes; land use and land cover categories from raw remote sensing digital satellite data. The image classification also offered the opportunity to recognize and individualize objects such as individual trees species, buildings, roads, and so on. The techniques of image classification can be divided into supervised classification and unsupervised classification[2] stated that one pixel in the satellite image possibly covers more than one object on the ground, within-class variability, or other complex surface cover patterns that cannot be properly described by one class. Although the detail information is recorded, yet there have a serious problem to recognize a particular geographical object due to overlapping of two or more associated spectral properties. A pixel in remote sensing images might represent a mixture of class covers, within-class variability, or other complex surface cover patterns. This pixel cannot be correctly described by one class. These may be caused by ground characteristics of the classes and the image spatial resolution. Since one class cannot describe these pixels, thresholding is most applicable methods used to separates the problems of overlapping pixel.
It is widely accepted that selection of correct threshold will lead to good extraction of object[3]. Unfortunately according to Hong Yan,[4] the main issue is to choose an optimal threshold value so that the misclassification of image pixels is kept as low as possible. According to[5], although many and good training areas are selected, misclassification occurs to some extent in case of classification of mangrove area by any classifiers. It is because there are pixels having similar spectral reflectance in the categorized area such as land area, mangrove forest and water.
Fuzzy logic theory have been widely use in variety of problem domain. It has invaded a lot of fields such as fuzzy control systems, fuzzy image processing and predictably, fuzzy classification of remote sensed data. The use of fuzzy rule-based classification has become of great interest because of its capacity to provide more useful information for geographic information systems[6]. The fuzzy rule-based classification, or pixel unmixing, estimates the contribution of each class in the pixel.[7] stated that in supervised classification, mixed pixels usually result in misclassification since the mixed pixels are different spectrally from pure pixels of the individual vegetation types. With fuzzy classification, mixtures estimation, spectral mixture analysis and subpixel classification information is obtained about the fraction of different classes within a mixed pixel.
This paper discusses on the use of thresholding selection techniques and fuzzy rule-based classification to identify landcover and mangrove species using QuickBird satellite image. The main focus of this study is to classifying mangrove species using two different thresholding methods; as well as to improve the accuracy of mangrove species through the development of new optimal threshold technique base on Fuzzy rule-based classification. Furthermore the classification results obtain from these methods will be validating through ground truthing data and expert judgement before producing the final mangrove mapping. By doing this; it should help the administrator to distinguish mangrove species group and to identify the wavelength regions that defines the inherent spectral curve between each mangrove species.

2. Related Works

Part of this paper is intended to discuss the state of art the combination between thresholding techniques and fuzzy rule-based classification which at the end will provide information of the proposed algorithm for mangrove classification. In other words, they are many techniques have been studied but the decomposition of mixed pixel problem using thresholding techniques and fuzzy rule-based classification still have need more attention for both the ongoing and future research.
Mangrove forest consists of particular dominant species plays an important role to protect shoreline from erosion, to stabilize banks and coastlines besides it become home to many types of animals. The remote sensing satellite is an excellent tool and has been used for monitoring land use and obtaining data for defining deforested areas and to update management plans of mangrove forest. Research that has been conducted shows that a variety of sensors and image processing methods have been used in the remote sensing of mangroves[8]. In addition remote sensing sensor allows information to be gathered from areas that would otherwise be, logistically and practically, very difficult to survey. Furthermore the improvement of remote sensing satellite technology offered the opportunity for better way of mangrove mapping.
Many research has been conducted by previous researchers related to the application of remote sensing and aerial photograph techniques for mangrove for example [9],[10],[11] and etc. According to[12], improvement of land cover classification of remote sensing images (QuickBird, Ikonos, Spot 5 and etc) especially for mangrove can be potentially be made by using techniques such as soft computing, segmentation and classifications. In addition the use of remote sensing images offered many advantages especially to study mangrove areas effectively, besides to manage and monitor changes over time, accurate and fast.
The use of remote sensing satellite tools and its application is excellent and are well established for mangrove mapping at the fundamental level[13]. Unfortunately there is an increasing demand for detailed mangrove maps at the community or species level mainly for studying mangrove ecosystems and their diversity. According to[14, 15], the remote sensing satellite images have not been extensively used for mapping mangrove species due to the limited spectral and spatial resolution of conventional imagery. Hence, there is a need to use advanced remote sensing techniques to be explored for the purpose of mangrove mapping at a finer level.
Many researchers in remote sensing keep improving classifier because the mixed pixel influenced by the precision of object recognition and classification but to become an obstacle to the quantification analysis in remote sensing images. The mixed pixels lead to error that make the subsequent area estimation inaccurate because of mixed pixel is assigned to only one class, in fact it belongs to two or more classes[2]. It is important to identify right satellite sensor base on research conducted. For example, use of medium resolution, Landsat TM and SPOT 4 with 30m and 20m spatial resolution can produce one pixel with purely one class type or one pixel with two or more classes’ type.
Figure 1 show the boundaries between different class types and small area of class. In most maps, boundaries are drawn as lines but in reality the boundaries are typically zones that separate between classes. Methods ofclassification can be classified in unsupervised classification, supervised classification and hybrid approaches which combination between unsupervised and supervised methods [7]. Mixed pixels in unsupervised classification are typically dealing by using mixed labels, i.e. forested/mangrove, because there is no method for extracting information about the amount of each species using traditional per-pixel classifiers. While in supervised classification, mixed pixels usually produce misclassification because the mixed pixels are different spectrally from pure pixels of the individual classes. Therefore according to[7], the problem of mixed pixels normally dealing with fuzzy classification, mixtures estimation, spectral analysis and subpixel classification[15].
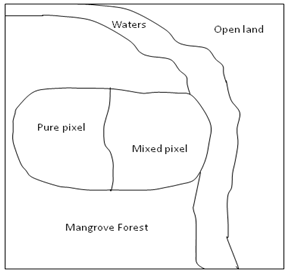
Figure 1. Boundaries between different class types and small area of class
The accuracy of the final map is affected by the ability of the classification method to distinguish[8] between various classes type. It is important to classify satellite images using right thresholding techniques to produce an accurate threshold value of each class.[5] conducted research using Landsat TM 5 satellite image to decide threshold in order to avoid the misclassification and to prepare data sets for quantitative estimation of stand parameters on mangrove forest. Further research conducted by[16] was implement Receiver Operating Characteristic analysis curve techniques to select threshold and improve classification to determine mangrove and non-mangrove areas Northwestern Mexico Coastal Zones.[17, 18] have studied about classification algorithm and development of understanding system for remote sensing images. They have been considered the spectral features in different regions. It was expected that the spectral features for one object are similar and the spectral features are different for different objects. However in the commonly cases, the spectral features for the same objects are often different because of the shadow of mountains, the difference for image acquiring time and etc., in the other hand, the spectral features for different objects are the same in sometimes because of the image resolution.
In the studied conducted by[19] a thresholding technique was used to classify the fraction images into five classes after faction images using linear spectral mixture analysis. Furthermore the thresholds were initially selected through the examination of sample plots with window size of 3 x 3 pixels on the fraction images, i.e. based on the statistical analysis of mean and 2.5 standard deviation by considering a minimum and maximum from the selected samples for each land cover class.
Image classification can be divided into 2 methods; unsupervised and supervised. In an unsupervised method the numerical information in the spectral data classes are firstly been group. It then matched by the researcher to information classes. To determine the natural groupings or structures in the data, the clustering algorithms are used. The researcher decide how many groups or clusters are to be identify for in the data, the parameters related to the separation distance among the clusters and the variation within each cluster. With the application of the clustering algorithm, the iterative clustering process may result in some clusters to be combined, or some clusters may be further broken down. Thus, unsupervised classification is not completely without human intervention. It does not require training areas, just the number of classes researcher would like to end up with[1].
Another method used for image classification is called supervised classification; the identification and location of some of the land cover types are known a prior. Researcher identifies in the imagery homogeneous representative samples or training areas of the different surface cover types of interest. Furthermore the selection of appropriate training areas is based on the analyst's familiarity with the geographical area and their knowledge of the actual surface cover types present in the image. The researcher is supervising the categorization of a set of specific classes. The classification algorithm is trained to perform land cover classification of the rest of the image.
The classification method allocates only the class dominates that pixel, however and ignores other class within the pixel. These leads to a loss of information when there are mixed pixels. The traditional classification mapping with one-pixel-to-one-class algorithms normally fail to deal with the mixed pixels. Normally complex land surface often causes the mixed pixels in the remote sensing image if the image pixel size is not good enough to catch the spectral response from only a single land class. For example, a mixed pixel may contain the spectral responses from both grass and underlying soils. According to[1], fuzzy classification has been used to deal with mixed pixel problem that allows every pixel has a membership value between 0 and 1 for every candidate class.
In the classification of remote sensing images, Wang proposed a supervised mode for fuzzy classification. Mannan et al. applied fuzzy neutral networks to the classification of multi-spectral images. Foody et al found that the fuzzy membership values for each cover class strongly correlate with the actual ground proportions of those land cover classes. In complex fuzzy systems, manual determination and optimization of fuzzy membership parameters is impossible. It is desirable that knowledge automation be incorporated into existing fuzzy systems in order to make the benefits of fuzzy rule-based classification available to remote sensing satellite image classification.

3. Proposed Approach and Classification Algorithm

Remote sensing image with high resolution provides valuable data for land-use mapping, environmental monitoring, disaster management and etc. The efficient decision processes can be achieve if the full value of these data explore and the appropriate information can be extracted and presented in standard format. One of the processes used for extracting information from these images is based on classification or clustering.[20] stated classification is the process of automatically grouping a given set of data with similar characteristics will belong to the same cluster. It is usually based on object's attributes. However the process of image classification for remote sensing image is based on multispectral analysis of the pixels.
Thresholding techniques is fast and simplest technique which is commonly used in many image processing[21]. Thresholding techniques are image segmentations based on image-space regions. According to[22, 23], it is a process of separation a digital image into equally exclusive and unique areas.
The selection of correct threshold will lead to good extraction of objects. A review of various methods of image thresholding by[24], mention that thresholding is when there is only a single threshold or T, an object point is any point (x, y) for which f (x, y) ≥ T; and a background is a point (x, y) if f (x, y) < T. Research conducted by[5], use the threshold values from Landsat TM satellite image to separate whole target area into three parts; land area, waters and mangrove forest. Furthermore research from[16] using Landsat TM satellite image found that selection of a classification threshold according to the uncertainty level is a main advantages for mangrove ecosystem.
Fuzzy logic theory have been widely use in variety of problem domain. Fuzzy set theory and fuzzy logic are ideally suited for dealing with uncertainty and imprecision (Krishnapuram, 1998) and (Sugeno, 1985). It has invaded a lot of fields such as fuzzy control systems, fuzzy image processing and predictably, fuzzy classification of remote sensed data. The use of fuzzy classification has become of great interest because of its capacity to provide more useful information for geographic information systems. The fuzzy classification, or pixel unmixing, estimates the contribution of each class in the pixel. It assumes that a pixel is not an indecomposable unit in the image analysis and, consequently, works on a new principle: “one pixel to several classes” to provide more information about the pixel unlike the hard classification methods which are poor in information extraction.
Taking above explanation on the advantage of threshold technique and fuzzy rule-based classification techniques, therefore the proposed algorithm has adopted both threshold and fuzzy rule-based classification techniques. The propose steps of QuickBird image algorithms is illustrated in Figure 2.
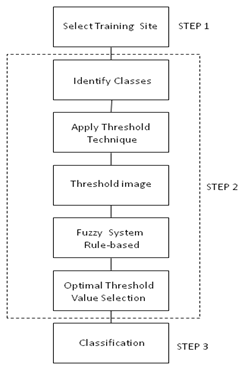
Figure 2. Propose steps of QuickBird image algorithms of pre-processing, features extraction using threshold and fuzzy rule-based classification
The proposed steps of image classification algorithm using QuickBird are divided into three main steps.
Step 1: Selecting training site
This step involved the process of identifying area of interest to conduct the research. The process of image pre-processing process was carried out previously.
Step 2: Identifying threshold value
This step involved five main processes; identifying classes, applying thresholding techniques, selection of good threshold, applying fuzzy rule-based classification and finally selection of optimal threshold value.
i. The processes of identifying classes were representing each known land cover classes through analysis to the land use map. It comes out with the homogeneous characteristics on the image.
ii. Applying the thresholding technique is a process to obtain a value of each class of land cover. In this study, the global and local adaptive threshold technique is used.
iii. The threshold values obtain from global and local threshold technique will be compared. The good threshold value will be applied to the existing satellite image.
iv. The problem of overlapping pixel or mixed pixel will be carried out by fuzzy rule-based classification.
v. Finally the optimal threshold value will be selected and apply to existing satellite imagery.
The global and local adaptive threshold is use to obtain the first threshold value of each class. The global thresholding selects a single threshold value from the histogram of the entire image. It is simpler and easier to implement but its result relies on good illumination. For visual inspection applications, where non-uniform illumination is usually not an issue, global thresholding is commonly used for its simplicity and speed.
The study by[25] concluded that the Otsu method[26] was one of the better threshold selection methods for general real world images with respect to uniformity and shape measures among the global thresholding techniques. The Otsu method works well when the images to be threshold have clear peaks and valleys. In other words, it works for images that their histograms show clear bimodal or multimodal distributions. This method selects threshold value that maximizes the between-class variances of the histogram[27].
[27] stated that local thresholding uses localized gray-level information to choose multiple threshold values; each is optimized for a small region in the image. Local thresholding methods can deal with non-uniform illumination but they are slow. The local thresholding method sets the threshold value dynamically according to the local characteristics to achieve a good separation[28] between classes.
The overlapping pixel or mixed pixel problem after thresholding techniques to produce the final classification will be carried out using rule-based classification. While each class description contains a set of fuzzy expressions let the evaluation of specific features and their logical operation. The control knowledge is represented clearly by a set of rules. Each rule is making up of a condition and an action part. The condition is formulated by the means of parameters or class descriptors. The classification rules formulation is carried out by the context information and relationships of the classes. This algorithm can be used to automatic selected the optimal threshold values for each features and the results.
Step 3: Producing classification map
In this step, the optimal value identified from step 2 will be used in the satellite image to produce the classification map as shown in Figure 2. Then, the accuracy assessment is conducted as depicted in Figure 3 to finalize the optimal threshold value for classification map. The final classification map then is constructed by comparing the optimal value with the results of ground truth, spectroradiometer and expert judgment.
Figure 3 depicts the process of accuracy assessment conducted in order to construct the classification map. Accuracy assessment is an important part in the image classification procedure of the classified image. According to[29], accuracy is considered to be the degree of closeness of results to the values accepted as true. The example of the accuracy assessment methods are: the variance analysis, minimum accuracy value used as an index of classification accuracy, spatial error and class attribute errors, a probabilistic approach for change detection and land cover classes are abstraction and generalizations of the real world in order to provide discrete values for continues.[30] stated that the classification accuracy assessment generally comprises three basic components: sampling design, response design, and estimation and analysis procedures. According to[31] the major components of a sampling strategy include sampling unit (pixels or polygons), sampling design, and sample size. Research conducted by[32] stated the most frequently used method in accuracy assessment is the error matrix. While[19] added one critical step in accuracy assessment is to select a sufficient number of test sample plots for each class with a suitable sampling method. Random or stratified random sampling approaches are often for a robust assessment of classification results.
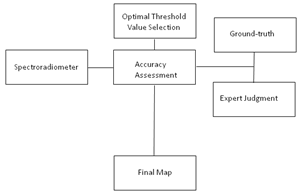
Figure 3. Propose Accuracy Assessment
In this research, the accuracy assessment consists of ground truthing, expert judgement and identifying the spectral reflectance signature through spectroradiometer as discussed in the next subsection.
a. Ground truthing
Field data or ground truth consists of observations collected at or near ground level in support of remote sensing analysis. Accurate ground truth permits the analyst to match points or area on the imagery to corresponding regions on the ground surface. It needs to establish with confidence relationships between the image and conditions on the ground. Ground truth data are important for classifying the data to informational classes and for assessing classification accuracy[33]. In remote sensing, it is important in order to relate image data to real features and materials on the ground. Hence the collection of ground-truth data enables calibration of remote-sensing data, and aids in the interpretation and analysis of what is being sensed.
b. Expert Judgment
The critical part during field work was to identify and differentiate the object for example shadow and soil, mangrove and other tress, and between the mangrove species. Therefore to conduct this research it required an assistance of expert judgment or experience staffs from State Forestry Department, it makes the process of identification mangrove species and other object faster and valuable. The process of identify species was conducted thru tree leaves and their bark[34].
c. Spectral reflectance signature throughSpectroradiometer
The spatial resolution of satellite remote sensing system is too low to identify many objects by their shape or spatial detail. Therefore the measuring of spectral signature of surface materials, such as vegetation, soil and water, over the spectral range in Figure 4 is used to identify and delineate geographical object.
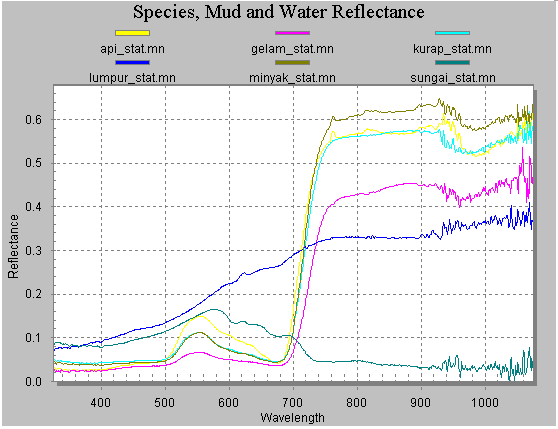
Figure 4. An example of reflectance spectra of six materials: Four types of mangrove species, mud and water

4. Concluding Remarks

In this paper, the mangrove classification approach through threshold techniques and fuzzy rule-based classification is proposed. It took the advantage of combination of thresholding techniques and fuzzy rule-based classification to improve the accuracy of the final classification map. Algorithm is considered potentially applicable to extract information on geographical object recognition from QuickBird images.

ACKNOWLEDGEMENTS

This project is supported financially by a research short grant from UTeM, Durian Tunggal, Melaka. Valuable supports also received from FTMK particularly for allowing us to use fully facilitated Research and Development Lab, Forestry Department Peninsular Malaysia, Malaysia Remote Sensing Agency, and Department of Land and Survey Malaysia.

References

[1]  Jindal, S., and Josan, G., "Neural Network and Fuzzy Logic Approach for Satellite Image Classification: A Review", in Proceeding of COIT, pp. 1-4, 2007.
[2]  Suryana, N., Rasip, N.M., and Mohd, O., "Data Mining and Neural Network Approaches in Handling Mixed Problems Associated Within Hyperspectral Remote Sensing Image Analysis", Vietnam, 2007.
[3]  Chaira, T., and Ray, A.K., "Threshold selection using fuzzy set theory", Pattern Recognition Letters (PRL), vol. 25, no. 8, pp. 865–874, 2004.
[4]  Yan, H., "Unified Formulation of A Class of Image Thresholding Techniques", Pattern Recognition, vol. 29, no. 12, pp. 8, 1996.
[5]  Sato, K., Nakajima, M., and Hoshi, T., "Threshold Operation for Extraction of Mangrove Forest with TM Data of Landsat", in Proceeding of ACRS, 1999.
[6]  Melgani, F., Hashemy, R.B.A.A., and Taha, R.S.M., "An evaluation of the explicit fuzzy method using parametric and non-parametric approaches for supervised classification of multispectral remote sensing data", Engineering Journal Of University Of Qatar, vol. 14, pp. 77-104, 2001.
[7]  Ozesmi, S.L., and Bauer, M.E., "Satellite remote sensing of wetlands", Wetlands Ecology and Management, vol.10, pp. 381-402, 2002.
[8]  Green, E.P., Clark, C.D., Mumby, P.J., Edwards, A.J., and Ellis, A.C., "Remote sensing techniques for mangrove mapping", International Journal of Remote Sensing, vol. 19, no. 5, pp. 22, 1998.
[9]  Ali, Y., Mahfuz, H., Zuhair, M., and Weir, M., "Monitoring Mangrove Forest using Remote Sensing and GIS", in Proceeding of ACRS, 1999.
[10]  Azlan, N.I., and Othman, R., "Monitoring of Mangrove Area Using Remote Sensing Toward Shoreline Protection ", in Proceeding of GIS Conference Ostava, 2009.
[11]  I, M.H., K.O, C.K.A.C., Norsaliza, U., and I., K., "Comparison of several vegetation indices for mangrove mapping using remotely sensed data", International Geoinformatics Research and Development Journal, vol. 1, no. 3, pp. 9, 2010.
[12]  Singh, R.K., "Pattern recognition in remote-sensing imagery using data mining and statistical techniques", PhD thesis, Purdue University, 2005.
[13]  Vaiphasa, C., "Remote Sensing Techniques for Mangrove Mapping", PhD thesis, Wageningen University, 2006.
[14]  Wang, L., Sousa, W.P., Gong, P., and Biging, G.S., "Comparison of IKONOS and QuickBird images for mapping mangrove species on the Caribbean coast of Panam", Journal of Remote Sensing and Environment, vol. 91, pp. 8, 2004.
[15]  Kanniah, K.D., Wai, N.S., Shin, A.L.M., and Rasib, A.W., "Per-pixel and sub-pixel classifications of high-resolution satellite data for mangrove species mapping", Applied GIS, vol. 3, no. 8, pp. 22, 2007.
[16]  Alatorre, L.C., Sánchez-Andrés, R., Cirujano, S., Beguería, S., and Sánchez-Carrillo, S., "Identification of Mangrove Areas by Remote Sensing: The ROC Curve Technique Applied to the Northwestern Mexico Coastal Zone Using Landsat Imagery", Journal of Remote Sensing, vol. 3, pp. 1568-1583, 2011.
[17]  Liu, Y., Yan, S., and Wang, T., "Study on Image-segmented Classification", in Proceeding of ICII, pp. 296-301, 2001.
[18]  Ming, D., Luo, J., Shen, Z., and Li, J., "Features Based Parcel Unit Extraction From High Resolution Image", in Proceeding of Geoscience and Remote Sensing Symposium, 2005.
[19]  Zhang, Y., Lu, D., Yang, B., Sun, C., and Sun, M., "Coastal wetland vegetation classification with a Landsat Thematic Mapper image", International Journal of Remote Sensing, vol. 32, no. 2, pp. 545-561, 2011.
[20]  Droj, G., "The Applicability of Fuzzy Theory In Remote Sensing Image Classification", Informatica, vol. II, no. 1, pp. 8, 2007.
[21]  Sezgin, M., and Sankur, B., "Survey over image thresholding techniques and quantitative performance evaluation", Journal of Electronic Imaging, vol. 13, pp. 19, 2004.
[22]  Yang, Q., and Kang, W., "General Research on Image Segmentation Algorithms", International Journal Image, Graphics and Signal Processing, vol. 1, pp. 1-8, 2009.
[23]  Al-Kubati, A.A.M., Saif, J.A.M., and Taher, M.A.A., "Evaluation of Canny and Otsu Image Segmentation", in Proceeding International Conference on Emerging Trends in Computer and Electronics Engineering Dubai, 2012.
[24]  Kaur, E.N., and Kaur, E.R., "A Review on Various Methods of Image Thresholding", International Journal of Computer Science and Engineering, vol. 3, no. 10, pp. 3, 2011.
[25]  Sahoo, P.K., Soltani, S., and Wong, A.K.C., "A Survey of Thresholding Techniques", Computer Vision, Graphics and Image Processing, vol. 41, no. 2, pp. 233-260, 1988.
[26]  Otsu, N., "A threshold selection method from gray-level histograms", IEEE Transactions on Systems, Man, And Cybernetics, vol. 9, no.1, pp. 62-66, 1979.
[27]  Ng, H.-F., "Automatic Thresholding for Defect Detection ", Pattern Recognition Letters (PRL), vol. 27, no. 14, pp. 1644-1649, 2006.
[28]  Liu, H., and Jezek, K.C., "Automated extraction of coastline from satellite imagery by integrating Canny edge detection and locally adaptive thresholding methods", International Journal of Remote Sensing, vol. 25, no. 5, pp. 937-958, 2004.
[29]  Zăvoianu, F., Caramizoiu, A., and Badea, D., "Study And Accuracy Assessment of Remote Sensing Data for Environmental Change Detection in Romanian Coastal Zone Of The Black Sea", in Proceeding of ISPRS, pp. 778-783, 2004.
[30]  Stehman, S.V., and Czaplewski, R.L., "Basic structures of a statistically rigorous thematic accuracy assessment", in Proceeding of the 1997 ACSM/ASPRS Annual Convention, ASPRS Technical Papers, vol. 3, pp. 543-553, 1997.
[31]  Muller, S.V., Walker, D.A., Nelson, F.E., Auerbach, N.A., Bockheim, J.G., Guyer, S., and Sherba, D., "Accuracy Assessment of a Land-Cover Map of the Kuparu k River Basin, Alaska:Considerations for Remote Regions", Photogrammetric Engineering & Remote Sensing, vol. 64, no. 6, pp. 619-628, 1998.
[32]  Foody, G.M., "Status of land cover classification accuracy assessment", Remote Sensing of Environment, vol. 80, pp. 185- 201, 2002.
[33]  Her, Y., and Heatwole, C., "Land use classification in Zambia using Quickbird and Landsat imagery", in Proceeding of American Society of Agriculture and Biological Engineers, Minneapolis Convention Center, Minneapolis, Minnesota, 2007.
[34]  Nazli, M.F., and Hashim, N.R., "Heavy Metal Concentrations in an Important Mangrove Species, Sonneratia caseolaris, in Peninsular Malaysia", International Journal of Environment Asia, vol.3, pp. 51-55, 2010.