-
Paper Information
- Previous Paper
- Paper Submission
-
Journal Information
- About This Journal
- Editorial Board
- Current Issue
- Archive
- Author Guidelines
- Contact Us
International Journal of Agriculture and Forestry
p-ISSN: 2165-882X e-ISSN: 2165-8846
2012; 2(5): 262-267
doi: 10.5923/j.ijaf.20120205.10
Water Use Efficiency and Bird Pepper Production as Affected by Deficit Irrigation Practice
1Arid Land Agriculture Department, Faculty of Meteorology, Environment and Arid Land Agriculture, King Abdulaziz University, Jeddah, Saudi Arabia
2Soil &Water Department, Faculty of Agriculture, Assiut University, Assiut, Egypt
Correspondence to: Saleh M. Ismail , Arid Land Agriculture Department, Faculty of Meteorology, Environment and Arid Land Agriculture, King Abdulaziz University, Jeddah, Saudi Arabia.
| Email: |  |
Copyright © 2012 Scientific & Academic Publishing. All Rights Reserved.
An experiment was conducted in indoor lysimeters to study the effect of deficit irrigation on water use efficiency and bird pepper (Capsicum annuum L.) production under drip irrigation system. Six-week-old seedlings were transplanted into each lysimeter in the first of July, 2004. Four seedlings were grown in each lysimeter. Three irrigation treatments were investigated. The first treatment (W1) was 100% of the field capacity as a control. The second and third treatments (W2 and W3) were giving 85% and 70% of the field capacity, respectively, as deficit irrigation treatments. The deficit irrigation practice was applied after 15 days of the transplanting and continued for the whole growth season. The results indicated that the highest yield was obtained from W1 which grown under no stress. Deficit irrigation tends to increase water use efficiency and decrease the fresh fruit yield. Giving 85 % of the field capacity (W2) led to save 41% of the irrigation water and reduce the total yield by 29 %. Giving 70% of the field capacity (W3) resulted in 85 % of irrigation water saving but 40% of the total yield was lost. . In conclusion, water deficit is a practical technique to save large amounts of water.
Keywords: Deficit Irrigation; Bird Pepper; Drip Irrigation; Yield
Article Outline
1. Introduction
- Increasing food production per unit of water is one of the greatest challenges facing the researchers especially in arid and semi-arid areas, which has limited water recourses like Egypt and in tropic and sub-tropics, which characterized by hot dry weather during summer like Ishigaki Island, Japan. Egypt is a country with tremendous land resources but limited water resources. The cultivated area is only 3.3 % of geographical area. The main water source for Egypt is river Nile. The total water resources in Egypt are 55.5 billion m3 from river Nile in addition to 6 billion m3 from groundwater, flash flood and rainfall. The agricultural sector consumes 84 % of the water resources, which irrigate 3.3 Mha. The great challenge facing the Egyptian researchers is to expand the irrigated area from 3.3 Mha to 4.68 Mha with the same water resources by the year 2025. Similar conditions of water shortage exists in Ishigaki Island, Japan where water stress during hot seasons frequently damage crops. On this Island, insufficient water sometimes does not allow for proper irrigation. Thus practices to increase water productivity and irrigation efficiency like deficit irrigation are greatly required. Deficit irrigation was proposed long time ago as a technique that irrigates the entire root zone with less evapotranspiration and leads to reduce the irrigation water use with maintaining farmers’ net profits[9]. The decline in water availability for irrigation and the positive results obtained in some fruit tree crops have renewed the interest in developing information on deficit irrigation for a variety of crops[8,10, 11].Bird pepper is a very pungent variety; it is suitable for the fresh market or dehydration; it has a good tolerance to diseases. Hot pepper is a high value cash crop in many countries of the world especially in Egypt. The total world production of this crop has been estimated to be 14 to15 million tons a year[20]. Hot pepper planting is confined to warm and semi-arid countries where water is often a limiting factor for production. This necessitates the optimization of water management for pepper production because it is considered one of the most susceptible horticultural plants to drought stress for many reasons such as: i) the wide range of transpiring leaf surface and high stomatal conductance[1], ii) its shallow root system[7].The blossom stage of hot pepper consider the most sensitive period to water stress[3]. For high yields, an adequate water supply and relatively moist soils are required during the total growing period. Reduction in water supply during the growing period in general has an adverse effect on yield and the greatest reduction in yield occurs when there is a continuous water shortage until the time of first picking. The period at the beginning of the flowering period is most sensitive to water shortage and soil water depletion in the root zone during this period should not exceed 25%. Water shortage just prior and during early flowering reduces the number of fruits. The effect of water deficit on yield during this period is greater under conditions of high temperature and low humidity.In a field experiment conducted on hot pepper to study the application of irrigation water through alternate drip irrigation on partial roots (ADIP), fixed drip irrigation on partial roots (FDIP) and even drip irrigation on whole roots (EDIP). The results indicated that, the ADIP maintained high yield with up to 40% reduction in irrigation compared to the other treatments[16]. Continuous water stress significantly reduced total fresh weight of pepper fruits[6]. Moreover, the total pepper yield was less at lower levels of irrigation.[2]Deficit irrigation could be feasible irrigation strategy for hot pepper production where the benefit from saving water outweighs the decrease in the total fresh mass of fruit[8]. Deficit irrigation significantly affected the fruit numbers, fruit dry weight and dry yield of hot pepper; the average fruit numbers increased over 3 times with non-stressed compare to water stressed treatments. When irrigation water is plenty, the red hot pepper can be irrigated at the no stress level but when water source is scarce, pepper can be irrigated at the lower water level with taking economic conditions into consideration[13].Since the amount of water that are available for agriculture are generally limited overall the world and especially in Egypt, the knowledge about the relationship between yield and quality of the product and irrigation regimes is important to maximize the benefit of the available water supply. Therefore, the objectives of this study are: (i) to evaluate the water use efficiency of deficit irrigation for bird pepper (Capsicum annuum L.). and (ii) to determine the effect of water stress occurring under drip irrigation system during the whole growing season including the blossom stage on fresh fruit yield of bird pepper.
2. Materials and Methods
- The experiment was conducted in indoor lysimeters of a greenhouse situated at the Okinawa Subtropical Station (24o23/N, 124o12/E) of the Japan International Research Center for Agricultural Sciences (JIRCAS), Ishigaki, Japan. The size of each indoor lysimeter was 1.25m in width, 1.55 m in length and 1 m in depth. The soil inside the lysimeters was sandy clay loam. All of the lysimeters were equipped with watering systems on the surface and in the bottom and percolated water collection systems in the bottom. Detailed description of the equipped lysimeters was presented in[17]. The weather conditions inside the greenhouse were similar to those outside and if they change, a ventilation system automatically starts to readjust them. Hot pepper seeds (Capsicum annuum L.) were sown on May 14, 2004. Six-week-old seedlings were transplanted into the lysimeters in the first of July. Four seedlings spaced 40 cm apart were grown in each lysimeter. The plants were fertilized with a Nutricoat fertilizer containing 14% N, 12% P2O5 and 14% K2O. A dosage of 10 g fertilizer was added twice at 30 and 60 days from transplanting at 10 cm below soil surface in the root area of each plantThe water supply system installed in the lysimeters includes a cylinder, 7.5 cm in diameter and 47 cm in length fixed vertically on walls of the basements adjoining lysimeters. Two water tubes were connected with each lysimeter bottom and two cylinders. Percolated water is collected from bottom to cylinders, and irrigation water is supplied from cylinders to the bottom. A float in the cylinder shows water level electromagnetically. Volumes of the water supplied and collected are calculated from the water level differences in the cylinders. Individual plants were irrigated by drip irrigation line and through one emitter placed on the side of the each plant, 10 cm away from the stem. Fifteen days after transplanting, plants were subjected to the following three irrigation treatments during the whole growing season. In the first treatment (W1) which considered as a control, the required amount of irrigation water to bring the upper 30 cm soil depth to field capacity is given every three days. The second and third treatments (W2 and W3, respectively) were considered as deficit irrigation treatments. They received only 85% and 70% of the required amount of water every three days,. To calculate the required amount of water every irrigation during the growing season, soil water content was measured at 9 a.m. on the day of irrigation, and then the reduction in soil water content was compensated by adding water to bring W1 to field capacity, W2 to 85% of F.C. and W3 to 70% of F.C. After 6 weeks of transplanting, the irrigated soil depth was extended to 60 cm due to root growth.. Each treatment had three replications with four plants in each one. The experiment had a completely randomized design.Soil water content was measured vertically by three Time Domain Reflectometry (TDR, Campbell CS 616) sensors installed at 0.3, 0.6 and 0.9 m. soil depth for each lysimeter . Soil water content was recorded at a 60 minute interval by CR10X data logger. Leaf water potential (LWP) was determined from two fully exposed mature leaves per plant. Measurements were made in 13:00h for 7 consecutive days (280-286 Julian Days) using a Scholander pressure chamber. The fruits were harvested 5 times during the season. The first fruit yield was harvested after 53 days of transplanting. The second, third, fourth and fifth, fruit yields were collected after 14, 35, 52 and 85 days of the first harvest, respectively. The fruits were separated to green and red pepper after harvesting. The fresh fruit mass for each type for each individual plant was recorded. At the end of growing season shoots of each individual plant were collected, oven-dried at 71 ±1℃ and weighed to determine the distribution of plant dry mass. Water use efficiency (WUE) was obtained from dividing the total yield in kg/ha by the total water supply in m3/ha. Total supplied water and deep percolation below 1 m soil depth were automatically calculated via lysimeter equipments. The reductions in yield and water saving were calculated from the following equations where W1 is the fully irrigation treatment (100 % of the field capacity) and W2 and W3 are deficit irrigation treatments (85% and 70% of the field capacity, respectively)
 Where:W1 = field capacity level, W2 = 85% of field capacity W3 = 70% of field capacityThe data were analyzed by statisica software program[19]. Treatment means were separated by LSD test at P < 0.05.
3. Results
3.1. Total Water Supply, Soil Water Content and Plant Water Status
- Figure (1) shows the results of the total supplied water for all treatments during the whole growing season. The results revealed that W1 treatment received the highest amount of irrigation water followed by W2 while the least amount of irrigation water was received by W3 treatment.
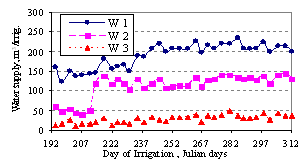 | Figure 1. Total water supply for fully (W1) and deficit irrigation (W2 and W3) treatments along the growing season |
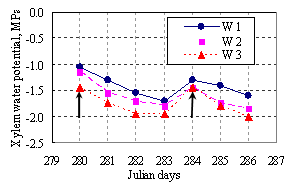 | Figure 3. Change in the leaf water potential measured at 13:00h for 7 consecutive days for all treatments |
3.2. Dry Matter and Fruit Yield
- The average dry matter for all studied treatments is shown in Figure (4). Decreasing the water supply caused a significant decrease in the total dry matter. However, the reduction was small. The highest dry matter weight was obtained from W1 followed by W2 and then W3 treatment, respectively (Fig. 4).
 | Figure 2. Changes in volumetric soil water content (WC) in fully (W1) and deficit irrigation (W2 and W3) treatments for different soil depths |
 | Figure 4. Dry matter weigh as a response of deficit irrigation treatment |
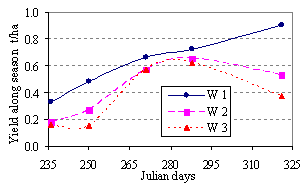 | Figure 5. Fruits yield along the growth season for all irrigation treatments |
3.3. Water Use Efficiency (WUE)
- The water use efficiency for fully and deficit irrigation treatments are presents in Figure (7). There were highly significant differences among irrigation treatments. Increasing the irrigation deficit was met by a highly increase in the WUE. The highest value of WUE was obtained from W3 treatment while the least one was recorded for W1 treatment. The difference in WUE between W1 and W2 was smaller compared to that between W2 and W3 treatment; however these differences were significant.
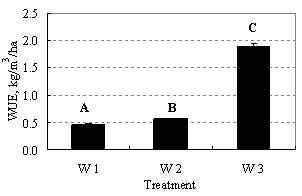 | Figure 7. Water use efficiency (WUE) for irrigation treatments |
4. Discussions
- The distribution of soil water content reverses the amount of total water supplied. For all treatments the highest soil water content was measured at surface layer (0.3 m). Since the supplied amount of water was enough to bring the surface layer (0.3 m) to field capacity in W1 or less than field capacity in W2 and W3, all the supplied water retained on that layer and resulted in a high soil water content. After the first six weeks of the transplanting and due to the root growth, the targeted deficit irrigation depth increased to be 0.6 m. The water deficit down to the 0.6 m depth was replenished in subsequent irrigations, and then the soil water content started to increase in that layer, but only in the W1 treatment because the amount of supplied water brought the upper 0.6 cm to the field capacity. Moreover, it led to a little increase in soil water content of the third layer (up to 0.9 m). No change in the soil water content of W2 and W3 at 0.6 and 0.9 m because the amount of water supply was less than field capacity and all added water retained in the surface layer. Leaf water potential decreased markedly in deficit irrigation treatments because fruit are stronger sinks for water than for vegetative parts of plants. Therefore, competition for water from developing reproductive sinks coupled with increased evaporative demand due to rising temperature during the late growing season may have caused the reduction in LWP[4].Small reduction was found in the dry matter weight among investigated irrigation treatments. However, the reduction was significant. Water stress did not strongly affect the dry weight of pepper plants during the first part of its cycle, as stomatal conductance fairly to moderately resistant drought, allowing the maintenance of transpiration rate,[5]. Moreover, the increase in translocation of dry matter towards reproductive parts might have caused an increase in dry weight of reproductive parts at the lower level of irrigation where the plants were more dehydrated than other treatments.
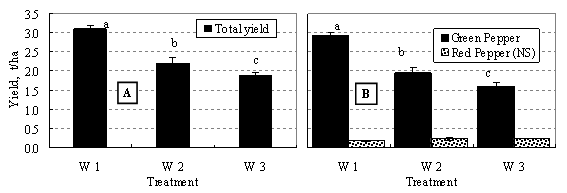 | Figure 6. Total fruit yield (A) as well as total green and red fruit (B) as affected by deficit irrigation treatments |
- The fully water irrigation treatment (W1) gave the highest yield while deficit irrigation treatments reduced the yield. It is generally accepted that water deficit reduces pepper yield. For high yields, an adequate water supply and relatively moist soils are required during the entire growing season. The reduction in water supply during the growing period, in general, has an adverse effect on yield. The greatest reduction in yield occurs when there is a continuous water shortage until the time of first picking.[2, 5, 6, 15, 18]. The reduction in the fresh fruit yield of hot pepper might be due to deficit irrigation because decreasing the soil water content reduced fruit size and total fruit weight of hot pepper,[21]. The reduction in fruit yield of hot pepper under deficit irrigation might be due to the reduction in fruit size and numbers. But mainly from fruit size since the pepper fruit size appears as the controlling factor for fruit yield[12]. Obviously, the effect of water deficit is much more important when yield is expressed as fruit fresh weight like in this study. Deficit irrigation significantly reduced fresh yield in terms of fresh mass of fruit per plant. However, the total dry mass of fruit per plant may be similar,[8]. No significant difference was found in red hot pepper yield among the treatments because the water deficit may not have effects on the fruit ripening. Water deficit did not hasten ripening but water deficit reduced biomass production.[13]A sharp increase in water use efficiency obtained by deficit irrigation. The total dry mass of fruit may be slightly affected by deficit irrigation[8]. This indicates that water movement into fruit may have decreased with progressive development of water deficit without affecting the translocation of dry matter into the fruit and resulted in an increase in mass production per unit of water which led to the high water use efficiency.Obviously deficit irrigation saves water but reduces yield. Irrigating hot pepper at 85% (W2) of field capacity every three days during the complete growing season reduced the total yield by 29 % and saved about 41% of irrigation water. Increasing the deficit irrigation resulted in a sever yield reduction. Giving 70% (W3) of the field capacity every three days reduced the fresh fruit yield by 39.7 %, but sharply increased the water saving to be about 85% of irrigation water.
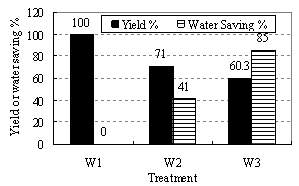 | Figure 8. percent of water saving in relation to irrigation deficit treatments |
5. Conclusions
- From the present study, it was observed that the highest yield obtained from the treatment which grown with no-stress (W1, 100% of FC). Deficit irrigation tends to decrease the fresh fruit yield. Irrigating hot pepper at 85% of the field capacity every three days during the complete growing season led to a reduction of 28.9% from the total fresh fruit yield, while adding water at 70% of the field capacity every three days reduced the fresh fruit yields by 39.7%. The sever reduction in total yield of W3 was due to the low soil moisture during the first picking. Deficit irrigation did not show significant effects on fruit ripening (red color fruits). The amount of saved water sharply increased by deficit irrigation treatments, producing about 60% of total fruit yield led to save 85% of irrigation water, while producing about 70% of the total fruits yield save about 41% of irrigation water. In conclusion, deficit irrigation is a feasible irrigation technique for hot pepper production where the benefit from saving large amounts of water outweighs the decrease in total fresh mass of fruit.
ACKNOWLEDGEMENTS
- The authors gratefully acknowledge the contribution of the Japan International Research Center for Agricultural Science (JIRCAS) Okinawa Subtropical Station, Japan for handling the fund and the facilities required to carry-out this research
 Abstract
 Reference
 Full-Text PDF
 Full-Text HTML