-
Paper Information
- Paper Submission
-
Journal Information
- About This Journal
- Editorial Board
- Current Issue
- Archive
- Author Guidelines
- Contact Us
International Journal of Agriculture and Forestry
p-ISSN: 2165-882X e-ISSN: 2165-8846
2012; 2(5): 199-202
doi:10.5923/j.ijaf.20120205.02
The Golden Shiner Grading Assessment Model
 Abstract
 Reference
 Full-Text PDF
 Full-text HTML
Philip R. Pearson1, Rachel V. Beecham2, C. Douglas Minchew3
1United States Department of Agriculture, Lubbock, TX 79416, United States
2Mississippi Valley State University, Department of Natural Science, Itta Bena, Mississippi, 38941, United States
3Mississippi State University, National Warmwater Aquaculture Center, Mississippi State, Mississippi, 39759, United States
Correspondence to: Rachel V. Beecham, Mississippi Valley State University, Department of Natural Science, Itta Bena, Mississippi, 38941, United States.
| Email: |  |
Copyright © 2012 Scientific & Academic Publishing. All Rights Reserved.
Golden shinersNotemigonuscrysoleucas are typically graded in concrete vats having a rectangular cross section. Aluminum frames fitted with panels of uniformly spaced, vertical rods (bar graders) are used to separate golden shiners having similar weight and length from a mixed-size aggregation. Investigation revealed that no quantitative method for estimating bar grader effectiveness existed, so a Microsoft© Excel application was developed. The golden shiner assessment model presents product quality information for graded golden shiners Notemigonuscrysoleucas. Qualityassurance data includes an estimate of the number of fish per kilogram (kg), weight in kg per 1,000 fish, and an assessment of grading effectiveness. Standard weight calculations give benchmark weight to length criteria for graded golden shiners, whereas relative weight provides a general indicator of health, and a means to estimate the effectiveness of a feeding regimen. This model serves as an assessment tool for researchers, a management tool for producers, and a source of important product information for purchasers.
Keywords: Golden Shiner, Grading, Management, Standard Weight
Cite this paper: Philip R. Pearson, Rachel V. Beecham, C. Douglas Minchew, The Golden Shiner Grading Assessment Model, International Journal of Agriculture and Forestry, Vol. 2 No. 5, 2012, pp. 199-202. doi: 10.5923/j.ijaf.20120205.02.
Article Outline
1. Introduction
1.1. Typical Grading Practice
- Golden shiners are typically raised in levee-style earthen ponds (1), and are harvested with fine-mesh seines. Each catch is transported by truck to an on-farm minnow shed, and held in a rectangular concrete vat for 18-24 hours (h) before being graded into size/weight categories. Grading is accomplished by pulling rectangular panels comprised of uniformly spaced, vertical aluminum rods (bar graders) through a vat (Figures 1 & 2). These bar graders are used to separate golden shiners having a selected target weight (Wt) (kilogram (kg) per 1,000 fish) from a mixed-size catch. Producers select pairs of grader panels so that post-graded mean weight is approximately x kg per 1,000 fish. The upper and lower boundaries of an acceptable graded grouping are somewhat flexible as farmers and distributors must cooperate to sell available fish (1). Golden shiners are sold on a weight basis, but length and robustness are used by anglers as indicators of baitfish quality. In 2005, U.S. baitfish producers sold 2,267 metric tons of golden shiners Notemigonus crysoleucas for $17,100,000. Arkansas (1,750 metric tons), Mississippi (94 metric tons), and Minnesota (55 metric tons), accounted for 83% of production (2). Grading effectiveness is frequently estimated by collecting a small number of graded golden shiners and visually assessing them.
1.2. The Assessment Model
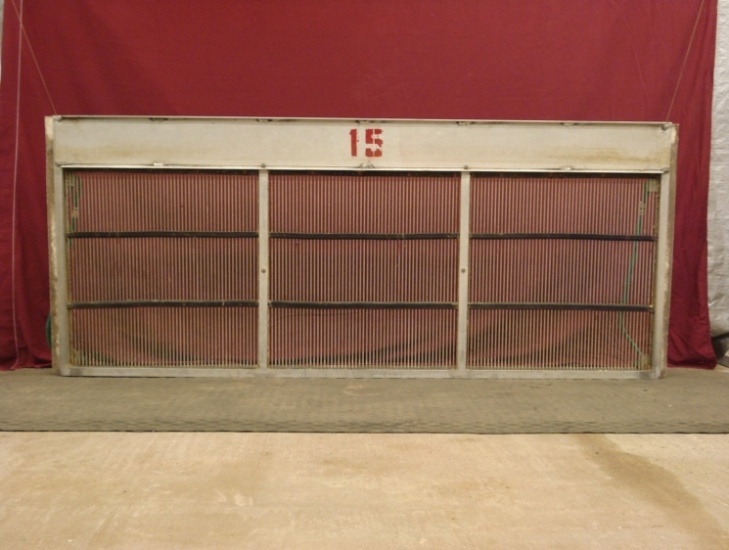 | Figure 1. A number 15 grader of the type used to sort golden shiners into size-weight classes. The inch-pound system is used by U.S. baitfish farmers, and grader spacing is indicated in 64th inch increments. In a 15 grader, aluminum rods having diameter of 0.1875 inch are set on 0.4219 inch centers to provide a 15/64 (0.2344) inch space between adjacent rods. SI units: In a 5.96 mm grader, aluminum rods having diameter of 4.76 mm are set on 10.72 mm centers to provide a 5.96 mm space between adjacent rods |
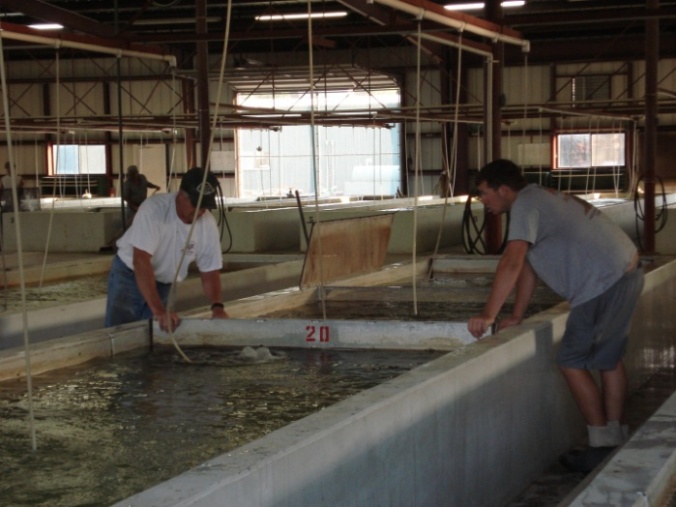 | Figure 2. Workers grade golden shiners with a panel having 20/64 in (7.94 mm) rod spacing |
2. Methods
2.1. Field Work
- We conducted 53 grading events at a commercial bait fish farm in April, May, June, and December 2006. After each grading event, we obtained the wet weight (g) and measured the maximum total length (mm) of each individual from one sample of 20 golden shiners.
2.2. Model Development
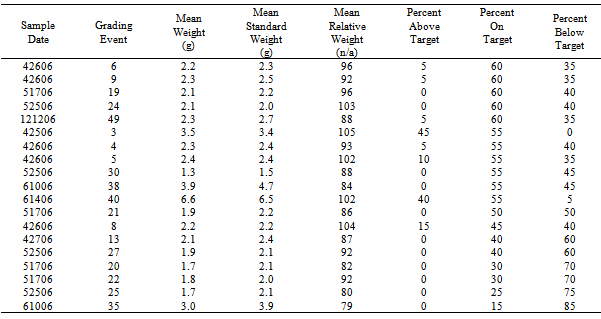
- The Golden Shiner Grading Assessment Model was programmed as a Microsoft© Excel application (Table 1). Weight (g) and total length (mm) for each element of a sample of graded golden shiners (n = user defined) and user-selected Wt (kg per 1,000 golden shiners) and range (± 0.xWt) are required for computations. The model computes grading efficiency, standard weight, and relative weight for each grading event. Excel programming code for the (n = 20) model is presented in Table 2.
|
3. Results and Discussion
3.1. The Grading Efficiency Score
- For demonstration purposes, the model classifies elements from a sample of graded golden shiners (n = 20) into three weight classes: above, on, and below target, and then computes a grading efficiency score (0, 100) for that event. A grading event was considered efficient if 70 percent of sample elements from that event were in the range ± 0.25Wt.
3.2. Quality Assessment Indicators
- Species specific equations for standard and relative weight provide quality assessment indicators. Standard weight calculations give benchmark weight to length criteria for graded golden shiners, whereas relative weight provides a general indicator of health, and a means to estimate the effectiveness of a feeding regimen. Results include an estimate of the number of fish per kg and weight in kg per 1,000 fish.
3.2.1. Standard Weight
- Standard weight (Ws) is a length-specific value predicted by a weight-length regression constructed to represent a given species (3). The regression equation for golden shiners (4), log10 (Ws) = -5.593 + 3.302(log10TL), where TL is total length (mm), provides benchmark weight to length criteria. Liao (4) stated that this Ws equation was valid for golden shiners having minimum length of 50 mm. McNulty (5) showed that the equation is valid for carefully weighed and measured golden shiners having maximum total length (3) of from 29 to 76 mm.
3.2.2. Relative Weight
- Relative weight describes the inherent shape of a fish in good condition (3), and provides a means to estimate the effectiveness of a feeding regimen (5). The equation, Wr = 100(W/Ws), where W = the weight of an individual (g), and Ws = standard weight for golden shiners (g) (4) is used in the model. A Wr value ≈ 100 indicates a fish in good condition. A higher value indicates increased plumpness, whereas a lower value indicates a fish in poor condition (3).
3.3. Target Weight
- Various pairs of bar graders were used to obtain golden shiners in selected size classes during this study. If, for example, the target weight was 9.1 kg per 1,000 golden shiners, then bar graders with spacing of 10.7 mm and 9.1 mm, respectively, were used. The bar grader with spacing of 10.7 mm was pulled first. Golden shiners larger than the desired size should have been separated from those ≤ to the required size. After a blocking screen was set, the 9.1 mm grader was pulled through the vat section holding the remaining fish. Golden shiners smaller than the target weight, were expected to swim through the bars, but those in the target range should have been held by the grader. A second blocking screen was set. The original mixed-size aggregation was divided into three groups, which were separated by the blocking screens. Golden shiners that passed through the 10.7 mm grader, but that were held by the 9.1 mm grader were deemed ready for sale. Those above the target weight could be graded again, or returned to a production pond. Producers typically place golden shiners below target weight in grow out ponds.
3.4. Weight Classes
- Three weight classes (above target, on target, and below target) were used to evaluate grading effectiveness. A sample element was on target if its weight (g), when converted to kg · 1,000 identical sample elements, fell within ± 0.25Wt. An acceptable grading event was defined as one in which 70 percent of sample elements (n = 20) from that event were on target.
3.5. Results
|
4. Conclusions
- The Golden Shiner Assessment Model is a Microsoft© Excel application that provides information regarding grading effectiveness by comparing actual individual fish weight to a scientifically based indicator of robustness or general health and to an estimator of the efficacy of a given feeding regimen. Model output may be useful as an evaluation tool for researchers, a management tool for producers, and as a source for quantifiable product quality information for purchasers of graded golden shiners (wholesalers and retailers).
References
| [1] | Stone, N., A. Goodwin, R. Lochmann, H. Phillips, C.Engle, and H. Thomforde. 2005. Baitfish culture, in A.M. Kelly and J. Silverstein, editors, Aquaculture in the 21st Century, American Fisheries Society Symposium 46:607-643. American Fisheries Society, Bethesda, Maryland. |
| [2] | National Agricultural Statistics Service (NASS). 2006. 2002 census of agriculture, census of aquaculture (2005), volume 3, special studies part 2, AC-02-SP-2, page 48. U.S. Department of Agriculture. October 2006. |
| [3] | Anderson, R.O., and R.M. Neuman. 1996. Length, weight, and associated structural indices. Pages 447-482 in B.R. Murphy and D.W. Willis, editors. Fisheries techniques, 2nd edition. American Fisheries Society, Bethesda, Maryland. |
| [4] | Liao, H., C.L. Pierce, and D.H. Wahl. 1995. Relative weight (Wr) as a field assessment tool: relationships with growth, prey biomass, and environmental conditions. Transactions of the American Fisheries Society 124:387-400. |
| [5] | McNulty, E., N. Stone, and S. Lochmann. 2000. Effect of winter feeding rate, feed form, and trigger temperature on yield and condition of golden shiners, Notemigonus crysoleucas. Journal of Applied Aquaculture, Vol. 10(3): 69-78. |