-
Paper Information
- Next Paper
- Previous Paper
- Paper Submission
-
Journal Information
- About This Journal
- Editorial Board
- Current Issue
- Archive
- Author Guidelines
- Contact Us
International Journal of Agriculture and Forestry
p-ISSN: 2165-882X e-ISSN: 2165-8846
2012; 2(3): 117-120
doi: 10.5923/j.ijaf.20120203.07
Effect of Crop Rotation, Soil Temperature and Soil Moisture on CO2 Emission Rate in Indo-Gangetic Plains of India
 Abstract
 Reference
 Full-Text PDF
 Full-Text HTML
Mamta Srivastava 1, S. D. Sharma 2, M. Kudrat 3
1Forest Soil & Land Reclamation Division, Forest Research Institute, Dehradun, 248006, India
2Forest Informatics Division, Forest Research Institute, Dehradun, 248006, India
3Regional Remote Sensing Centre, North, 4, Kalidas Road, Dehradun, 248001, India
Correspondence to: S. D. Sharma , Forest Informatics Division, Forest Research Institute, Dehradun, 248006, India.
| Email: |  |
Copyright © 2012 Scientific & Academic Publishing. All Rights Reserved.
Carbon dioxide (CO2) efflux from soil is one of the very important components of global carbon cycle and climate change. Land use and climate are the major factors that influence the rate of CO2 efflux. The present study was undertaken to evaluate the monthly variation in rate of CO2 efflux and its correlation with soil temperature and soil moisture in agricultural lands under different crops and crop rotations in part of Indo-Gangetic plain in India. The Indo-Gangetic plain covers 13% geographical area of the country and produces 50% of the total food grain of the country. The agricultural lands are cultivated for variety of crops including, Oryza sativa (Paddy), Triticum aestivum (Wheat), Zea mays (Maize), Brassica herta (Mustard), Trifolium alexamdrinum (Barseem), Sorghum bicolor (Jowar), Sachharum officinarum (Sugarcane) and several pulses and vegetables. The average annual CO2 emission rate ranged between 0.56 g m-2h-1 (wheat –fallow- paddy) and 0.75 g m-2h-1 (jowar-barseem) with a mean value of 0.64 g m-2h-1. The standard deviation varied from 0.06 to 0.25 and the standard error varied from 0.02 to 0.03. Wheat crop combinations (wheat-fallow-paddy, wheat-fallow, wheat-maize, wheat-pulses, wheat-sugarcane, wheat-jowar, and wheat-vegetable) showed relatively lower values of average annual CO2 emission rate whereas highest emission rates were found in vegetable crops. During monsoon months the rate of CO2 emission from soil was higher due to favorable moisture and temperature conditions, while in winter the same was observed minimum in all the crops. The study leads to infer that crop, crop rotation and soil temperature and moisture have significant effect on soil CO2 emission.
Keywords: CO2 Emission, Monthly Variations, Agriculture, Crop Rotation, Indo-Gangetic Plain
Article Outline
1. Introduction
- CO2 efflux from soil generally referred to as CO2 emission from soil or soil respiration is an important component of the terrestrial carbon budget and is the second largest factor in the flux of carbon between earth and the atmosphere[1, 2, 3]. This is the most representative manifestation of the biological as well as chemical processes in the soil as it produces 75-80 Pg of CO2 - C annually[4], which is more than 10 times of the current rate of fossil fuel burning[5]. This phenomenon indicates that nearly 10% of atmospheric CO2 cycles through soils each year[4]. Although lot of work on CO2 emission or soil respiration has been carried out all over the globe[6, 4, 7, 8] but the work on CO2 emission from the soils of Indo-Gangetic plain of India is scanty. It is, therefore, imperative to have an accurate measurement and thorough understanding of the seasonal variation in CO2 efflux and the effect of agricultural crop on CO2 emission.In view of the above, an attempt has been made to evaluate influence of soil temperature and moisture and the crop rotation on monthly variations in CO2 emission rate in the Indo-Gangetic plain which produces about 50% food grain of the country[9].
2. Materials and Methods
2.1. Study Area
- The study was conducted in a part of Indo-Gangetic plains in the 5 districts of Uttar Pradesh and one district of Uttarakhand state of India. The study area extends over 16044.9 km2 and covers the districts of Ghaziabad, Baghpat, Meerut, Muzzaffarnagar, Saharanpur and Haridwar. It lies between 28o40’ N to 30o 21’N Latitude and 77o 07’ E to 78o 14’ E Longitude with a general elevation of 230m above msl. The climate of the study area is predominantly subtropical and the annual rainfall varies between 600–1000 mm. About 90% of the rainfall occurs during the southwest monsoon, lasting from June to September. The mean annual temperature varies between 22 and 29oC and the monthly temperature ranges from 8-10oC in December-January to 38-40oC during May-June. The summer season is very hot and persists from April to August. The winter falls around Mid-November and continues till February end.The Psamments and Ustorthents of the Entisol order, Haplustepts of Inceptisols order and Haplustalfs of the Alfisol order occur as the main great group of soil and the agriculture is practiced in 24 out of the total 25 soil associations occurring in the area. The soils in general are deep and well drained. The texture of the soil varies widely between sand to fine loam. The soil reaction is near neutral to alkali and the pH varies from 7.4 to 7.9. The slopes are very gentle with slight to moderate erosion and flooding. Except the Siwalik hill, the area is plain and comprises piedmonts and recent and old alluvial plain.
2.2. Site Selection
- The sites were selected on the basis of soil association[10] as well as agricultural crop /crop rotation of the area. The soil map prepared and published by National Bureau of Soil Survey and Land Use Planning (NBSS&LUP 1999) Nagpur, was adopted as base map. Several kinds of crop rotations including paddy-vegetable, sugarcane-wheat, sugarcane-sugarcane, wheat-vegetable, wheat-pulses, wheat-fallow, jowar-barseem, maize-mustard, mustard-vegetable and maize-wheat are practiced. In order to include all the variations in terms of soil associations and crop rotations, the study was conducted in all the 24 soil associations. In all 53 sites were selected and at each site the measurements were recorded in 3 replications. The coordinates of each sample location were recorded with the help of mobile Global Position System (GPS).
2.3. Field and Laboratory Estimations
- The measurement of CO2 emission and soil temperature was carried out at an interval of one month, at each of the 53 sites for a period of 2 years from May 2007 to April 2009. The closed chamber, most popular and widely used method, for measuring CO2 efflux from soil[11] was adapted. The measurements were made by PSP soil respiration system (EGM-4 CO2 Analyser). The EGM-4 CO2, a portable battery operated unit, is a non-dispersive infrared gas analyser that features an “Auto-Zero” facility. It permits instantaneous measurements of CO2 concentrations. Soil temperature was also recorded at 5 cm soil depth, each month for a period of two years, by Soil Temperature Probe which is in-built with soil PSP respiration system.Surface soil samples, 0-15 cm deep, were collected from each of the 53 selected sites at an interval of one month for a period of 24 months for estimation of moisture by gravimetric method[12].
3. Results and Discussion
- The influence of crops and crop rotations and the soil moisture and temperature on CO2 emission rate is presented below:
3.1. Effect of Crop and Crop Rotation on CO2 Emission Rate
- Among the various crops and crop rotations, the fodder crop (jowar-barseem) emitted highest amount of CO2 (0.75 g m-2h-1) followed by vegetable grown sites either as vegetables alone (0.72 g m-2h-1) or vegetables in rotation with mustard (0.72 g m-2h-1) and wheat (0.71 g m-2h-1). Since these crops are irrigated twice a month, the moisture seems to be responsible for higher CO2 emission. Many workers[13, 14, 15, 8] demonstrated the significantly positive correlation of CO2 emission rate with soil moisture. The frequent intercultural operation, being practiced in vegetable fields, lead to higher CO2 emission rate. Intercultural operation has tillage like effect which significantly influences soil respiration rate[16]. Those sites where the lands were left fallow between two crops i.e. wheat-fallow-paddy and wheat-fallow emitted less amounts (0.56 g m-2h-1 and 0.57 g m-2h-1 respectively) of CO2. The CO2 emission rate in sugarcane fields was 0.60 g m-2h-1 but it was higher in those fields where sugarcane was removed to grow wheat (0.62 g m-2h-1).Wheat was found to be the major crop in the study area and it was grown in rotation with paddy, maize, jowar, sugarcane, pulses and vegetables. All wheat rotations showed relatively lower values of average annual CO2 emission rate (0.56 g m-2h-1). The CO2 emission rate followed the following trend in rotation of wheat with other crops (Figure 1):Wheat-fallow-paddy < wheat-fallow < wheat-maize < wheat-pulse < wheat-sugarcane < wheat-jowar < wheat-vegetable The suitable reason for this is not known, however the application of urea and DAP might have resulted in declining CO2 emission rate. The application of higher nitrogen treatment in soil reduces 14 to 31 percent of soil CO2 emission rate[17, 18, 19]. The results of the present study are also in agreement with that of Zheng et.al.[20] and Iqbal et.al.[21].
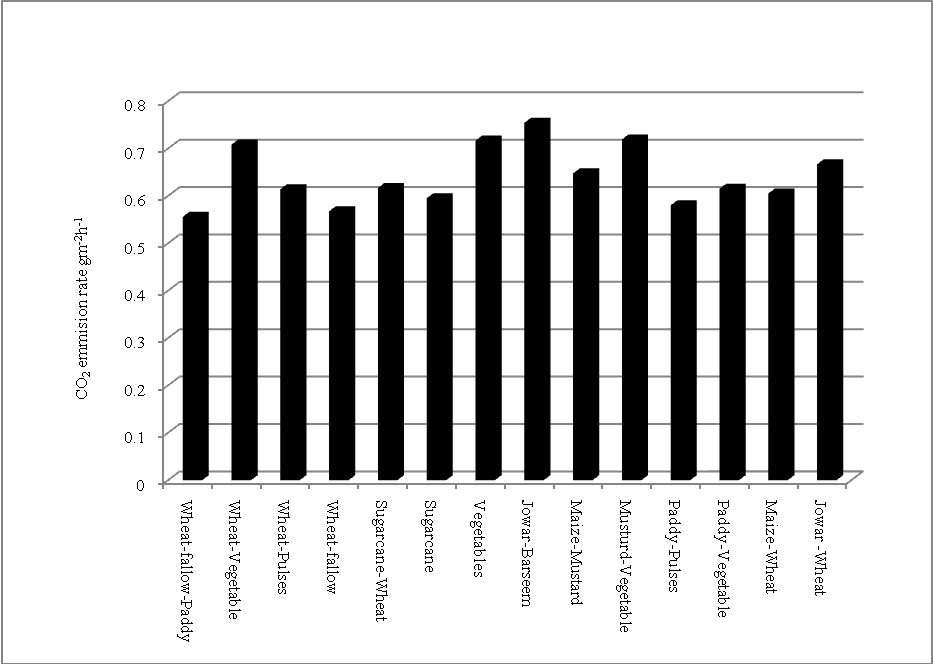 | Figure 1. CO2 emission rates in different crop rotations |
3.2. Effect of Soil Temperature and Moisture on CO2 Emission Rate
- Soil moisture and temperature are the most influencing factors for CO2 emission from soils[8, 22, 23, 24]. The soil temperature was highest in the month of April (34°C). It remained within a narrow range of 30°C to 31°C from May to August and then declined to 15°C in December. The soil moisture was only 6.02 % in the month of April and it increased to 14.92 % in June and remained between 13.43 and 14.92% during June-September.The rate of CO2 emission followed the similar trend and it was maximum (0.75 g m-2 h-1 to 0.95 g m-2 h-1) during monsoon months (June to September) whereas it was lowest in winter months (December-January).Highest rate (0.95 g m-2 h-1) was noticed in the month of August followed by 0.93 g m-2 h-1 in July and 0.82 g m-2h-1 in September (Table 2). In the monsoon months both the temperature and soil moisture are favorable for higher CO2 efflux because of luxuriant growth of soil microbes. The rate of CO2 emission from soil was lowest in the month of January 0.39 g m-2h-1 followed by December 0.40 g m-2h-1. Global CO2 emission has been reported to be minimum during February and maximal during July and August[25] and similar trend has also been observed in grasslands[6].
|
3.3. Regression Analysis
- The following regression equation explains the coefficient of determination between CO2 emission rate and combined parameters of soil temperature plus soil moisture.Y = -0.268 + 0.021 Temperature + 0.030 Moisture (R2 = 0.435)A significant correlation between CO2 emission rate and temperature as well as moisture is revealed by the correlation matrix of CO2 emission rate and soil moisture and soil temperature (Table 3). However, the correlation was less strong (r = 0.35) between CO2 emission rate and soil moisture than that between CO2 emission rate and soil temperature (r = 0.55).
|
4. Conclusions
- The trend of CO2 emission rate is followed uniformly under all the land uses and soil associations i.e. maximum during monsoon and minimum during winter period. The monthly CO2 emission showed wide variations. Highest rate was noticed in the month of August followed by July and September and it was lowest in the month of January followed by December. Soil moisture and temperature are the most influencing factors for CO2 emission from soils. During monsoon period both the temperature as well as soil moisture are favourable for higher CO2 efflux in the study area. Among the various crop rotations, the soils under Jowar- Barseem (fodder crops) had higher rate of CO2 emission and the soils under vegetables crops showed next higher CO2 emission rate. Wheat crop combinations (wheat-fallow-paddy, wheat-fallow, wheat-maize, wheat-pulses, wheat-sugarcane, wheat-jowar, and wheat-vegetable) showed relatively lower values of average annual CO2 emission rate.
ACKNOWLEDGEMENTS
- The authors are thankful to Regional Remote Sensing Centre-North, Indian Institute of Remote Sensing, Dehradun for providing the facilities to carry out field work and laboratory analysis.
References
| [1] | Bohn, H. L., 1982, Estimate of organic carbon in World soils. Soil Science Society of American Journal, 40, 468-470 |
| [2] | Eswaran, H., Berg E.van den., Reich, P. and Kimble, J., 1995, Global Soil Carbon Resources. In: R.Lal et al. (Editors), Soils and Global Change. Adv. Soil Sci. CRC Press, Boca Raton, FL. 27-43 |
| [3] | Schlesinger, W. H. and Andrew. J. A., 2000, Soil respiration and the global carbon cycle. Biogeochemistry, 48, 7-20 |
| [4] | Raich, J. W. and Potter, C., 1995, Global patterns of carbon dioxide emissions from soils. Global Biogeochemical cycles, 9, 23-36 |
| [5] | Marland, G., Boden, T. A. and Andrews., 2000, Global, regional and national CO2 emissions. In trends: A compendium of data on Global change. Carbon dioxide information analysis centre, National laboratory, US Department of Energy, Oak Ridge, Tennessee |
| [6] | Gupta, S. R. and Singh, J. S., 1981, Soil respiration in tropical grassland. Soil Biology and Biochemistry, 13, 261-268 |
| [7] | Dawson, J. J. C. and Smith, P., 2007, Carbon losses from soil and its consequences for land-use management. Science of the Environment, 382, 165-190 |
| [8] | Li, H., Yunain, J., Yue, X. and Wang, M., 2008, Significance of soil temperature and moisture for respiration in Chinese mountain area. Agricultural and Forest Meteorology, 148, 490- 503 |
| [9] | Bhattacharyya, T., Pal, D. K., Chandran, P., Mandal, C., Ray, S. K., Gupta, R. K. and Gajbhiye, K. S., 2004, Managing Soil Carbon Stocks in Indo-Gangetic Plains, India, Rice-Wheat Consortium for the Indo-Gangetic Plains, New Delhi, India |
| [10] | Singh, S. P., Ram, J., Walia, C. S., Sachdev, C. B., Dhankar, R. P., Rana, K. P. C., Sehgal, J., Velayutham, M. and Gajbhiye. K. S. 2004, Soils of Uttar Pradesh for optimizing land use. NBSS Publ. 68, Nagpur, India |
| [11] | Parkinson, K. J., 1981, An improved method for measuring soil respiration in field, Journal of Applied Ecology, 18, 221-228 |
| [12] | Black, C. A., 1965, Methods of Soil Analysis. American Society of Agronomy, Madison, WI |
| [13] | Akinremi, O. O., McGinn, S. M. and McLean, H. D. J., 1999, Effect of soil temperature and moisture on soil respiration in barley and fallow plots. Canadian Journal of Soil Science, 79, 5-13 |
| [14] | Franluebbers, A. J., Hons, F. M. and Zuberer, D. A., 1995, Tillage and crop effects on seasonal dynamics of soil CO2 evolution, water content , temperature and bulk density. Applied Soil Ecology, 2, 95-109 |
| [15] | Tang, X., Zhou, G., Liu, S., Zhang, D., Liu, S., Li, J. and Zhou, C., 2006, Dependence of Soil respiration on soil temperature and soil moisture in successional forest in south China. Journal of Integrative Plant Biology, 48, 654-663 |
| [16] | Bauer, P. J., Frederick, J. R., Novak, J. M. and Hunt, P. G., 2004, Soil respiration rates after twenty-five years of no-tillage. Proceedings of 26th Southern Conservation Tillage Conference for Sustainable Agriculture, Raleigh, NC, 118-125 |
| [17] | Mo. J ., Zhang, W., Zhu, W., Gundersen, P., Fang, Y., Li, D. and Wang, H., 2008, Nitrogen addition reduces soil respiration in a mature forest in south China. Global Change Biology, 14, 403-412 |
| [18] | Bowden, R. D., Davidson, E., Savage, K., Arabia, C. and Steudler, P., 2004, Chronic nitrogen addition reduce total soil respiration and microbial respiration in temperate forest soil at Harvard forest. Forest Ecology and Management, 196, 43-56 |
| [19] | Wilson, H. M. and Al-Kaisi, M. M., 2008., Crop rotation and nitrogen fertilization effect on soil CO2 emission in central Iowa. Applied Soil Ecology, 39, 264-270 |
| [20] | Zheng, H., Ouyang, Z. Y., Wang, X. K., Miao, H., Zhao, T. Q. and Peng, T. B., 2005, How different reforestation approaches affect red soil properties in southern China. Land Degradation and Development, 16, 387-396 |
| [21] | Iqbal, J., Hu, R., Lin, S., Ahamadou, B. and Feng, M., 2009, Carbon dioxide emission from Ultisol under different land uses in mid-subtropical China. Geoderma, 152, 63-73 |
| [22] | Loyd, J. and Taylor. J.A., 1994, On the temperature dependence of soil respiration. Functional Ecology, 8, 315-323 |
| [23] | Flangan, L. B. and Johnson, B. G., 2005, Interacting effect of temperature, soil moisture and plant biomass production on ecosystem respiration in a northern temperate grass land. Agricultural and Forest Meteorology, 130, 237-253 |
| [24] | Jia, B., Zhou, G., Wang, Y., Wang, F. and Wang, X., 2006, Effect of temperature and soil water content on soil respiration of graze and ungraze Leymus chinensis steppes, Inner Mongolia. Journal of Arid Environment, 67, 60-76 |
| [25] | Raich, J. W., Potter, C. and Bhagawati, D., 2002, Interannual variability in global soil respiration, 1980-94. Global Change Biology, 8, 800-812 |