-
Paper Information
- Previous Paper
- Paper Submission
-
Journal Information
- About This Journal
- Editorial Board
- Current Issue
- Archive
- Author Guidelines
- Contact Us
International Journal of Agriculture and Forestry
2012; 2(2): 16-23
doi: 10.5923/j.ijaf.20120202.04
Comparative Analysis of the Chemical Nutrient Composition of Selected Local and Newly Introduced Rice Varieties Grown in Ebonyi State of Nigeria
 Abstract
 Reference
 Full-Text PDF
 Full-Text HTML
Oko A. O. 1, Ubi B. E. 1, 2, Efisue A. A. 2, Dambaba N. 3
1Department of Biotechnology, Ebonyi State University, P.M.B. 053 Abakaliki, Ebonyi State, Nigeria
2Biotechnology Research and Development Centre, Ebonyi State University, P.M.B. 053 Abakaliki, Ebonyi State, Nigeria
3National Cereals Research Institute (NCRI), Badeggi, P.M.B.8 Bida, Niger State, Nigeria
Correspondence to: Ubi B. E. , Department of Biotechnology, Ebonyi State University, P.M.B. 053 Abakaliki, Ebonyi State, Nigeria.
| Email: |  |
Copyright © 2012 Scientific & Academic Publishing. All Rights Reserved.
We investigated the chemical nutrient composition of 15 selected indigenous and five of the newly introduced hybrid rice varieties in Ebonyi State, Nigeria. The rice cultivars were field-grown, processed, and analyzed for proximate and mineral composition. The results showed that cv. “Canada” had the highest ash content (2.0 %). High percentage carbohydrate was found in all the genotypes (51.5 - 86.9 %). Cv.“E4212” had the highest crude protein (7.94 %), while “Sipi” had the least (1.58 %). Cv.“E4197” had the least energy value of 262.94 J/Kg, while “Canada” had the highest value of 398.82 J/Kg. “Canada” had the highest fat content (3.5 %), while “Sipi” and “Faro14 (I)” both contained the least fat (0.5 %). “China” and “Mass (II)” similarly had the highest percentage of crude fibre (2.5 %), while “E4334”, “Faro 25 (II)” and “Mass (I)” all had the least value of 1.0 % for crude fibre. Cv.“E4197” had a very high moisture content of 9.6 % as against “E4212” which had the least moisture content of 5.0 %. In relation to mineral content, “Chinyereugo” was highest in calcium (0.13 %), “Faro1(I)” had the highest amount of Magnesium (0.26 %), “E4197” and “E4212” had the highest percentage of phosphorus (0.55 %),“E4197” and “E4212” had the highest concentration of potassium (0.23 %), while “Canada”, “Faro15 (II)” and “Chinyereugo” possessed the highest percentage of sodium (0.17 %). One of the newly introduced hybrid varieties “E4212” had relatively higher protein and mineral contents, but less fat content. “Sipi” variety has no special quality attributes over the other existing local rice varieties apart from the fact that it is among the varieties that contain relatively low fat percentage just as “Faro 14”. The “Faro” varieties showed good proximate and mineral composition values which consumers would desire. The high premium presently placed on “Mass” varieties is uncalled for, since it has got no special characteristics over most other varieties. Consumers and farmers should therefore be better informed on the choice of rice varieties based on their nutritional quality attributes.
Keywords: Rice, Proximate Composition, Mineral Content, Hybrid , Indigenous Varieties
Article Outline
1. Introduction
- Rice, a major commodity in world trade, provides 20 % of the world’s dietary energy supply[1]. It is utilized mostly at the household level, where it is consumed as boiled or fried with stew as in Nigeria. The rice grain consists of 75-80 % starch, 12 % water and only 7 % protein with a full complement of amino acids. Its protein is highly digestible with excellent biological value and protein efficiency ratio owing to thepresence of higher concentration (~ 4 %) of lysine[2]. Minerals like calcium, magnesium and phosphorus are present along with some traces of iron, copper, zinc and manganese[3]. In addition to being a rich source of dietary energy, rice is a good source of thiamine, riboflavin andniacin. Although the nutritional values of rice varies with different varieties, soil fertility, fertilizer application and other environmental conditions, the following trend still exist by comparison with other cereals: low fat content after the removal of the bran, low protein content (about 7-10 percent), and higher digestibility of the protein. Freshly harvested rice grains contain about 80 % carbohydrates which include starch, glucose, sucrose, dextrin, etc. Varieties of rice with high protein and vitamin (vitamin A) content have been obtained through genetic engineering[3].Whole rice is milled before marketing. The milling process produces four fractions: brown rice, hull, white rice and bran. Each of these fractions can vary in chemical content according to the variety of rice and the type of milling performed. Unmilled rice contains a significant amount of dietary fibre and more nutrients than milled or polished white rice. Most rice is consumed as white polished grain despite the valuable food content of brown rice. The complete milling and polishing that converts brown rice into white rice destroys 67 % of the vitamin B3, 80 % of the vitamin B1, 90 % of the vitamin B6, half of the manganese, half of the phosphorus, 60 % of the iron, and all of the dietary fibre and essential fatty acids[4]. These nutrients are lost when bran is removed during milling. Health conscious people in Europe where rice is not a staple food prefer brown rice. Pomeranz[5] reported that rice composition differs according to the variety and processing method used. The potential of rice to contribute to the supply of essential dietary lipids is generally underestimated. This may be due to the fact that the predominant form of rice available in the market is milled rice, which only contains negligible amounts of lipids. Almost all of the rice’s oil content is located in the outer layers of the grain, which are removed during milling. The lipid or fat content of rice is mainly in the bran fraction (20 %, dry weight basis), specifically as lipid bodies or spherosomes in the aleurone layer and bran. However, about 1.5 to 1.7 % is present in milled rice, mainly as non-starch lipids extracted by ether, chloroform-methanol and cold water-saturated butanol[6]. Rice lipids, commonly denoted as oil (‘rice bran oil’) due to its liquid character at room temperature, are characterized by a high nutritional value. The high proportion of unsaturated fatty acids, accounting for up to 80 %, causes the liquid consistency of the oil. Due to its high level of unsaturation, rice bran oil is known to have blood cholesterol lowering effects. The major unsaturated fatty acids in rice oil are oleic acid (a monounsaturated acid) and linoleic acid (an essential polyunsaturated fatty acid). After carbohydrate, protein is the second most abundant constituent of rice[7]. Rice protein is of very high quality as compared to other food crops. Rice is nutritionally superior to many other foods that are rich in carbohydrates. The protein content of the grain, although subject to extreme varietal and environmental variability, averages about 7 % in milled rice and 8 % in brown rice[8].The amino acid balance of rice protein is exceptionally good. Lysine content, for example, averages about 3.8 to 4.0% of the protein. Protein quality is determined by the amino acid composition and by its digestibility[9]. The amino acid profile of rice shows that it is high in glutamic and aspartic acid, while lysine is the limiting amino acid[1]. Rice is a good source of insoluble fibre. Insoluble fibre reduces the risk of bowel disorders and fights constipation. Dietary fibre is highest in the bran layer (and the hull) and lowest in milled rice. The bran layer of brown rice provides valuable dietary fibre. One cup (160g) of cooked brown rice contains around 2.4 g of dietary fibre, which equates to 8 % of an average man’s daily fibre needs and 9.6% of an average woman’s daily fibre needs[1].Minerals are chiefly located in the bran of the rice grain. Therefore, rice can only contribute significantly to the iron supply if it is eaten as brown rice[9].Traditionally, Ebonyi farmers are rice producers growing many varieties and prone to accepting any new varieties with seemingly better grain yield without considering its nutritional value. Therefore, there is need to assess the quality of new varieties being introduced into the state and compare them with the local varieties in order not to lose the already existing varieties which may even be better than the new ones in overall merit. A critical comparison of previous and new rice varieties in Ebonyi State with a view to determining their nutritional worth, and advising farmers and consumers accordingly is of utmost importance. The objective of this work is, therefore, to evaluate the proximate and mineral composition of the selected indigenous and newly introduced rice varieties as an index of their nutritional worth.
2. Materials and Methods
2.1. Plant Materials
- A total of fifteen rice cultivars were collected from Ebonyi rice farmers at their farm sites during harvest: five rice cultivars from each of the three senatorial zones of Ebonyi State. In addition, five of the newly introduced hybrid rice varieties were collected from the Alliance for a Green Revolution in Africa (AGRA) rice project at the Biotechnology Research and Development Centre of Ebonyi State University, Abakaliki. The different rice cultivars were all planted out under similar conditions. At maturity, the grains were harvested, processed and taken to the Cereal Services Laboratory, National Cereals Research Institute, Badeggi, Niger state for analysis.
2.2. Determination of the Proximate Composition of the Rice Cultivars
- Proximate composition of rice grain was determined using the AOAC methods[10] as follows:
2.2.1. Determination of Moisture Content
- Moisture was determined by Standard Official Methods of Analysis of the AOAC[10](method 14:004). This involved drying to a constant weight at 100 0C and calculating moisture as the loss in weight of the dried rice samples. The crucible was thoroughly washed and dried in an oven at 100 0C for 30 min and allowed to cool inside desiccators. After cooling, they were weighed using weighing balance and their various weights recorded as (W1). Then, 2.0 g of the finely ground rice samples were put into the crucibles and weighed to get W2. Thereafter, the sample plus crucible were placed inside the oven and dried at 100 0C for 4 hours, cooled and weighed at the same temperature for 30 min until constant weights were obtained to get W3. Then, the moisture content of the rice sample was calculated from the equation:
 where, W1 = Initial weight of empty crucible , W2 = Weight of crucible + sample before drying and W3 = Final weight of crucible + sample after drying.
2.2.2. Determination of Ash Content
- Total ash of the rice sample was determined by Furnace Incineration described by AOAC[10] (method 14:006) based on the vaporization of water and volatiles with burning organic substances in the presence of oxygen in the air to CO2 at a temperature of 600 0C (dry ashing). About 1.0 g of finely ground dried sample was weighed into a 277 tared porcelain crucible and incinerated at 600 0C for 6 hr in an ashing muffle furnace (Model 1184A Fisher Scientific, Houston, TX) until ash was obtained. The ash was cooled in a dessicator and reweighed. The % ash content in the rice sample was calculated as:

2.2.3. Determination of Crude Fibre
- Crude fibre was determined using the method of AOAC[10] (method14:020). About 2.0 g of the rice sample was hydrolyzed in a beaker with petroleum ether after which it was boiled under reflex for 30 min with 200 ml of a solution containing 1.25% H2SO4 per 100 ml of solution. The solution was filtered through a filter paper onto a fluted funnel. After filtration, the samples were washed with boiled water until they were no longer acidic. Then, the residue was transferred onto a beaker and boiled for another 30 min with 200 ml of solution containing 1.25 % NaOH per 100 ml. The boiled samples were washed with boiled distilled water. The residues were filtered through Gooch filter crucible, dried at 1000C for 2 hours in an oven, cooled and washed. The percentage crude fibre in the rice sample was calculated as per the formula:

2.2.4. Determination of Fat
- Total fat in the rice sample was determined using Soxhlet extraction for 4 hr starting with methanol and ethanol, respectively[11]. About 250 ml clean boiling flasks were dried in an oven at 105 – 110 0C for about 30 min and cooled in a dessicator. Approximately, 2.0 g of samples were weighed accurately into labeled thimbles. The dried boiling flasks were weighed correspondingly and filled with about 300 ml of petroleum ether (boiling point 40 -60 0C). The extraction thimbles were plugged tightly with cotton wool. After that, the Soxhlet apparatus was assembled and allowed to reflux for 6 hrs. The thimble was removed with care and petroleum ether collected from the top container and drained into another container for re-use. After that, the flask was dried at 105 – 110 0C for 1 hour when it was almost free of petroleum ether. After drying, it was cooled in a dessicator and weighed. Then, % fat in the rice sample was computed using the formula below:
2.2.5. Determination of Protein
- The crude protein content of the rice samples was determined using the Microkjeldahl method of AOAC[12], which involved protein digestion and distillation.a. Protein Digestion: About 2.0 g of the rice sample was weighed into a Kjeldahl flask and 4 tablets of Kjeldahl Catalyst were added. This was followed up with the addition of 1.0 g copper sulphate and a speck of selenium catalyst into the mixture, and 25 ml concentrated sulphuric acid was introduced. The whole mixture was subjected to heating in the fume cupboard. The heating was done gently at first and increased with occasional shaking till the solution assumed a green color. The temperature of digester was above 420℃ for about 30min. The solution was cooled and black particles showing at the neck of the flask were washed down with distilled water. The solution was re-heated gently at first until the green color disappeared. Then, it was allowed to cool. After cooling, the digest was transferred into a 250 ml volumetric flask with several washings and made up to the mark with distilled water and then distilled using Markham distillation apparatus.b. Protein Distillation: Before use, the Markham distillation apparatus was steamed through for 15 min after which a 100 ml conical flask containing 5 ml boric acid /indicator was placed under the condenser such that the condenser tip was under the liquid. About 5.0 ml of the digest was pipetted into the body of the apparatus via a small funnel aperture. The digest was washed down with distilled water followed by addition of 50 ml of 60 % NaOH solution. The digest in the condenser was steamed through for about 5-1 minutes after which enough ammonium sulphate was collected. The receiving flask was removed and the tip of the condenser washed down into the flask after which the condensed water was removed. The solution in the receiving flask was treated with 0.01M hydrochloric acid. Also, a blank was run through along with the sample. After titration, the % nitrogen was calculated using the formulae below:
 where, Vs = Volume (ml) of acid required to titrate sample; VB = Volume (ml) of acid required to titrate the blank; Macid=Molarity of acid; W=Weight of sample (g).Then, percentage crude protein in the rice sample was calculated from the % Nitrogen as:
 where, F(conversion factor), is equivalent to 6.25.
2.2.6. Determination of Carbohydrate
- The total percentage carbohydrate content in the rice sample was determined by the difference method as reported by Onyeike et al[13]. This method involved adding the total values of crude protein, lipid, crude fibre, moisture and ash constituents of the sample and subtracting it from 100. The value obtained is the percentage carbohydrate constituent of the sample. Thus:

2.3. Determination of the Mineral Content of the Rice Cultivars
- The mineral content of the rice samples were determined using the methods of the AOAC methods as described by James[14]. Calcium, Magnesium, Sodium and Potassium were determined by Atomic Absorption Spectrometry. Briefly, about 1.0 g of rice sample was first digested with 20 ml of acid mixture (650 ml Conc. HNO3, 80 ml Perchloric acid, 20 ml H2SO4) by weighing the sample into a digestion flask followed by addition of the 20 ml acid mixture. The digestion flask containing the sample and the digestion acid mixture was heated until a clear digest was obtained. The digest was later diluted with distilled water to 500 ml mark. After obtaining the digest, aliquots of the clear digest were used for atomic absorption spectrophotometry using filters that matched the different elements. The concentration of Calcium, Magnesium, Sodium and Potassium were determined with their calibration curves prepared with their standard solutions. The percentage values were later calculated by multiplying the concentrations by 100.Phosphorus was determined by Molybdate Method[14]. Briefly, about 0.5 ml of the mineral digest and 9.5 ml of 10 % trichloroacetic acid were put into a test tube. This was followed by agitation for 5 min. and then filtered through a filter paper. About 5 ml of the filtrate was then measured into a cuvet. Also, 5 ml of trichloroacetic acid and 5 ml of the working standard were also measured into two cuvets which served as a blank and standard, respectively. About 0.5 ml of molybdate reagent was then added to each test tube and mixed. Similarly, 0.2 ml of sulphuric acid reagent was added and the contents were stoppered, mixed and allowed to stand for 10 min. The absorbance of the test sample and standard were read in a Spectrophotometer at 660 nm with the blank set at zero. The % Phosphorus (P) was then calculated as follows: Absorbance of test sample X Conc. of Standard (5 mg/dl) x100 Absorbance of Standard.
2.4. Statistical Analyses
- All data were analyzed by the Analysis of Variance (ANOVA) procedure using SAS software version 9.1(SAS Institute, 1998). Differences were declared statistically significant at P < 0.05. Where significant differences were detected, the means were separated by the least significant difference (LSD) at 5 % probability level. Interrelationships among traits values were estimated using the Pearson correlation coefficient.
3. Results
3.1. Variation in Proximate Composition among the Rice Cultivars
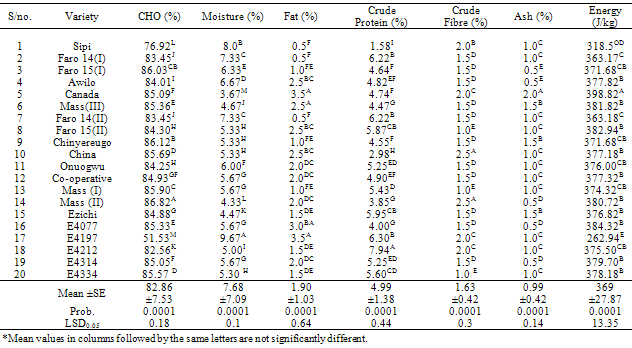
- The result of the proximate composition observed among the 20 cultivars is as shown in Table 1. The carbohydrate content in the varieties ranged between 51.50 - 86.92 % with a mean value of 82.86 ± 7.52 %. Apart from one of the newly introduced hybrid rice variety “E4197” which had a very low carbohydrate percentage, virtually all the rice varieties have appreciably high carbohydrate content (Table 1). The variation in values for carbohydrate among the varieties was statistically significant (P = 0.0001) with real differences occurring among the varieties (LSD0.05) in their carbohydrate content. A wide range of values (3.66 – 35.70 %) were observed for moisture content among the 20 varieties,
|
|
|
3.2. Variation in Mineral Composition among the Rice Cultivars
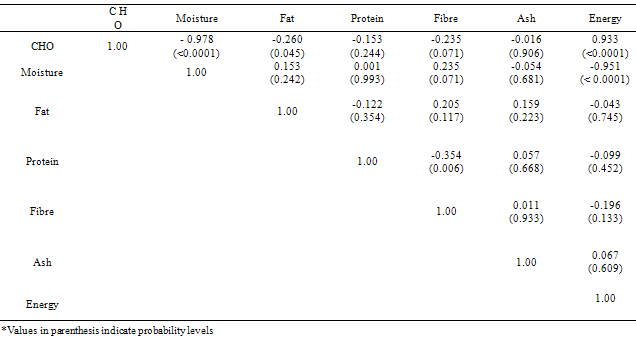
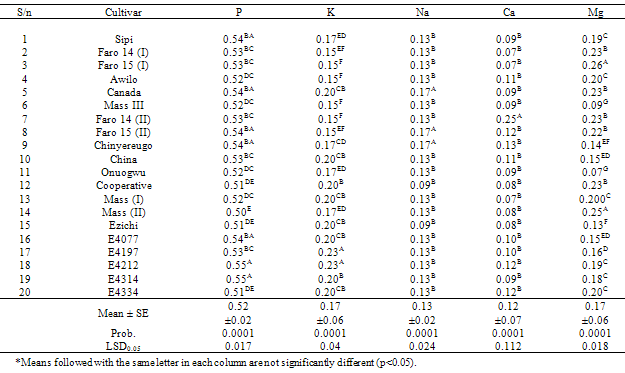
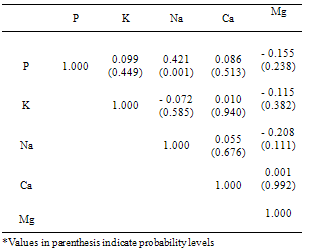
- The phosphorus content varied widely from 0.50 – 0.55 %, with a mean value of 0.52±0.02 %. Two of the newly introduced rice cultivars “E4212” and “E4313” had the highest value of phosphorus (0.55 %), followed by “Sipi”, “Canada”, “Faro 15(II)”, “Chinyereugo” and “E4077” (all of which had a mean phosphorus content of 0.54 %), while “MASS II” had the least value of phosphorus (0.50 %) among the rice cultivars (Table 3). The potassium, sodium, calcium and magnesium values obtained in the 20 rice cultivars ranged from 0.15 – 0.23 % (with a mean value of 0.17±0.06 %), 0.09 – 0.17 % (with a mean value of 0.13±0.02 %), 0.07 – 0.25 % (with a mean value of 0.12 ± 0.07 %), and 0.07 – 0.25 % (with a mean value of 0.17±0.06 %), respectively. The variability observed in the mineral composition was neither restricted to the ecological zones from which they were collected nor peculiar to the newly introduced rice cultivars, though the mineral content was also high in most of the newly introduced rice varieties. Table 4 shows the correlation coefficients among the minerals in the analysed rice cultivars: P, K, Na, Ca and Mg. Significant correlations (p = 0.001) were found only between Na and P, though the correlation coefficient was only moderate (42.1 %).
|
4. Discussion
- The variety “Canada” had the highest amount of ash, followed by “Mass I”, “Chinyereugo” and “Ezichi”, while “Faro15 (I)”, “Awilo”, “E4077”, “E4314” and “Mass II” had the least values. This study provided an insight into the mineral content in these varieties. The percentage carbohydrate obtained in most of the varieties was a bit higher than that obtained by Ibukun[15] and Edeogu et al[16]. However, the mean percentage carbohydrate of 82.86± 7.53% was found to be within the range reported in the literature. Apart from “E4197” which had a comparatively low carbohydrate percentage, virtually all the rice varieties similarly had higher values for percentage carbohydrate. This observed high carbohydrate content among the varieties is not surprising as rice is a well known carbohydrate food source. However, the low percentage carbohydrate in “E4197” may be attributed to its high moisture content[17] and other environmental factors. Cultivars “E4212”, “E4197”, “Faro14 (I)” and “Faro 14 (II)” should be highly prized because of their relatively higher percentage of crude protein. Some of the varieties had varying levels of protein which could be said to be low when compared to the reported values of Eggum et al[18]. This might be as a result of genotype and environmental differences. It is worthy to note that the amino acid balance of rice protein is exceptionally good[8]. On the other hand, “Sipi” and “China” had values of crude proteins far below the reported average. Besides genotypic variation, edaphic factors and some other environmental factors lower the protein content of rice. Therefore, any of these factors might be responsible for low values in protein observed in “Sipi” and “China” varieties. “E4197” had the least energy value, followed by “Sipi”. Other varieties had high values which were statistically similar to one another. This confirms that rice is an energy-giving food. The correlation between energy and fat was negative in direction, as also was the correlation between percentage fibre and protein among the varieties studied. This suggests a negative relationship occurring between energy and fat, as well as fibre and protein content. The percentage carbohydrate and energy value was expectedly strongly correlated and positive in direction, suggesting correlated response for high energy value when rice cultivars are selected on the basis of high carbohydrate content.The range of values obtained for percentage fat does not signify that percentage fat is considerably low among the varieties as they are in line with the values obtained by Ibukun[15] in some varieties of white rice. The varieties “Canada” and “E4197” had the highest amount of fat, followed by “E4077”. The effect of excess intake of dietary fat has some well-established health implications especially for the overweight. The consumption of excess amounts of saturated fats has been recognized as the most important dietary factor aiding increased level of cholesterol. Besides the cholesterol implications due to high fat intake, obesity is a factor in the causation of disease[19]. In this regard, “Sipi”, “Faro14 (I)”, “Faro14 (II)” and “Faro15 (I)” could be said to be better preferred. However, rice lipids, commonly denoted as oil (‘rice bran oil’) due to its liquid character at room temperature, are characterized by a high nutritional value. The high proportion of unsaturated fatty acids, accounting for up to 80 %, causes the liquid consistency of the oil. Because of its high level of unsaturation, rice bran oil is known to have blood cholesterol lowering effects[6].Cultivars “China” and “Mass II” had the highest percentage of crude fibre. This could be said to be a good quality trait because rice is a good source of insoluble fibre. Insoluble fibre reduces the risk of bowel disorders and fights constipation[2]. A diet low in fibre can lead to a wide range of ailments and conditions, especially among the urban dwellers that consume more refined foods. On the other hand, “E4334”, “Faro 25(II)” and “Mass I” had the least value for percentage crude fibre. “E4197” cannot be stored for a long time because of its high moisture percentage since less moisture content in foods helps in long-term storage of the foods, while “Canada” and “Mass I” having the least percentage moisture have the potential of long term storage. Other varieties with the exception of “Sipi” had low values of percentage moisture as well. This may be as a result of hydrological status or agronomic potential[16]. Increased moisture content may also likely affect the milling characteristics and palatability of cooked rice. Unlike the proximate values of rice, only trace amounts of mineral elements were found especially for the mineral elements such as calcium, potassium, sodium and magnesium. This is expected since the mineral content is just from the percentage ash content of the rice. Edeogu et al.[16] reported that the ash content of a food sample gives an idea of the mineral elements present in the food sample. More so, since greater amounts of rice bran are removed from the grain during milling and polishing, more minerals are lost[20]. The mineral with the highest concentration was nitrogen, which was used in the computation of crude protein. In general, the levels of minerals from some of the varieties like “Canada” and “Faro 14” varieties are high. This may be due to genetic factors or the mineral content of the soil[20]. However, the percentage mineral content of the five newly introduced hybrid rice varieties studied shows that the values were slightly lower than that reported by Ibukun[15], except for nitrogen. The rate of fertilizer application and the native fertility of paddy fields have been shown to affect the mineral element levels of rice[21]. Therefore, the decreases in the values obtained for the mineral elements may be attributed to any and/or all of these factors. However, the five newly introduced hybrid rice varieties were still within the acceptable standard in terms of mineral contents of rice. Significant correlation among the mineral elements was only observed between Na and P, suggesting that calcium, magnesium and potassium may be independently selected in a breeding program directed at the improvement of mineral content in rice.
ACKNOWLEDGEMENTS
- We wish to gratefully acknowledge the National Cereals Research Institute, Badeggi (Nigeria) for the helpful contribution in the Laboratory analyses and the Alliance for a Green Revolution in Africa (AGRA) based at Ebonyi State University for the new rice hybrid varieties used in this study.