-
Paper Information
- Paper Submission
-
Journal Information
- About This Journal
- Editorial Board
- Current Issue
- Archive
- Author Guidelines
- Contact Us
International Journal of Agriculture and Forestry
2012; 2(2): 1-5
doi: 10.5923/j.ijaf.20120202.01
Farm – Level Determinants of Agricultural Commercialization
 Abstract
 Reference
 Full-Text PDF
 Full-Text HTML
Chukwukere Austin Okezie 1, Jamalludin Sulaiman 1, Aloysius Chidi Nwosu 2
1School of Social Sciences, Universiti Sains Malaysia 11800 USM, Penang, Malaysia
2Department of Agricultural Economics, Michael Okpara University of Agriculture, Umudike, P.M.B.7267 Umuahia, Abia State, Nigeria
Correspondence to: Chukwukere Austin Okezie , School of Social Sciences, Universiti Sains Malaysia 11800 USM, Penang, Malaysia.
| Email: |  |
Copyright © 2012 Scientific & Academic Publishing. All Rights Reserved.
The study examined the increasing commercialization of subsistence agriculture and identified the driving forces of the commercialization process. The study defined some concepts under which the process of agricultural commercialization was examined. The study was conducted in the three agricultural zones of Abia state, Nigeria. A total of 120 farm families spread across the state were enlisted for the study. Data were collected bimonthly for a period of six months with structured questionnaires. Data analysis involved the use of descriptive statistics and quantitative techniques. Results show that agriculture is not subsistence oriented. There is some considerable degree of market-orientation. Off- farm income was identified as important source of the commercialization of agriculture. The farm-level determinants of commercialization were labour, fertilizer and planting materials. The production elasticity of labour is high and there are diseconomies of scale. The study observes that the full potentials of agriculture have not been harnessed as agriculture is labour intensive and relies heavily on crude implements.
Keywords: Determinants, Agriculture, Subsistence, Commercialization, Farm-Income
Article Outline
1. Introduction
- There is widespread agreement that agriculture is central to economic growth in the countries of sub-Saharan Africa, since it is thought to account for 70 percent of total employment, 40 percent of total merchandize exports, and one-third of GDP, with these propositions being much higher in many countries of the region (Jaffer, 1992; DFID, 2002; Rahman and Manprasert, 2006). Economic growth, urbanization and the withdrawal of labour from the agricultural sector lead to the increasing commercialization of agriculture. Agricultural commercialization means more than the marketing of agricultural outputs, it means the product choice and input use decisions are based on the principle of profit maximization (von Braun et al 1991; Pingali and Rosegrant, 1995; Yoon-Donn and Yoon, 2009). Commercial reorientation of agricultural production occurs for primary stable cereals as well as for the so-called high value cash crops. On the input side, commercialization implies that both traded and non-traded inputs are valued in terms of their market value.Commercialization of agricultural systems leads to greater market orientation of farm production; progressive substitution out of non-traded inputs in favour of purchased inputs; and the gradual decline of integrated farming systems and their replacement by specialized enterprises for crop, livestock, poultry and aquaculture products. The farm level determinants of increasing commercialization are the rising opportunity costs of family labour and increased market demand for food and other agricultural products.As economies grow, there is a gradual but definite move- ment out of subsistence food crop production, generally in a monoculture system, to a diversified market- oriented production system (Cohen, 1988; Delgado, 1995; von Braun, 1994; Panashat, 2011). The countries of East Asia are at the high end of the agricultural commercialization pathway, while Southeast Asia and parts of Latin America are rapidly moving towards commercialization. The countries of South Asia and much of Sub-Saharan Africa are at the lower end of the commercialization pathway (Norsida and Nawi, 2010). While the speed of commercialization differs substantially across continents and countries they are all moving in the same direction (Pingali and Rosegrant, 1995).A major question in the abundant literature of agricultural growth and development in sub-Saharan Africa is how to encourage peasants primarily engaged in subsistence farming to become market-oriented (Hinderink and Sterkenberg, 1987; Inmink and Alarcon, 1993; Kennedy, 1994; von Braun, 1995).In Nigeria despite government efforts to diversify the economy, the economy does not rely heavily on agricultural output, and agriculture’s role in the economy has declined. Besides high percentage of the labour force in agriculture food insecurity at the household level has become a major developmental challenge. This study was designed primarily to assess the extent of agricultural commercialization at the farm level and to ascertain the determinants of agricultural commercialization.
2. Methodology
2.1. Study Area
- The study was carried out in Abia State. Abia state is one of the thirty-six states of the Federal Republic of Nigeria. The state is located in the South East agro-ecological zones of Nigeria. Abia State lies between longitudes 7o00E and 8o00E and latitude 4o451N and 6o171N of the equator. The climate is tropical and humid all the year round. The rainy season ranges from March to October. The dry season occurs from November to February. The mean annual rainfall ranges from 2000mm to 2500mm with the southern areas receiving more than the northern areas. The temperature ranges between 22℃ minimum to 31℃ (maximum). The vegetation is predominantly lowland rainforest. The major crops grown are arable crops (e.g cassava, rice, yam etc). Others include banana, plantain, maize, vegetables etc. major cash crops grown in the state include oil palm, kolanut, cocoa, rubber and cashew. Other farming activities include sheep and goat rearing, poultry and rabbit keeping and off-farm activities especially processing and utilization (FOS, 1999). The population of the state was estimated at about 2.8 million in 1991 (NPC, 2006). The population density is about 364 persons/km2 with 63% in agricultural production. This largely informed the choice of the state for the study. The average household size is about six persons per family (FOS, 1999). Abia State comprises 17 Local Government Areas (L.G.A’s) divided into three agricultural zones namely, Aba, Ohafia and Umuahia. In Aba zone, there are seven L.G.A’s namely: Aba North, Aba South, Osisioma Ngwa, Obioma Ngwa North, Ukwa East, Ukwa West and Ugwunagbo. In Ohafia zone, there are five L.G.A’s namely: Isuiukwuato, Ohafia, Bende, Arochukwu and Umunneochi. In Umuahia Zone, there are five L.G.A’s namely: Umuahia North, Umuahia-South, Ikwuano, Isiala Ngwa North and Isiala Ngwa South. Umuahia however is the state capital. Abia State offers an interesting scenario in the study of agricultural commercialization. The state being mainly agra- rian with expanding population shows evidence of out- migration of the youths from the rural sector in search of white collar jobs and trading. The state produces many food crops and cash crops like cocoa, oil palm, cashew, rubber etc.
2.2. Sampling Procedure
- A total of 120 farm households were chosen from the three agricultural zones of Abia State. A multi-stage stratified random sampling technique was adopted in selecting respondent households. First, all the 17 LGA’s were listed to form a separate sampling frame from the three zones. Two Local Government Areas (LGA’s) was purposively selected from each of the zones making a total of 6 LGA’s, from the state. Secondly, from each of the 6 LGA’s, four farming communities were purposively selected. The essence of the purposive selection is to ensure that rural communities whose major occupation is farming were selected. Thirdly, in each of the 24 communities/villages, a list of farm households were compiled with the assistance of village heads and resident ADP extension agents. From each village, 5 households were randomly selected for the study.
2.3. Data Collection
- A variety of techniques including observation, recall, and direct measurement were used in the survey. Well-trained Enumerators who were resident Extension agents assisted in data collection. The pre-testing of questionnaire was undertaken and thereafter the study households were visited bimonthly over a six-month period.
2.4. Analytical Procedure
- The analytical approach adopted comprises a set of equations describing the key relationships involved in the commercialization process. They relate to a household’s time allocation, sources of income, spending of income, and determinants of the degree of subsistence. The analytical approach adapted is greatly applied in works on commercialization of agriculture (see von Braun, et al. 1991; Kennedy and Cogill 1987; von Braun and Kennedy 1994; Govereh and, Jayne 1996; Farouque and Tekeya, 2008). The term ‘subsistence’ as used in this study describes production of goods for consumption by the household. Accordingly, the term commercialization defines the volume of produce and household resources that enter the exchange economy. This includes off-farm employment of labour and capital. The extent of subsistence orientation and commercialization may be addressed from different angles. Agricultural subsistence orientation (Consumption concept) is measured by the extent to which farm households consume out of their aggregate agricultural produce as compared with the value of total agricultural produce:
 | (1) |
 AP = Total value of agricultural production
 In addition to this consumption – oriented concept, it can be imagined that subsistence agriculture develops towards “commercialization” on the input side but not on the output side; for instance, when farm households sell their labour in the off-farm labour market and invest proceeds in augmenting their subsistence production.A more comprehensive concept of commercialization will take into account the overall degree of market integration of rural households into the exchange economy and does not just look into agriculture. This may be approached from the income earning side (Income concept). Subsistence orientation at the income generation side of the household (Income concept), can be defined as follows:
  | (2) |
 | (3) |
 | (4) |
3. Results and Discussion
3.1. Household Subsistence Orientation: Concepts and Basic Patterns
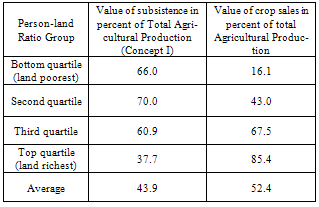
- The extent of subsistence orientation based on the criteria outlined in the methodology can be assessed by looking at the inter-relationship between farm size (Person-land ratio) and market integration. In Table 1 it is important to note that the average persons per hectare at the bottom quartile is 20, for the second quartile, it is 13.1, the third quartile is 8.1 and 2.6 persons for the top quartile. Equally, 78 percent of the sampled households fell within the top quartile (land-richest). The implication of this result from the table is that majority of the households (78 percent) retain only 37.7 percent of total agricultural production for subsistence. Thus households are more market-oriented as a greater percentage of agricultural production enters the exchange economy.Crop sales constitute the main source of marketed surplus and table 1 show that the land-richest sale 85.4 percent of the value of agricultural production far above the sample average of 52.4 percent. In the land – poorest group crops sales constitute only 16.1 percent of the total value of agricultural production. This implies that more the output enters the market.
|
|
|
3.2. Farm-Level Determinants of Agricultural Commercialization
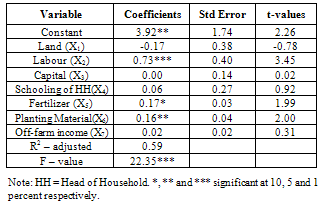
- Household production resources determine the degree of subsistence or agricultural commercialization in farm households. To explore the determinants of agricultural commercialization, an aggregated all-crop production function of the Cobb-Douglas type was specified. Results of the Cobb-Douglas production estimates are presented in Table 4.The variables included in the model were able to capture 58.7 percent of the variability in agricultural commercialization and the model result was significant at 1 Percent. The socio-economic factors of land, capital, management as proxied by schooling of head of household and off-farm income impinge were not found to be significant determinants of agricultural commercialization at the farm-level. However, labour, fertilizer and planting material were found to be significant determinants of agricultural commercialization. The production elasticity of fertilizer and planting material were found to be low, 0.167 and 0.164 respectively. The results of the econometric estimation show the dominant role of labour in the farm sector. The production elasticity of labour is high 0.73 which confirms the analogy that agriculture is still labour-intensive in the state. In principle, adding up the production elasticity of the three key factors of production (LAND, LABOUR, and CAPITAL) gives a rough indication of the nature of economies of scale. This exercise suggests that, the sum of production elasticity is 0.57, implying that there is diseconomies of scale. This is not surprising given the fact that the production technology is very much limited to hoe and cutlass. There is out-migration of the youths leaving farming to women and aged and retired persons. There is still higher opportunity of getting higher returns per unit of factor input given the diseconomies of scale observed in the study area.
|
4. Conclusions
- Commercialization of agricultural system is a universal phenomenon that is triggered by economic growth. To drive economic growth, policy direction shifted from subsistence production to commercialized systems. The extent of commercialization of agriculture in Abia State was captured by the concepts defined. Agricultural production is not subsistence-oriented as only 43.9 percent of agricultural production is for home consumption. Subsistence food production constitutes about 45.8 percent of total income. The value of own-production to total consumption value is 28.5 percent implying that households are market oriented in consumption. The farm-level determinants of agricultural commercialization were labour, fertilizer and planting materials This is however, a prior expected as agriculture is still labour intensive. The dominant role of labour of is indicated by the high production elasticity of labour 0.73 while that of fertilizer and planting materials were 0.167 and 0.164 respectively. The production elasticity of the factors of production indicates that there are diseconomies of scale in the study area. This is an indication that the potentials of agriculture have not been fully harnessed.