Atiqur Rahman1, Kaisar Khan2, Nir Y Krakauer3, Leonid Roytman3, Felix Kogan4
1ICET/SETAS, Centennial College, Room-A2-230, 941 Progress Ave., Toronto, ON, M1G 3T8, Canada
2School of Applied Technology, Humber College, North Campus, Toronto, ON M9W 5L7, Canada
3NOAA–CREST, CCNY, 138th Street and Convent Ave, New York, NY 10031, USA
4NESDIS/NOAA, 5200 Auth Rd. Camp Spring, MD 20746, USA
Correspondence to: Atiqur Rahman, ICET/SETAS, Centennial College, Room-A2-230, 941 Progress Ave., Toronto, ON, M1G 3T8, Canada.
| Email: |  |
Copyright © 2012 Scientific & Academic Publishing. All Rights Reserved.
Abstract
Weather related crop losses have always been a concern for farmers, governments, traders and policy makers for the purpose of balanced food supplies, demands, trade, and distribution of aid to nations in need. This paper discusses the utility of Advanced Very High Resolution Radiometer (AVHRR)-based vegetation health (VH) indices as proxies for modelling inter annual variation in Aman rice (AR) yield in Bangladesh and for early estimation. We compare annual local and hybrid AR yield with VH Indices computed for each week during 1991–2005. A strong correlation was found between AR yield and VH during the period of AR development that occurs during one/two months in advance of harvest (early October to early November). Stepwise principal components regression (PCR) was used to construct a model to estimate yield as a function of critical-period VH indices. The model reduced the yield prediction error variance by 97% and 92% compared with a prediction of average local Aman rice (LAR) and hybrid Aman rice (HAR) yield for each year respectively.
Keywords:
Rice Yield, Vegetation Health, Correlation, Regression
Cite this paper: Atiqur Rahman, Kaisar Khan, Nir Y Krakauer, Leonid Roytman, Felix Kogan, Use of Remote Sensing Data for Estimation of Aman Rice Yield, International Journal of Agriculture and Forestry, Vol. 2 No. 1, 2012, pp. 101-107. doi: 10.5923/j.ijaf.20120201.16.
1. Introduction
The major rice producing countries are China, India, Indonesia, Bangladesh, Myanmar, Vietnam and Thailand[1]. Bangladesh is a densely populated agriculture-based country and rice is the major crop of the country. The introduction of new crop varieties, increased utilization of chemical fertilizer, pesticides, exploitation of ground water for irrigation have significantly increased the rice crop yield over the country though the rate is still much below the highest attainable value[2]. In Bangladesh, nearly 50% of the cropland is double cropped and 13% is triple cropped[3]. As a result, much of the country has areas where the fraction of sown rice is over 90% of the land area. Rice ecosystems in Bangladesh are dominated by rain fed (over 50% of the rice area) and irrigation, although significant amounts of upland and deepwater rice still exist. Bangladesh produces near 40 million ton and imports one million ton rice yearly[4]. This paper focuses on rice because it is the largest and most widely cultivated food crop in Bangladesh. 150 million people of that country obtain 60–70% of their calories from rice and its products. Recent floods and cyclones have underscored the need for objective and quantitative informa-tion on crop conditions in a timely manners. Rice growth monitoring and yield estimation can provide important information for government agencies, commodity traders and producers in planning harvest, storage, and transportation and marketing activities[5]. Bangladesh has three rice crops/seasons within a year; the Boro crop, the Aman crop, and the Aus crop, which account for approximately 50%, 43%, and 7% of total annual rice production respectively[4]. Monsoon rains are most important for the Aman crop, harvested in November/December. Two varieties of Aman rice (ie. local and hybrid) are cultivated in Bangladesh. It also categorized as two plantings type namely broadcast and transplant Aman. This rice requires a special habitat of prolonged flooding. Most Aman is transplanted between end June to mid-August; however planting can occur as late as the last week of September and harvested in November/December (source: FAO). Aman rice phenology can be divided into three distinct phases: (1) vegetative phase (2) reproductive phase and (3) ripening phase. The vegetative phase starts at germination and ends at the onset of panicle initiation. The number of days in this phase varies in different varieties from 55–85 days. The reproductive phase is critical for Aman yield. It begins at panicle initiation and ends at flowering and characterized by culm elongation (which increases plant height), decline in tiller number, emergence of the flag leaf (the last leaf), booting, heading, and flowering. At this phase, the plant is most sensitive to stresses including low and high temperatures and drought. The ripening phase starts at flowering and ends at maturity. Rainy days or low temperatures may lengthen the ripening phase, while sunny and warm days may shorten it. The number of days in the reproductive phase and the ripening phase are the same among most rice varieties usually 30–35 days each[4].Higher Aman rice yields are associated with early rainfall and a milder flooding pattern. Production of Aman rice has suffered in some recent years due to unfavourable weather. Agriculture is always vulnerable to unfavourable weather events and climatic conditions. Despite technological advances such as improved crop varieties and irrigation systems, weather and climate are still key factors in agricultural productivity. Often the linkages between these key factors and production losses are obvious, but sometimes the linkages are less direct. The impacts of climate change on agricultural food production are global concerns, and they are very important for a country like Bangladesh. The role of temperature and rainfall at different growth stages has been investigated for Aman, Aus and Boro rice. Temperature seems to have positive effect on the yields of the three types of rice[2].Many empirical models have been developed to estimate crop yield before harvest. However, most of the methods require field data on crop conditions that are not easily available. The models’ complexity and their data requirements render them impractical for large-scale applications. Another approach uses weather data and models based on weather parameters[6]. Such techniques also bear a number of problems including the spatial distribution of the weather stations, incomplete and unavailable timely weather data, and weather observations that do not adequately represent the diversity of weather over the large areas where crops are grown. In particular, the weather station network in Bangladesh is not dense enough for efficient monitoring[2]. A crop monitoring system that provided timely and accurate information on crop status and yield well before the harvesting period and without requiring a dense ground-based observation network would be of great value. This paper investigates the potential of using remote sensing technology in this endeavour. AVHRR-based vegetation health indices were found to be very useful for early drought and flood detection and monitoring their impacts on crop and pasture production around the world[7]. Application of AVHRR-based vegetation health indices for characterization of the impact of weather conditions on Aman rice yield has also been investigated.
2. Study Area and Data
The study area is Bangladesh, bounded between 20°34" and 26°38" north latitude and 88°01" and 92°41" east longitude (http://www.bangladeshgov.org/bdmaps). Bangladesh lies in the Indo-Gangetic plain of South Asia, bordered by India to the west, north and north-east, Myanmar to the south-east and Bay of Bengal to the south. The territory is situated on one of the largest, complex deltas in the world where the Ganges, Brahamaputra and Meghna rivers enter the Bay of Bengal. Climate of Bangladesh is sub-tropical warm, wet and humid[8]. The country experiences natural disasters such as excessive rainfall (floods), droughts and tropical cyclones, which can negatively impact agricultural yield. There are three seasons: a hot or summer season (March to June), a warm and humid monsoon season (June to September) and a cold and dry season (October to February)[2]. The annual average rainfall varies from 1,500 mm to 5,000 mm, temperature and humidity range is 12–30℃° and 65–90%[8]; respectively. Bangladesh has 6 administrative Division: Barisal, Chittagong, Dhaka, Khulna, Rajshahi and Sylhet. Aman rice is mainly grown on the floodplains and deltas of the Meghna, Jamuna, and Ganges river systems[9].
2.1. Aman Rice
Aman rice production data were collected from the Bangladesh Bureau of Statistics, which estimates Aman rice production and area sown from sampling surveys. Yield was calculated by dividing total Aman production by the sown area[4].
2.2. Satellite Data
Satellite sensor data included AVHRR-measured solar energy reflected/emitted from the land surface (in 8–bit counts) collected from the National Oceanic and Atmospheric Administration (NOAA) Global Vegetation Index (GVI) dataset from 1981 through 2005. Spatial data resolution was 4 square km, sampled to 16 square km, and the original temporal resolution of 1 day was sampled to 7–day composite[7]. The GVI counts in visible (VIS, 0.58–0.68μm, Ch1), near infrared (NIR, 0.72–1.00μm Ch2) and infrared (IR, 10.3–11.3μm, Ch4) spectral regions were used in this research. Post-launch–calibrated VIS and NIR counts were converted to reflectance[9] and used to calculate the nor malized difference vegetation index (NDVI= (NIR –VIS)/ (VIS+NIR)). The Ch4 counts were converted to brightness (radiative) temperature (BT).In order to reduce long-term systematic errors in GVI time series the following procedure was used: The VIS and NIR channel values were post launch calibrated following Kidwell[10] and normalized by the cosine solar zenith angle (SZA) and corrected for Sun-Earth distance. Quality/cloud (QC) masks were developed for each weekly image based on climatology of channel 4 temperatures. For data smoothing a combination of a compound median filter and the least square technique was applied to the weekly time series. This smoothing completely eliminates high frequency outliers, including random effects and pulled out low-frequency weather related fluctuations (valleys and hills in the NDVI and BT time series) during the annual cycle. After smoothing, inter-annual differences due to weather variations in NDVI and BT became more apparent[11]. Furthermore, previous research showed that when VH indices are correlated with yield anomalies, correlation coefficient increases considerably during the critical period of crop growth and development. This fact alone indicates that VH indices can be used as proxies for assessment of crop conditions and productivity [6,11].
3. Methodology
3.1. Aman Rice
With the development of technology (breeding, mechanization, fertilizer, etc) over long period yield of any crops is constantly improving. These improvements of yield can be approximated by either linear or non-linear depending on longevity of yield series and climate contribution and described trend in yield time series. At a general background of the technology-related trend, yield fluctuates around the trend from year to year due to weather variation. If weather is favourable for crop growth yield exceeds the level estimated from the trend and in case of unfavourable weather yield drops below the trend. Yield time series were separated into two components: technology-related trend and yield deviation from the technological trend. The first characterizes long-term yield tendency associated with technology change and the second characterizes variation of yield around the trend due to year to year weather fluctuations. The second component is normally expressed as a ratio of actual to trend-estimated yield.The research strategy of this paper was to: (1) extract the weather component from Aman rice annual yield, NDVI and BT values and (2) correlate the weather-related component of yield with the corresponding components of NDVI and BT. The latter two were expressed in the form of VH indices[7]. The goal was to investigate the strength of the relationship and determine if the strongest correlation coincides with AR's critical period, which is the period when AR production is highly sensitive to weather conditions.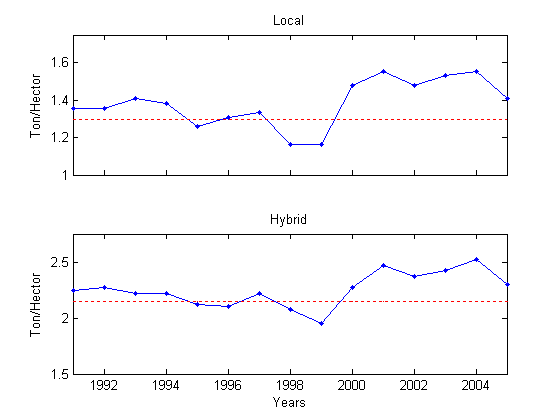 | Figure 1. Production of Aman rice per hector in Bangladesh and trend line |
Following Brockwell and Davis[12], we first attempted to fit a linear trend to model secular, non-weather-related variation in the local and hybrid AR yield time series (Figure 1).We expressed the variations in rice yield following equation: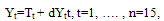 | (1) |
Where, Tt is a slowly changing function representing the deterministic component (trend) which is regulated by agricultural technology and dYt is a random component regulated by weather fluctuations.The deterministic component (Tt) was estimated using the least squares method. If the yield time series are longer than 30–35 years they might be approximated by a second degree polynomial, e.g. 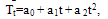 | (2) |
By choosing the parameters a0, a1 and a2 to minimized  . For shorter time series, as in our case, linear approximation is sufficient to satisfy the minimum criteria.The random component (dY) was expressed as a ratio of observed to trend-estimated yield.
 | (3) |
Figure 2 shows that both LAR and HAR yield increases; this is due to technology improvement. For any year, trend estimates that yield level which is associated with the contribution of agricultural technology to crop production line provided that the weather was near normal (close to the multi-year mean). Yield deviation from the average is associated with weather fluctuations. For example, deviation of LAR yield from the average value in 1999 and 2001 were estimated at 83 and 109, respectively, indicating 17% yield reduction in 1999 due to unfavourable and 9% increase due to favourable weather in 2001.
3.2. Vegetation Health Indices
GVI data set was developed by sampling 4 square km Global Area Coverage (GAC) data to 16 square km spatial resolution and daily observations to seven-day composite [7,10]. The principle for constructing VH indices stems from the properties of green vegetation to reflect VIS and NIR and emit IR solar radiation. If vegetation is healthy it reflects little radiation in the VIS (due to high chlorophyll absorption of solar radiation), much in the NIR (due to scattering of light by leaf internal tissues and water content) and emits less thermal radiation in the IR spectral bands (the transpiring canopy is cooler). As a result, for healthy vegetation, NDVI is large and BT is small. Conversely, for unhealthy vegetation, NDVI is small and BT large [13].The VH indices were calculated from NDVI and BT. Here, only important steps are mentioned, which include (a) complete elimination of high frequency noise from NDVI and BT annual time series, (b) approximation of annual cycle, (c) calculation of multi-year climatology and (d) estimation of medium-to-low frequency fluctuations during the seasonal cycle (departure from climatology) associated with weather variations. The Vegetation Condition Index (VCI) characterizing moisture and Temperature Condition Index (TCI) characterizing thermal conditions were calculated as: | (4) |
 | (5) |
where NDVI, NDVImax, NDVImin, BT, BTmax and BTmin are the smoothed weekly NDVI (BT) and their 1991–2005 absolute maximum and minimum (climatology), respectively. The VH indices range from 0 (severe vegetation stress) to 100 (favourable conditions)[7].
4. Aman Rice and the Environment
The Aman crop experiences extremes of dry and wet conditions over its long growing season. Temperature has positive effect on the yields of all three rice seasons in Bangladesh. In case of Aman rice, rainfall at the early stage seems to be negatively correlated. However, during the growing and flowering stages, the rainfall seems to be positively correlated. 80–90% of the total rainfall occurs within four months from June to September. December to mid- March is almost rainless. For rain-fed crop Aman, during panicle initiation & flowering stage water shortage normally occurs. Due to shortage of water, fertilizer cannot be transferred from soil to leaves for uninterrupted photosynthesis during limited daytime. As a result crop yield is reduced and more empty grains are produced. Monsoon rains are most important for the Aman crop, harvested in November/ December[1].Satellite data were collected for 6 administrative divisions of Bangladesh. In each administrative division spatial average values of VH were calculated for each week during 1991–2005. Weekly VH indices for Bangladesh as a whole were calculated as average vegetation health indices for the six administrative divisions.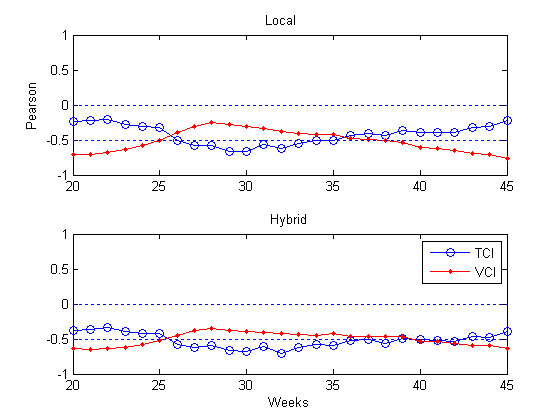 | Figure 2. Dynamics of correlation coefficient for dY versus VCI and TCI |
5. Results and Discussion
Since dY and VH indices were similarly expressed as a deviation from climatology (from the mean value for yield and from max-min for VH), further examination included correlation and regression analysis of these deviations to investigate the association between them for LAR and HAR. Figure 2 shows dynamics of correlation coefficients for DY versus VCI and TCI between weeks 20 (end of May) and 45 (early November). These results were analyzed first, to interpret the response of AR yield to moisture (VCI) and thermal (TCI) conditions expressed by the vegetation health indices. As seen in Figure 2, for dY for both type AR is highly correlated with VCI And TCI during early October to early November (weeks 40–43). Correlation coefficients for LAR VCI (–0.6–0.69) and TCI (–0.39–0.40) and HAR is VCI (–0.53–0.59) and TCI (–0.46–0.53). This period is known as very critical for both types of Aman yield, because Aman rice yield goes through reproductive phase begins at panicle initiation and ends at flowering and ripening phase starts at flowering and ends at maturity.The observed negative correlation of dY with VCI indicates that above average AR yield is associated with dryer conditions (VCI<50 or reduced vegetation greenness, Equation 2). Oppositely, low yield is associated with moist conditions (VCI>50 or larger vegetation greenness). This confirms that in average wet climate excessive rainfall during monsoon season negatively affects average Aman yield production. The observed negative correlation of yield with Vegetation Health Indices indicate that below average AR yield is associated with higher TCI (cooler thermal condition) and VCI (high rainfall) and above average yield is associated with lower TCI (hotter) and VCI (lower rainfall) during weeks 40–43[14]. In the statistical analysis we used both bivariate correlations and multiple regressions. The bivariate correlations (Figure 2) revealed that dY for LAR and for HAR were significantly related to VCI and TCI for weeks 40–43 at p<0.05 significance level. Therefore, in multiple regression analysis, dY was regressed on the linear combination of VCI and TCI (40–43) values.The results of fitting the ordinary least squares (OLS) regression model given by equation (6) and (7) to LAR and HAR respectively, are shown in Table 1.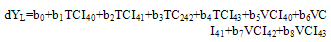 | (6) |
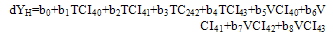 | (7) |
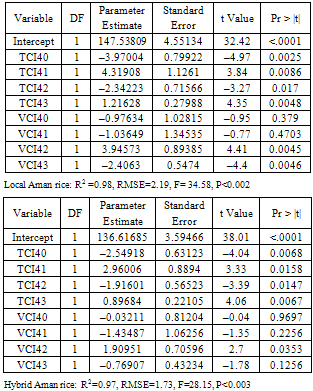
A comparison of the relative degree of statistical significance of the model with those of the partial regression coefficients reveals multi-collinearity. The overall model is highly significant with F values of 34.58 (LAR), 28.15 (HAR) and p values much smaller than 0.05. The p value for some of the partial regression coefficients is not significant at 0.05. This type of result is a natural consequence of multi-collinearity: the overall model may fit the data quite well, but because several independent variables are measurement similar phenomena, it is difficult to determine which of the individual variables contribute significantly to the regression relationship. However, VH indices of neighbouring weeks are highly correlated as seen in Table 2. For example the correlation coefficient between TCI40 (week 40, October) with TCI41 is 0.99. Table 1. Results of multiple linear regressions (OLS) of DY on the equation (6) and (7)
 |
| |
|
This high correlation among the independent variables is called collinearrity. The existence of multi-collinearity tends to inflate the variance of predicted values, that is, predictions of the response variable for sets of independent variables. This inflation may be especially severe when the values of the independent variables are not in the example. In addition, the OLS estimates of the individual regression coefficients tend to be unstable and can affect both inference and model equation (6) and (7) forecasting. The estimated values of the coefficients will also be very sensitive to changes in the sample data and to the addition/deletion of a variable in the equation[15]. To avoid this problem, we used an alternative method of estimation, principal components regression (PCR), which results in estimation and prediction better than OLS. This alternative has the potential to produce more precision in the estimated coefficients and smaller prediction errors when the predictions are generated using data other than those used for estimation[16].Using PCR methodology, the variables in model equation (6) and (7) were transformed into new orthogonal or uncorrelated variables called principal components (PCs) of the correlation matrices. The first part of Table 3 shows the eigenvalues of the correlation matrix for Local Aman rice. From the “Eigenvalue” column it is clear that the first principal component has a very large variance (5.26), the second has much smaller variances (2.62), and the others have negligible variances. The “Difference” column gives the adjacent eigenvalues. This statistic shows the rate of decrease in variances of the PCs. The proportion of total variation accounted for by each of the components is obtained by dividing each of the eigenvalues by the total variation. These quantities are given in the “Proportion” column. It is obvious that the first component accounts for 65% of the total variation, a result that is typical when a single factor, the original variables are highly correlated. The cumulative proportions printed in the “Cumulative” column indicate that 99% of the total variation in the eight variables is explained by four components.The second part of Table 3 (‘Eigenvectors’) shows the eigenvectors for each of the PCs. These coefficients, which relate the components to the original variables listed on the first column, are scaled so that their sum of squares is unity. This allows for finding which of the original variables dominate a component. The coefficients of the first PC is dominated by VCI40 (0.356) and VCI41 (0.362). As expected, these components have the highest correlation coefficient with dY (Figure 2) and are in the beginning of the critical period of LAR. The second component show a positive relationship with all variables, with somewhat larger contributions from TCI42 (0.369) and TCI41 (0.360). The final yield component, kernel weight, is determined during maturation that for LAR occurs in these weeks. It can be pointed out that just because the first four PCs explain 99% of the variation it does not mean that they form the best subset of predictors for dY[17].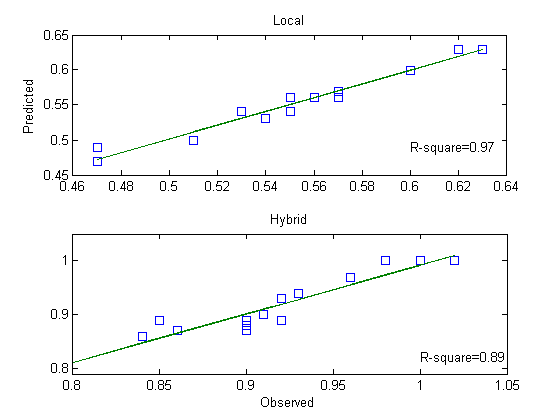 | Figure 3. Plot of predicted (dY) against observed (dY) for LAR and HAR |
The stepwise multiple regressions were involves eliminating some of the PCs to get a reduction in variance. Once the regression coefficients for the reduced set of orthogonal variables were calculated, they were mathematically transformed into a new set of coefficients that correspond to the original or initial correlated set of variables in model equation (6) and (7). These new coefficients are principal component estimators[18]. The selected principal components for both type of Aman rice are shown in Table 4.Hence, following PCR analysis the final set of coefficients for variables in model equation (6) and (7) are calculated and presented in Table 5.| Table 2. Product moment correlations among VH (Vegetation Health) of neighbouring weeks for hybrid Aman rice |
| | Correlation Matrix | | | TCI40 | TCI41 | TCI42 | TCI43 | VCI40 | VCI41 | VCI42 | VCI43 | | TCI40 | 1 | 0.9939 | 0.9734 | 0.9562 | -0.3675 | -0.3788 | -0.3433 | -0.3056 | | TCI41 | 0.9939 | 1 | 0.9904 | 0.9687 | -0.3336 | -0.3519 | -0.3221 | -0.2872 | | TCI42 | 0.9734 | 0.9904 | 1 | 0.9828 | -0.2984 | -0.3288 | -0.3081 | -0.2811 | | TCI43 | 0.9562 | 0.9687 | 0.9828 | 1 | -0.3224 | -0.3598 | -0.3499 | -0.3311 | | VCI40 | -0.3675 | -0.3336 | -0.2984 | -0.3224 | 1 | 0.9945 | 0.9787 | 0.9563 | | VCI41 | -0.3788 | -0.3519 | -0.3288 | -0.3598 | 0.9945 | 1 | 0.9932 | 0.9783 | | VCI42 | -0.3433 | -0.3221 | -0.3081 | -0.3499 | 0.9787 | 0.9932 | 1 | 0.9944 | | VCI43 | -0.3056 | -0.2872 | -0.2811 | -0.3311 | 0.9563 | 0.9783 | 0.9944 | 1 |
|
|
| Table 3. Principal component results for local Aman rice |
| | Eigenvalues | | | Eigenvalue | Difference | Proportion | Cumulative | | 1 | 5.25869913 | 2.63377365 | 0.6573 | 0.6573 | | 2 | 2.62492548 | 2.53400572 | 0.3281 | 0.9855 | | 3 | 0.09091976 | 0.07731891 | 0.0114 | 0.9968 | | 4 | 0.01360085 | 0.00391939 | 0.0017 | 0.9985 | | 5 | 0.00968147 | 0.00829069 | 0.0012 | 0.9997 | | 6 | 0.00139078 | 0.0008797 | 0.0002 | 0.9999 | | 7 | 0.00051108 | 0.00023964 | 0.0001 | 1 | | 8 | 0.00027144 | | 0 | 1 | | Eigenvectors | | | Prin1 | Prin2 | Prin3 | Prin4 | | TCI40 | –0.357213 | 0.342744 | –0.426009 | 0.374731 | | TCI41 | –0.352384 | 0.360244 | –0.222066 | –0.261375 | | TCI42 | –0.346619 | 0.369875 | 0.158997 | –0.664 | | TCI43 | –0.353889 | 0.34467 | 0.510155 | 0.571672 | | VCI40 | 0.35364 | 0.349249 | 0.476155 | –0.121513 | | VCI41 | 0.362596 | 0.341033 | 0.153944 | 0.045948 | | VCI42 | 0.356139 | 0.35418 | –0.179903 | 0.065504 | | VCI43 | 0.345645 | 0.365273 | –0.448193 | 0.048865 | | Eigenvectors | | | Prin5 | Prin6 | Prin7 | Prin8 | | TCI40 | 0.458831 | 0.27487 | –0.376111 | 0.074026 | | TCI41 | 0.207418 | –0.52842 | 0.460576 | –0.306665 | | TCI42 | –0.249811 | 0.3247 | –0.189642 | 0.270319 | | TCI43 | –0.388163 | –0.06756 | 0.115539 | –0.017725 | | VCI40 | 0.354135 | –0.01426 | –0.356517 | –0.50868 | | VCI41 | 0.30055 | –0.27659 | 0.1467 | 0.733525 | | VCI42 | –0.079538 | 0.600747 | 0.563922 | –0.160729 | | VCI43 | –0.55795 | –0.31245 | –0.361198 | –0.06665 |
|
|
| Table 4. Selection of principal components for prediction based on stepwise regression |
| | Type | VarsInModel | R2 | Adj R2 | F Value | RMSE | | Local | Prin1 Prin2 Prin3 Prin7 | 0.97 | 0.96 | 76.72 | 2.07 | | Hybrid | Prin2 Prin7 | 0.92 | 0.90 | 64.70 | 1.93 |
|
|
| Table 5. Estimated regression coefficients from stepwise regression selection |
| | | Intercept | TCI40 | TCI41 | TCI42 | TCI43 | VCI40 | VCI41 | VCI42 | VCI43 | | Local | 137.15 | –3.81 | 3.51 | –1.45 | 1.01 | –2.25 | 0.93 | 3.44 | –2.58 | | Hybrid | 126.68 | –1.87 | 1.84 | –0.82 | 0.36 | –1.29 | 0.43 | 1.80 | –1.25 |
|
|
| Table 6. Statistics of an independent test for local and hybrid aman rice |
| | | CC between | R2 between | | Non | | | Type | Predicted | Predicted | Bias | Systematic | RMSE | | | and Observed | and Observed | | error | | | Local | 0.98 | 0.97 | 0.667e–3 | 0.028 | 0.009 | | Hybrid | 0.94 | 0.89 | 0.666 e–3 | 0.033 | 0.019 |
|
|
6. Validation of the Predicted Models
Validation is the step in which the prediction with the chosen model is tested independently. Since the training data is short, the Leave-One-Out Cross-Validation technique was used as a validation tool. The model selected in the optimization step (Table 5) was applied to the validation data set. Figure 3 shows a scatter plot of observed versus predicted LAR and HAR yield. Residual values in individual years are within acceptable limits (averaged 4 % for LAR and 3% for HAR). Table 6 shows that over all correlation coefficients (0.98 for LAR and 0.94 for HAR) are good. R2 value of 0.97 for LAR and 0.89 for HAR show that in most years dY can be modelled by variables considered in model equation (6) and (7) respectively. Table 6 shows the statistics of fit of predicted versus observed LAR and HAR yield. According to Willmott [19] in “good” models systematic error should approach zero while non-systematic error should approach root mean square error (RMSE).Therefore, we can conclude from Table 6 that models based on equation (6) and (7) with the coefficients estimated using PCR methodology detailed in Table 5 performs very well.
7. Conclusions
Aman rice is the one of most important rice varieties in Bangladesh. The two AVHRR-based VH indices characterizing moisture (VCI) and thermal (TCI) conditions were tested as predictors of local and hybrid Aman rice yield. Correlation analysis between LAR and HAR yield deviations from trend (dY) with VH during 1991–2005, showed strong correlation during the critical period of LAR and HAR growth. Therefore, these indices were used for statistical modelling Aman rice yield. This study shows that Aman rice yield can be estimated from VH indices at approximately four to eight weeks prior to harvest time. This information will improve harvest, storage, marketing and transportation. These results are complementary to crop modelling in other countries. Further investigation might include combining satellite sensor data with flood and river discharge data specifically during monsoon period. The vegetation health indices data are delivered in real time to smcd/emcb/vci. They show global and regional vegetation health, moisture and thermal conditions, and fire risk potential. They also demonstrate climate issues and utility of vegetation health indices in global observing systems.
References
| [1] | Abdus, S., Lindsay, G., Ross, M., Malcolm, B. “A comparison of development opportunities for crab and shrimp aquaculture in southwestern Bangladesh, using GIS modeling” Aquaculture 2003, 220, 477–494 |
| [2] | Salam, M.A. “Application of remote sensing and geographic information system (GIS) Techniques for monitoring boro rice area extension in Bangladesh”, In Proceedings of International Seminar on Satellite Technology Applications in Communications and Remote Sensing, Tehran, Islamic Republic of Iran, 9–15 October 2004 |
| [3] | Rahman, A.; Roytman, L.; Krakauer, N. Y.; Nizamuddin, M.; Goldberg, M. “Use of Vegetation Health Data for Estimation of Aus Rice Yield in Bangladesh”. Sensors 2009, 9, 2968–2975 |
| [4] | Bangladesh Bureau of Statistics. Bangladesh Bureau of Statistics, Yearbook of Agricultural Statistics of Bangladesh. Government of the People’s Republic of Bangladesh 2006 |
| [5] | Kogan, F.; Bangjie, Y.; Guo, W.; Pei, Z.; Jiao, X. “Modeling corn production in China using AVHRR–based vegetation health indices” Int. J. Remote Sens. 2005, 26, 2325–2336 |
| [6] | Kogan, F. “World droughts in the new millennium from AVHRR–based Vegetation Health Indices” Eos. Trans. AGU. 2002 |
| [7] | Kogan, F. “Global drought watch from space. Bull”. Am. Meteorol. Soc. 1997, 78, 621–636 |
| [8] | Rahman, A.; Kogan, F.; Roytman, L. “Analysis of malaria cases in Bangladesh with remote sensing data”. Am. J. Trop. Med. Hyg. 2006, 74, 17–19 |
| [9] | Anwar, A. “Climate change impacts and adaptation assessment in Bangladesh”. Clim. Res. 1999, 12, 109–116 |
| [10] | Kidwell, K.B. Global Vegetation Index User's Guide. U.S. Dept. of Commerce, National Oceanic and Atmospheric Administration, National Environmental Satellite Data and Information Service, National Climatic Data Center, Satellite Data Services Division: Camp Springs: MD, U.S.A. 1997 |
| [11] | Kogan, F.; Bangjie, Y.; Guo, W.; Pei, Z.; Jiao, X. “Modeling corn production in China using AVHRR–based vegetation health indices” Int. J. Remote Sens. 2005, 26, 2325–2336 |
| [12] | Brockwell, P.J.; Davis, R.A. Introduction to Time Series and Forecasting. Springer: New York, NY, U.S.A. 2000 |
| [13] | Jensen, J.R. Remote Sensing of the Environment: An earth resource perspective. Prentice Hall: Chandler, AZ, U.S.A. 2000 |
| [14] | Xiao, X.; Boles, S.; Frolking, S.; Li, C.; Babu, J.Y.; Salas, W.; Moore, B. “Mapping paddy rice agriculture in South and Southeast Asia using multi–temporal MODIS images” Remote Sens. Environ. 2006, 100, 95–113 |
| [15] | Chatterjee, S., Hadi, A., Price, B. Regression Analysis by Example. New York, Wiley 2000 |
| [16] | Draper, N., and Smith, H. Applied Regression Analysis, New York, Wiley, 1981 |
| [17] | Hadi, S., and Ling, R. “Some cautionary notes on the use of principal components Regression” American Statistician, 52: 15–19, 1998 |
| [18] | Salazar, L.; Kogan F.; Roytman L. “Using vegetation health indices and partial least squares method for estimation of corn yield” Int. J. Remote Sens. 2008, 29, 175–189 |
| [19] | Willmont, C. “Some comments on the Evaluation of Model Performance” Bulletin American Meteorological Society 1982, 63: 1309– 1313 |
 Abstract
 Reference
 Full-Text PDF
 Full-text HTML