-
Paper Information
- Next Paper
- Previous Paper
- Paper Submission
-
Journal Information
- About This Journal
- Editorial Board
- Current Issue
- Archive
- Author Guidelines
- Contact Us
International Journal of Agriculture and Forestry
p-ISSN: 2165-882X e-ISSN: 2165-8846
2012; 2(1): 79-83
doi:10.5923/j.ijaf.20120201.13
Path Coefficient and Selection Indices in Sixteen Guar (Cyamopsis Tetragonoloba L.) Genotypes Under Rain-fed
 Abstract
 Reference
 Full-Text PDF
 Full-text HTML
Elshiekh A. Ibrahim1, Abdel Wahab H. Abdalla2, Mohammed E. Abdel Rahman1, Ahmed M. El Naim1
1Department of Crop Sciences, Faculty of Natural Resources and Environmental Studies, University of Kordofan, Elobied, Sudan
2Department of Agronomy, Faculty of Agriculture, University of Khartoum, Khartoum, Shambat, Sudan
Correspondence to: Ahmed M. El Naim, Department of Crop Sciences, Faculty of Natural Resources and Environmental Studies, University of Kordofan, Elobied, Sudan.
| Email: |  |
Copyright © 2012 Scientific & Academic Publishing. All Rights Reserved.
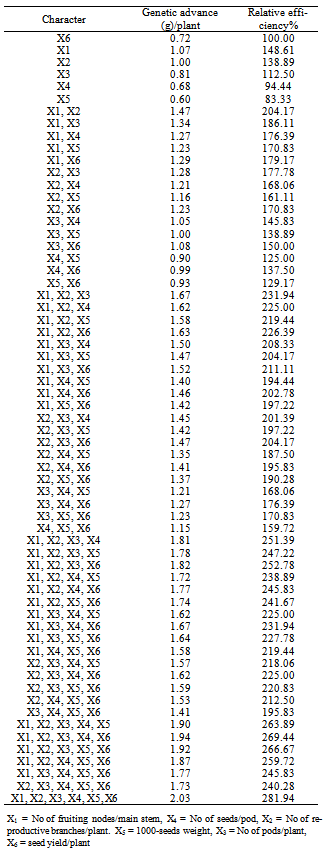
Set of sixteen guar genotypes was evaluated under rain-fed conditions at Kazgeil, Northren Kordofan State, Sudan in 1998/99 season, using a four x four triple partially balanced lattice design. Data recorded at were used for partitioning the genotypic correlations between seed yield and five of its components into direct and indirect effects. Moreover, different selection indices were constructed using different combinations of these characters. The path analysis showed that number of pods/plant had the highest positive direct effect (2.653) on seed yield/plant followed by number of seeds per pod. On the other hand number of fruiting nodes/main stem exerted the highest negative direct effect (-1.383) on seed yield/plant. The selection index involving single trait viz.1000 seed weight gave the minimum expected genetic advance (0.6) and relative efficiency (83.33%). However, the index involving all the six traits exhibited the highest expected genetic advance (2.03) and the maximum relative efficiency (281.94%).The two trait selection index of number of pods/plant and 1000-seed weight scored the relative efficiency of 138.89% which is equal to the relative efficiency of the individual trait index of number of reproductive branches/plant.
Keywords: Path Coefficient, Selection Indices, Genetic Advance, Guar
Cite this paper: Elshiekh A. Ibrahim, Abdel Wahab H. Abdalla, Mohammed E. Abdel Rahman, Ahmed M. El Naim, Path Coefficient and Selection Indices in Sixteen Guar (Cyamopsis Tetragonoloba L.) Genotypes Under Rain-fed, International Journal of Agriculture and Forestry, Vol. 2 No. 1, 2012, pp. 79-83. doi: 10.5923/j.ijaf.20120201.13.
1. Introduction
- Yield is a complex character and is known to be associated with a number of component characters and is highly affected by environmental variations. These characters are themselves interrelated. Such inter-dependence of the contributing factors affect their direct relationship with yield, thereby making correlation coefficients unreliable as selection indices (Shoran, 1982). Thus, specification of causes and measuring the relative importance of each of the yield components can be achieved by using the method of path analysis, as a mean of separating the direct effects from the indirect ones through other characters. Several path coefficient analysis have been conducted in guar, using grain-type cultivars (Tikka, 1975; Chaudhary and Singh, 1976; Bhard- waj et al., 1981; Sohoo and Bhardwaj, 1985; Henary et al., 1986; Stafford and Seiler, 1986).Breeding and selection programmes often encompass several characters simultaneously (Hill et al, 1998). When considering several traits, it is desirable to choose individuals with the best combination of these traits. The basis for such a selection is selection index, which takes, into account a combination of traits according to their relative weight. Thus each individual trait has an index value (score) and selection is based on the sum of the scores (values) of the different traits. Gain from selection for any given trait is expected to decrease as additional traits are included in the index, so the choice for traits to be include must be done objectively (Hallauer and Miranda, 1982). In guar, selection indices have been effectively used in identifying some traits as selection criteria to improve seed yield. Choudhary and Joshi (1996); Elsyed (1999), concluded that maximum efficiency of selection was obtained when all the important yield components were included in the index.To provide basis for selection and yield improvement in guar, this study investigated the interrelationship between yield and its components, determined the relative contribution of the different yield components to the final yield and estimated the expected genetic advances and relative efficiencies.
2. Materials and Methods
- Sixteen genotypes of guar (Cyamopsis tetragonoloba L.), fourteen inbred lines and two commercial varieties HFG53 and HFG408, were evaluated during 1998 crop season under rain-fed conditions at Kazgeil, North Kordofan State, Sudan. Seeds of these genotypes were offered by Dr.Abdel Wahab Hassan Abdalla, Department of Agronomy, Faculty of Agriculture, University of Khartoum, Sudan.Ten plants from each plot were randomly selected from the middle ridges for collecting data on number of fruiting nodes/main stem, number reproductive branches/plant, number pods/plant, number seed/pod, 1000 seed weight (g) and seed yield/plant (g).The collected data were subjected to analysis of variance according to the method described by Gomez and Gomez (1984), and covariance according to Singh and Chaudhary (1979). Then the genotypic and phenotypic correlation coefficients were determined for all possible pairwise combinations between the characters, according to Miller et al. (1958).Path coefficient analysis was calculated, following the procedure suggested by Dewey and Lu (1959). It was used for partitioning the genotypic correlation between seed yield and five of its components into direct and indirect effects. The characters included in the model were:Number of fruiting nodes/main stemNumber of reproductive branches/plantNumber of pods/plantNumber of seed/pod1000 seed weight (g)seed yield/plant (g)The path coefficients of the five traits were obtained by simultaneous solution of the following equations:
 are the genotypic correlation coefficients of the five characters involved in the model with seed yield per plant (6).
 and r45 are genotypic correlation coefficients of the possible pair wise combinations of the five characters.
  are the path coefficients (direct effects) of the five traits on seed yield/plant (6).The residual effect was determined, following Singh and Chaudhary (1979), by substituting the estimated path coefficients and the genotypic correlations in the following equations.Where:Px: is the path coefficient of (x) variables, not included in the model, on seed yield per plant (6).Different selection indices were formed using the six characters, and seed yield/plant was used as the ultimately desired product. Different phenotypic weights (b’s) were assigned to the six parameter. These weights were computed according to the method suggested by Robinson et al. (1951), in which a set of simultaneous equations, constructed from the genotypic and phenotypic variances and covariance’s of the characters involved, was solved, as follows.Where:P: is the phenotypic variance or covariance.g: is the genotypic variance or covariance.P11: is an estimate of the phenotypic variance of character x1.P12: is an estimate of phenotypic covariance between characters x1 and x2.g1y: is an estimate of the genotypic covariance between characters x1 and xy. (yield = dependent character).b: is the selection weight.b1: is the selection weight for the character x1.b2 : is the selection weight for the character x2.The standard formula for selection index is:A number of selection indices were constructed. They are composed of indices that are based on single character and those based on the possible combinations of the characters.The expected genetic advance of these indices was determined according to the formula suggested by Robinson et al. (1951)Where:k: is the selection differential in standard units, its value is 2.06 when selection intensity is 5%.b: is the selection weight.g: is the genotypic variance or covariance.The estimates of genetic advance from selection were in grams of seed yield per plant. Then they were expressed as percentage of the genetic progress obtained from seed yield per plant alone, which was assumed to be 100%, and it was used to compare the relative efficiencies of the different selection indices.
3. Results and Discussion
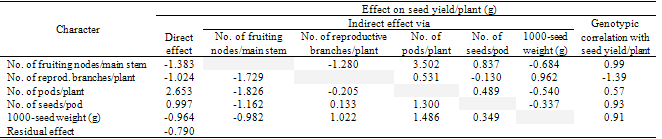
- The results of the path analysis are given in Table 1 and Figure 1. The number of pods/plant exerted the highest positive direct effect (2.653) on seed yield/plant. It was followed by the number of seeds/pod (0.997). This result reflects the importance of these characters as yield components. Similar findings were reached by Stafford and Seiler (1986). Furthermore, the highest direct effect of number of pods/plant was accompanied with maximum positive indirect effects of all other characters, via number of pods/plant, indicating that the number of pods/plant is the most important component trait of yield in guar.Although number of pods/plant exerted the highest positive direct effect, it had negative indirect effects on seed yield via number of fruiting nodes/main stem (-1.826), number of reproductive branches /plant (-0.205) and 1000 seed weight (-0.54). Its positive direct effect (2.653) in addition to its positive indirect one, through number of seeds/pod (0.489), exceeded its negative indirect effects and this was reflected in its significant positive genotypic correlation (0.57) with seed yield/plant.
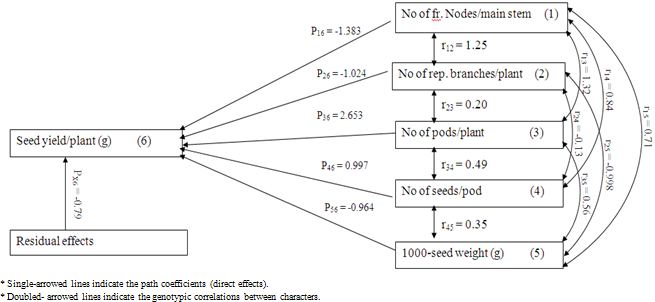 | Figure 1. Diagram of the direct and indirect relationships of seed yield/plant with its components at the genotypic level, using path coefficient analysis at Kazgeil, Northern Kordofan, State, Sudan, in 1998/99 season |
|
4. Conclusions
- It could be concluded from this study that number of pods/plant and number of seeds/pod were the most important yield components, as pointed out by path analysis and selection index. These components were positively associated with each other and with yield, suggesting that simultaneous improvement in these characters might be easy.
References
| [1] | Abdelmula AA, Abdalla AH (1994). Path coefficient analysis in Faba bean (Vicia faba L.). University of Khartoum Jouranl of Agricultural Sciences 2(1):46-58 |
| [2] | Bhardwaj RP, Mathur, ML, Mathur R (1981) Inter- relationship among yield and yield components in guar varieties of Cyamopsis tetragonoloba (L.)Taub. Madras Agric. J. 68(9): 594- 598 |
| [3] | Chaudhary BO, Singh VP (1976). Studies on variability, correlations and path analysis in guar. Forage Research. 2(2): 97-103. [Cited by Plant Breeding Abstracts (1978).48 (87710]. |
| [4] | Choudhary BR, Joshi P (1996). Selection indices in cluster bean (Cyamopsis tetragonoloba (L.)Taub). Indian J. Genet., 56 (3):278-280. |
| [5] | Dewey DR, Lu KH (1959). A correlation and path coefficient analysis of components of crested wheatgrass seed production. Agron. J. 51(9): 515-518. |
| [6] | Elsyed SM (1999). Evaluation of some guar (Cyamopsis tetragonoloba) genotypes for yield and yield components. M. Sc. Thesis, Faculty of Agriculture, University of Khartoum, Sudan. |
| [7] | Fadlalla HA (1994). Evaluation of wheat (Triticum aestivum L.) genotypes for yield and yield components. M. Sc. Thesis, Faculty of Agriculture, University of Khartoum, Sudan. |
| [8] | Gasim SM, Khidir MO (1998b). Correlation and path coefficient analysis of some characters in rosselle (Hibiscus sabdariffa var sabdariffa). U. of K. J. Agric. Sci. 6(1): 35-49. |
| [9] | Gomez KH, Gomez AA (1984). Statistical Procedures for Agricultural Research. 2nd ed., John Wiley and Sons Inc. New York. |
| [10] | Hallauer AR, Miranda JB (1982). Quantitative Genetics in Maize Breeding. Pages 46, 195, 200 and 201. Iowa State University Press. Ames. Iowa, U. S. A. |
| [11] | Henary A, Daulay HS, Krishna GV (1986). Correlation, path coefficient analysis and genetic diversity in cluster bean. Madras Agricultural Journal. 73(1): 11- 16. [Cited by Plant Breeding Abstracts (1988).58 (1), 5166]. |
| [12] | Hill J, Becker HC, Tigerstedt PM (1998). Quantitative and Ecological, Aspects of Plant Breeding, Ist.Ed., chapman and Hall, London. |
| [13] | Ibrahim EB. (2001). Evaluation of some rosselle (Hibiscus sabdariffa var sabdariffa) genotypes for yield and its components. M. Sc. Thesis, Faculty of Agriculture, University of Khartoum, Sudan. |
| [14] | Ismail MA (2000). Evaluation of some peanuts (Arachis hypogaea L.) genotypes for yield and its components. M. Sc. Thesis, Faculty of Agriculture, University of Khartoum, Sudan. |
| [15] | Miller PA, Williams JC, Robinson HP, Comstock RE (1958). Estimation of genotypic and environmental variances and covariances in upland cotton and their implications in selection. Agron. J. 50: 126-131. |
| [16] | Mital SP, Thomas TA (1969). Correlations and selection indices in improvement of seed yield in guar. Indian Journal of Genetics and Plant Breeding 29(1): 10- 17. |
| [17] | Phadnis BA, Ekbote AP, Ainchwar SS (1970). Path coefficient analysis in gram (Cicer arietinum L.) Indian J. Agric. Sci. 40 (11): 1013-1016. |
| [18] | Robinson HF, Comstock RE, Harvey PH (1951). Genotypic and phenotypic correlations in corn and their implications in selection. Agron. J. 43(6):282-287. |
| [19] | Salih SH, Khidir MO (1975). Correlation path coefficient analysis and selection indices for castor bean (Ricinus communis L.) Expl. Agric. 11(2):145-154. |
| [20] | Sengupta K, Kataria AS (1971). Path coefficient analysis for some characters in soybean. Indian Journal of Genetics and Plant Breeding . 31 (2): 290-295. |
| [21] | Shoran J (1982). Path analysis in pigeonpea. Indian J. Genet., 42:319-321. |
| [22] | Singh KB, Malhotra RS (1970). Interrelationships between yield and yield components in ungbean. Indian Journal of Genetics and Plant Breeding. 30 (1): 244-250. |
| [23] | Singh KB, Mehndiratta PD (1970). Path analysis and selection indices in cowpea (Vigna sinensis L.). Indian Journal of Genetics and Plant Breeding, 30(2):471-475. |
| [24] | Singh RK, Chaudhary BD. (1979). Biometerical Methods in Quantitative Genetic Analysis, 2nd ed., Kalyani publishers, New Delhi. |
| [25] | Sohoo MS, Bhardwaj BL (1985). Path coefficient analysis of seed yield in clusterbean. Crop Improvement. 12 (1):85-86. [Cited by Plant Breeding Abstracts (1986) 56 (6), 4934]. |
| [26] | Stafford RE, Seiler GJ (1986). Path coefficient analysis of yield components in guar. Field Crop Research. 14 (2):171-179. |
| [27] | Stansfield WD (1988). Schaum’s Outline Series of Theory and Problem of Genetics. Pages 218 and 221. 2nd ed. MC Graw Hill Book Company, Singapore. |
| [28] | Tikka SB (1975). Interrelationships between yield and components in clusterbean. Indian J. Genet. Plant Breed., 35:340-343. (Cited by Field Crops Research 14 (1986) 171- 179) |