Fred Nimoh 1, Enoch Kwame Tham-Agyekum 2, Philip Kwaku Nyarko 1
1Department of Agricultural Economics, Agribusiness and Extension, KNUST, Kumasi
2Department of Agricultural Extension, University of Ghana, Legon, Accra
Correspondence to: Enoch Kwame Tham-Agyekum , Department of Agricultural Extension, University of Ghana, Legon, Accra.
| Email: |  |
Copyright © 2012 Scientific & Academic Publishing. All Rights Reserved.
Abstract
This study was conducted to determine the efficiency of resource use in rice production with the Kpong Irrigation Project (KIP) as a case study. Seventy farmers were selected using the simple random sampling technique. The Cobb-Douglass production function was used to estimate the coefficients of the various variables analysed and MPP, MVP and allocative efficiency index were also used to estimate the efficiency of resource use in the study area. The regression results showed that the farmers were in the second stage of production, which is, decreasing returns to scale (using the elasticities). The results of the efficiency computation indicated that land (6.63), fertilizer (1.76) and seed (10.84) were being underutilized and labour (0.000036) and chemicals were being highly over utilized in the study area. The study recommends that KIP should embark on repair works on the roads, provide appropriate machinery services and desilting the drains.
Keywords:
Cobb-Douglas Function, Efficiency, Kpong Irrigation Project, Resource Use, Rice
Cite this paper:
Fred Nimoh , Enoch Kwame Tham-Agyekum , Philip Kwaku Nyarko , "Resource Use Efficiency in Rice Production: the Case of Kpong Irrigation Project in the Dangme West District of Ghana", International Journal of Agriculture and Forestry, Vol. 2 No. 1, 2012, pp. 35-40. doi: 10.5923/j.ijaf.20120201.06.
1. Introduction
Rice production is carried out with certain inputs or resources which enhance its productivity. The extent to which this productivity can be affected by these inputs depends on how the inputs are used. For instance, when a piece of land is being cultivated, its productivity will depend on the resources that are applied to it, but more importantly on how these resources are used or applied. Efficient use of resources has to do with the amount to be applied to the land in terms of quantities and their prices. That is to say the inputs must be applied in the quantities that would give the most output and at the same time the costs involved in using them must also be as low as possible. Hence, when the best resource is used in their right quantities and at the minimum possible cost to produce a certain output then efficient use of resources is achieved.According to Yanggen et al., (1998), to increase rural incomes and meet growing food demands Sub-Saharan Africa (SSA) must improve agricultural productivity. SSA is the only developing region where per capita food production has been declining; the region now has the largest cereal deficits in the world. If there is no change in productivity, deficits will more than triple by 2020. Fertilizer is a powerful productivity-enhancing input, but Sub-Saharan Africa uses very little. This is not to say that it is only fertilizer that is being underutilized but also other inputs like fungicides, pesticides, tractor services and labour. Some farmers even go to the extent of eliminating some of these inputs altogether. In recent years (2001–2005), rice production in Ghana has been expanding at the rate of 6% per annum, with 70% of the production increase due mainly to land expansion and only 30% being attributed to an increase in productivity (Sankhayan, 1983). This is to say that when the current area under cultivation is maintained and efforts towards increasing productivity are made then there can be a drastic increase in production. It is widely recognized that the improvement of agricultural productivity is critical for poverty alleviation and economic growth in sub-Saharan Africa, where agriculture is the primary source of livelihood for about 65 percent of population (Sakurai et al., 2006). Ghana has a wide area of land that could be cultivated. Out of the total agricultural land of 13.6milion hectares about 2million is considered suitable for large scale rice production (MoFA, 1999). Also records have shown that the demand for rice has been increasing at an average of 3.6%, but output has been decreasing at an average rate of 1.71% (Asare, 2000). With an average yield ranging between 1.0 to 1.5 tons per hectare, which is low comparative to achievable yields ranging between 2.5 to 6.0 tons per hectare which recent researches have come out with (NARP). Due to this difference between the average yields and achievable yields, it has created the need for import of rice to fill the supply gap. Rice accounts for 42.3% of all cereal imports as well as 16.5% of all cereals grown in Ghana. The question therefore is, is it inefficient use of resources that results in low yields?
2. Research Questions
• How can output of rice be increased without necessarily increasing the land size?• What are the resources available for rice production in the study area? • Is rice production worthwhile in the study area? • What quantities of these resources are currently being used for rice production in the study area?• What is the average yield per hectare currently in the study area?• What costs are the farmers incurring in the rice production process currently in the study area?
3. Methodology
The Dangme West District is situated in the South Eastern part of Ghana. This study is limited to the Kpong Irrigation Project; therefore the population of the study was limited to only farmers under the Irrigation project. Currently under the Kpong irrigation Project, 2500 household heads have been assigned land for the cultivation of rice. These 2500 household heads form the population of this study. From the population, 70 rice farmers were randomly sampled for this study. Primary data was sought through administration of structured questionnaire. Also secondary data on the average paddy rice output over ten-years was collected from the KIP office.
4. Analytical Procedure
Gross margin analysis was employed to assess the profitability of rice production in the study area on an average basis. Gross margin (profit) according to Wood and Sangter (2002) is the excess of sales revenue over the cost of goods sold (variable cost). That is,GM = TR – TVCTVC = TOCI + LIWhere GM is the gross margin, TR is total revenue, TVC is total variable cost, TOCI is total operating capital input, and LI is labour input.In this study, three different production functions, namely; linear, semi-log, and double log (Cobb Douglas) were employed to evaluate the productivity of key production factors for rice production in the study area, and the one that gave the best fit was chosen. The double-log function (Cobb- Douglas) provided the best fit and was therefore chosen for the study (Olomla, 1991; Mbata et al., 1993). Using the ordinary least square (OLS) estimator, the production response function model was expressed implicitly as: | (1) |
Where Y = the quantity of paddy in kilograms, X1 = Land (farm size in hectares), X2 = Labour (man-days), X3 = quantity of fertilizer in kilograms, X4 = volume of chemicals in liters, X5 = quantity of seed in kilograms.The functional form of the double-log function was expressed as follows:  | (2) |
The marginal physical product (MPP) was given by: | (3) |
 | (4) |
Where y is the mean of output and x is the mean of factor inputs, and bo and bi are the constant and regression coefficients, respectively.Using the above specifications and the output and input prices, the marginal value products (MVPs) and allocative efficiency index (AEI) were computed as follows: | (5) |
 | (6) |
Where, Py and MFCi, are the unit prices of output and factor input respectively. The decision of whether a resource is used efficiently or not, thus allocative efficiency, is based on the value of AEIi. If AEIi is equal to one (AEIi = 1), then the factor input is efficiently utilized, hence the farmer is considered allocative efficient (Hopper, 1965). The factor input is over-utilized if AEIi is less than 1 (AEIi <1) and under-utilized if AEIi is greater than unity (AEIi > 1). The significance of each explanatory variable was determined using the t-test. The overall significance was determined by the F-ratio.| Table 1. Descriptive Statistics of Farm Inputs |
| | | Output | Seed | Fert. | Chem. | Labour | Land | | Mean | 4456.947 | 72.64286 | 666.2857 | 7.892857 | 2134.914 | 1.571429 | | Median | 500.000 | 75.00000 | 575.0000 | 7.000000 | 2115.500 | 1.500000 | | Maximum | 000.000 | 120.0000 | 1200.000 | 14.00000 | 6844.000 | 3.000000 | | Minimum | 500.000 | 45.00000 | 300.0000 | 4.000000 | 1026.000 | 1.000000 | | Std. Dev. | 116.953 | 23.80052 | 232.8162 | 2.998663 | 826.5010 | 0.627196 | | Skewness | .204169 | 0.422462 | 0.339450 | 0.343709 | 2.695422 | 0.615800 | | Kurtosis | .311222 | 1.833740 | 1.999792 | 1.814657 | 16.25507 | 2.429363 | | Jarque-Bera | .870036 | 6.049342 | 4.262191 | 5.476283 | 597.2113 | 5.373859 | | Probability | .392579 | 0.048574 | 0.118707 | 0.064690 | 0.000000 | 0.068090 | | Observations | 70 | 70 | 70 | 70 | 70 | 70 | | Source: Computed from field survey data |
|
|
5. Results and Discussions
Major Inputs Used in Rice ProductionThe major inputs used in the production of rice in the study area identified as land, water, labour, fertilizer, chemicals and seed.LandLand happens to be one of the main inputs used in the study area for rice production. KIP supplied land to all the farmers registered under the project as farmers. Each farmer is allocated one hectare of land which he/she is supposed to put under cultivation. Some farmers in the study area use more than one hectare of land. The farmers are able to acquire more land not because KIP provided them more than one hectare, but through a process called subletting where farmers who for one reason or the other cannot cultivate theirs and thereby giving to those farmers who actually want more land to cultivate. From the results of the descriptive statistics, the minimum land size is one hectare and the maximum is three hectares with the mean being 1.57 ha. This means that on the average people cultivate more than one hectare. Nevertheless some farmers use as high as 7 ha of land and they can be termed as outliers.WaterWater is very essential to rice production in the study area. KIP, as the name suggests is an irrigation project that is into supplying water for all year round rice production. Without this resource, the project would have not been in existence or without water there would be no need for the irrigation project. With this water, the farmers are able to produce without worrying about water or rain. Since the farmers are supplied with water on the basis of the amount of land they have, water is captured in land for the analysis of efficiency of the resource. Another reason why water was captured as part of land was that, what the farmers paid per season is based on the water they use. That is, if the farmer has the land and does not cultivate it, he does not pay anything for it. Hence it implies that what is paid for the use of land is based on water. LabourLabour as an input is very important; it cannot be entirely eliminated from any production process. Even in the most heavily mechanized systems of production, labour cannot be entirely substituted for by machinery. At people are still employed to operate the machines. Labour is employed to make sure that all other inputs are applied. That is, labour in fact makes it possible that all activities that need to be performed in the production of the rice are performed. The results of the survey showed that the maximum labour was 6844 man-days with 1026 man-days being the minimum and the mean labour in the study area was 2135 man-days.FertilizerFertilizer as a major input in rice production is not excluded from rice production in the study area. The land allocated to the farmers is the land they have to cultivate over and over again every year. The land has no rotational scheme with which to revitalize the land. In view of this, the only thing that enhances the productivity of the land is the use of fertilizers. Fertilizers as used here refer to inorganic fertilizers. It was observed that the mean amount of fertilizer used in the study area was 666kg with maximum and minimum being 1200kg and 300kg respectively.SeedsSeeds are the paddy rice used for the production of rice. Some farmers in the study area prepare their own seed, which is from the previous harvest whiles others buy those grown by the certified seed growers. KIP has identified some farmers who are good in the production of rice in the study area. These farmers are given guidance and direction by the agricultural extension agents. Their activities are also monitored to make sure that the seeds produced meet the required standards that every certified seed should have. On the average, farmers in the study area use 72.64kg of seed with the maximum and minimum being 120kg and 45 kg respectively.ChemicalsThe chemicals used by the farmers are weedicides and insecticides. The method of land preparation employed in the study area is mainly chemical weed control. Also with pest control, the farmers’ use chemicals like karate, dusban, cerox etc. In this study, the weedicides and the insecticides were put together for the sake of convenience and used for the analysis. The chemicals are very important in the production of rice and cannot be eliminated. Most of the farmers do not do the slush and burn anymore and they resort only to the chemical weed control. Farmers assigned the reason that the land is not normally weedy at the start of the season because the same land is cultivated for two seasons in a year.| Table 2. Average Gross Margin of rice production |
| | Item | Unit Price (GH¢) | Unit/ha | Value/ha (GH¢) | | Rice Output (RO) | 1.00 | 5500 | 5500 | | Capital Operating Inputs (C.O.I.) | | | | | Fertilizer | 1.02 | 424.40kg | 431.20 | | Seed | 1.08 | 46.30kg | 50.00 | | Chemicals | 8.50 | 5.03 l | 42.76 | | Machinery | 120.0 | 1 season | 120 | | Total COI cost | | | 763.96 | | Labour input | 2.50 | 2135 | 5337.50 | | Total variable cost (TVC) | | | 5294.46 | | Gross margin (RO-TVC) | | | 205.54 | | Source: Computed from field survey data |
|
|
| Table 3. Correlation Matrix of the Inputs |
| | | LNOUTPUT | LNLAND | LNLABOUR | LNFERT | LNCHEM | LNSEED | | LNOUTPUT | 1 | 0.7568 | 0.4250 | 0.7286 | 0.5069 | 0.7050 | | LNLAND | | 1 | 0.4745 | 0.9118 | 0.8257 | 0.9109 | | LNLABOUR | | | 1 | 0.4539 | 0.4967 | 0.3949 | | LNFERT | | | | 1 | 0.7684 | 0.8299 | | LNCHEM | | | | | 1 | 0.7701 | | LNSEED | | | | | | 1 | | Source: Computed from field survey data |
|
|
| Table 4. OLS Estimates of Coefficients |
| | Dependent Variable: LNOUTPUT | | Included observations: 70 | | Variable | Coefficient | Std. Error | t-Statistic | Prob. | | LNLAND | 0.441143*** | 0.172565 | 2.5564 | 0.0130 | | LNLABOUR | 0.112767* | 0.067196 | 1.6782 | 0.0982 | | LNFERT | 0.180388 | 0.130479 | 1.3825 | 0.1716 | | LNCHEM | -0.2922*** | 0.089904 | -3.2499 | 0.0018 | | LNSEED | 0.1361 | 0.144824 | 0.9415 | 0.3500 | | C | 6.1898 | 1.101333 | 5.6203 | 0.0000 | | R-squared | 0.6468 | Mean dependent var | 8.3701 | | Adjusted R-squared | 0.6192 | S.D. dependent var | 0.2591 | | Log likelihood | 32.1403 | F-statistic | 23.4363 | | Durbin-Watson stat | 2.1137 | Prob(F-statistic) | 0.0000 | | Source: Computed from field survey dataNote: *** and * represents significance at 1%and 10% respectively |
|
|
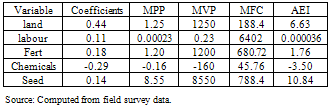
Average Gross Margin of Rice ProductionIt can be observed that rice production is profitable on an average gross margin basis by GH¢205.54. The production of rice in the study area can be very profitable if the inputs for rice production are combined efficiently. The cost item that drastically reduces the profit of rice production in the study area is the labour cost. If this cost is reduced, the profitability of rice production in the study area will be high.Correlation Matrix of the Inputs usedIt can be seen that land, fertilizer and seeds are highly correlated that is over 70%. Labour on the other hand has a low correlation with the output that is 43%. Also chemicals have a correlation of 51%. These correlations show how the value of output is dependent on the explanatory variables.Descriptive Statistics of Data Used to Analyse EfficiencyThe data used for this analysis as that collected on land (farm size), labour fertilizer, chemicals and seed. Natural log of these inputs were taken to analyze the data. The mean of the dependent variable, (output) is 8.37, the means of the independent variables are as follows; land – 0.38, labour – 7.61, fertilizer – 6.44, chemicals – 1.99, and seed – 4.23.Analysis of the Efficiency of the Resources Used in Rice ProductionThe Cobb-Douglass production function was employed to empirically analyse the cross-sectional data sampled from the rice farmers. The Cobb-Douglass production function estimates the elasticities of the various inputs used in rice production. The elasticities indicate the scale of production of the various inputs. If the elasticity is greater than one, it indicates an increasing return to scale, if less than one, it indicates a decreasing return to scale. However, if it is equal to one the function is said to exhibit a constant returns to scale. An increasing return to scale implies that when all other variables are held constant, a unit increase in one of them results in more than proportionate increase in output. On the other hand, a decreasing return to scale implies that a unit increase in one variable with the others held constant results in a less than proportionate increase in output. For a constant returns to scale, with all other inputs held constant a unit increase in one will result in a proportionate increase in output.From the regression analysis, the partial elasticities: β1 (0.441143), β2 (0.112767), β3 (0.180388), β4 (-0.292182) and β4 (0.136358) of the various variables indicated decreasing returns to scale, and the total elasticity (sum of the partial elasticities) also showed decreasing returns to scale. The result of the estimate showed that land and chemicals were significant at 1%, and labour was significant at 10%. This implies that these variables are the major contributors of the 61.92% (adjustedR2) variations in the dependent variable.Results of the ordinary least square (OLS) estimates of the parameters for the sampled farms showed that output (paddy rice) was positively related to land (farm size), labour, fertilizer and seed, but was negatively related to chemicals used. This implies that output increased with quantities of land (farm size), labour, chemical pesticide, and seed, but decreased with increased quantity of fertilizer [Place Table 5 here]. The allocative efficiency of land (6.63) shows that too little of land is being used by the farmers in the study area that is to say the cost of using land is small compared to the value marginal product. This suggests that the farmers can incur more cost in land so as to be efficient.Table 5. Coefficients, Marginal Physical Products (MPP), Marginal Product (MVP), Factor Cost (MFC), and Allocative Efficiency Index (AEI)
 |
| |
|
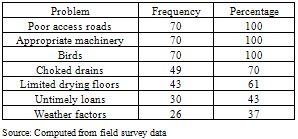
The efficiency of labour (0.000036) shows that the input labour is being over utilized in the study area, this means that more cost compared to the value of the marginal product of labour. Also, the efficiency of fertilizer (1.76) indicates that fertilizer is also being underutilized in the study area. The cost incurred in using fertilizer is small compared to the value of the marginal product of fertilizer.The efficiency of chemicals on the other hand gave a negative figure (-3.50), and this is an indication of the fact that the input chemical is being used to an extent that any increase in its use brings about a decrease in output. The input seed also gave an efficiency value of 10.84, indicating that the cost of using seed is very low compared to the value of the marginal product of seed hence there is room for increasing the use of seed. The analysis is performed for rice production. This analysis shows there is considerable room for improvement in the productivity of the production process in the study area. The results of this study suggest that, farmers could increase output and household income through better use of available resources. The achievement of efficiency in all the inputs and for that matter their totality will very much depend on increasing all the inputs that need to be increased, and reducing all those that need to be decreased.Problems Encountered By the FarmersThe access roads that link the fields to the main roads are in a deplorable state in the study area. This problem is worst during the rainy season. During the rainy season the roads get wet, potholes are formed, and they become immotorable. The bad state of the access roads makes it difficult for the farmers to cart the paddy form the fields to the main road so they have to employ casual labour to move these paddy from the farm to the roadside. This brings extra cost to them as they pay on per bag basis. All the farmers interviewed cited this particular problem. This means that it is a homogeneous problem in the study area. There was also unavailability of appropriate machinery. For instance there is no combine that can harvest when the land is wet. Through direct observation it was realized that farmers lose a lot of the paddy during harvesting when they use the manual harvesting. All the farmers interviewed (100%) cited this problem. After harvesting, the farmers dry the paddy to the moisture content suitable for storage. Where to do this drying is therefore the problem. About 61% of the farmers stated this problem. The drying floors available for the farmers to dry their paddy is very limited and in a season when many farmers go into production it is difficult to dry the paddy to its desired moisture content for storage. The effect of not drying the paddy right after harvest is that some people have their rice going mouldy and this means loss to them. The fields have drains that are supposed to take the waste waters away from the fields. Virtually these drains are non functional that is most of them are choked and this poses a lot of problems for the farmers. Some of these problems include flooding of the fields when they are to be drained, also farmer who have flooded fields have to pay extra for harvesting, some of the flooding continues even when the fields are not being cultivated and this makes it difficult for the owners of those lands to crop during the cropping season. Parts of the main drains have been choked and in fact some have never been desilted since the completion of the development of the project. 70% of the farmers interviewed are affected by this problem.Table 6. Problems Encountered By Rice Farmers in the Study Area
 |
| |
|
Also birds are a nuisance to the farmers in the study area. This problem is an issue to all the farmers in the interviewed. These birds normally are problems to those farmers who do not start the season early. The farmers who most often fall victims to these birds are those delayed by the Agricultural Development Bank (43%) of the farmers are victims of ADB’s delays (see appendix). The control for these birds is the scaring that the farmers do. The more the birds the more labour the farmer has to employ in order to curb the situation. This then in the long run increases the cost of the farmers. The birds have the capability of making the farmer leave the farm. That is they can make people so frustrated that all they have left to do is to neglect the farm. Weather factors also affect the yield of output. This problem was stated by 37% of the farmers (see appendix). Yields during the minor seasons are usually lower than that of the major season’s yields. During the minor seasons temperatures are usually higher than that of the major seasons also humidity is low hence the conditions are not the same for both seasons. Some farmers attribute the lower yields during the minor season to low rainfall during these periods meaning that rainfall also plays a part in the yield of rice even in an irrigated field [Place Table 6 here].
6. Conclusions and Recommendations
The cultivation of rice in the study area is profitable by GH¢205.54 on a gross margin basis. The regression results showed that the farmers were in the second stage of production; that is, decreasing returns to scale (using the elasticities). The results of the efficiency computation indicated that land (6.63), fertilizer (1.76) and seed (10.84) were being underutilized and labour (0.000036) and chemicals were being highly over utilized in the study area. KIP should provide adequate machinery services so as to reduce the labour input of the farmers. Also KIP should takes on the repair works on the access roads to enable the farmers to reduce to some extent their variable cost. The farmers can form farmer based organizations (FBOs) to provide some of these facilities for their own convenience, the farmers can also form cooperatives and acquire certain facilities like drying floors and combine harvesters, and also bargain for higher prices for the rice. Government subsidies can also help reduce the marginal factor cost and hence improve efficiency.
References
| [1] | Asare, I. K. (2000). Characteristics of Commercial Rice Production in Northern Ghana, A Comparative Analysis of Profitability of Indigenous And Improved Rice Varieties, Multi-Agency Partnerships For Technical Change In West African Agriculture |
| [2] | Mbata, J. N. & Matewa, J. C. (1983). “Resource Use Efficiency among Small-Scale Farmers in Selected Areas of Western Kenya", Trpenlandwirt, Germany, Vol. 94 (2) |
| [3] | MOFA. (1999). A Case Study on the Decline of the Rice Industry in the Northern Region and Way, Ministry of Food and Agriculture, Ghana |
| [4] | Olomla, A. (1991). Capture Fisheries and Aquaculture in Nigeria: A Comparative Economic Analysis, Issues in African Rural Development, Vol. 1, Winrock Institute for Agricultural Development |
| [5] | Oniah, M. O., Kuye, O. O., & Idiong, I. C. (2008). Efficiency of Resource Use in Small Scale Swamp Rice Production in Obubra Local Government Area of Cross River State, Nigeria, Middle-East Journal of Scientific Research (PP 145-148) IDOSI Publications |
| [6] | Sakurai, T., Furuya, J., and Futakuchi, K. (2006). Rice Miller Cluster in Ghana and Its Effects on Efficiency and Quality Improvement, pp 2 |
| [7] | Sankhayan, P. L. (1983). “Resource Productivity and Allocative Efficiency in Traditional Agriculture Study in Zambia", Journal of Research (India), Vol. 20 (2) |
| [8] | Wood, F., and Sangster, A. (2002). Business Accounting, 9th edition, Pearsons Education ltd, pp 66 |
| [9] | Yanggen, D., Kelly, V., Reardon, T., and Naseem, A. (1998). Incentives for Fertilizer Use in Sub-Saharan Africa: A Review of Empirical Evidence on Fertilizer Response and Profitability, MSU International Department of Agricultural Economics Development Department of Economics, Working Paper No. 70, Michigan State University |
 Abstract
 Reference
 Full-Text PDF
 Full-Text HTML