-
Paper Information
- Next Paper
- Paper Submission
-
Journal Information
- About This Journal
- Editorial Board
- Current Issue
- Archive
- Author Guidelines
- Contact Us
International Journal of Agriculture and Forestry
p-ISSN: 2165-882X e-ISSN: 2165-8846
2012; 2(1): 18-29
doi:10.5923/j.ijaf.20120201.04
Interplay of Agriculture Deterioration and Poverty Incident
 Abstract
 Reference
 Full-Text PDF
 Full-text HTML
Elgilany Ahmed, Jamalludin Sulaiman, Saidatulakmal Mohd
School of Social Sciences, University Sains Malaysia, Pulau, Penang, 11800, Malaysia
Correspondence to: Elgilany Ahmed, School of Social Sciences, University Sains Malaysia, Pulau, Penang, 11800, Malaysia.
| Email: |  |
Copyright © 2012 Scientific & Academic Publishing. All Rights Reserved.
In Sudan agriculture is considered to be the leading economic sector forming typically over 40% of the GDP has lost much ground with a drop of its GDP share to 33% in 2007. Northern Sudan as one of the most important agricultural region is characterized by low and erratic rainfall and limited arable land. Agriculture in this district provides an employment for about 70% of population. More dramatic is the deterioration in the contribution of agriculture to the country’s exports, declining to about 3% in 2007 down from an average of 74% in the period 1996–1998. Further, a large portion (83%) of Sudan’s rural people today lives in highly vulnerable livelihood and degraded environments. This situation affected agricultural productivity severely through greater frequency of yield-diminishing. This study aims to assess the crop productivity deterioration to the poverty incident in rural area. In tracing differences in agricultural yield and returns, detailed calculations from the collected data were made to estimate the per capita rural income from agricultural activities in northern Sudan. The results suggest that the potential impacts of low yield and yield volatility especially in the conventional farming system extremely causes poverty incident in northern Sudan.
Keywords: Agriculture Dwindling, Rural Poverty Incident, Crop Yields
Cite this paper: Elgilany Ahmed, Jamalludin Sulaiman, Saidatulakmal Mohd, Interplay of Agriculture Deterioration and Poverty Incident, International Journal of Agriculture and Forestry, Vol. 2 No. 1, 2012, pp. 18-29. doi: 10.5923/j.ijaf.20120201.04.
Article Outline
1. Introduction
- Sudan’s economic structure has undergone a major shift over the past two decades (DTIS, 2008), the main drivers being oil discovery at the turn of this Century and expansion in services. An overwhelming proportion of the nearly two-thirds of the Sudanese who live in rural areas depend on agriculture for their livelihood. About 70% of the labor force is principally employed in agricultural sector. It is evident that in the foreseeable future the welfare of Sudan’s population, especially of the poor who are largely located in rural areas, will to a substantial degree depend on the performance of the agricultural sector (UNDP, 2004). Agriculture has almost consistently been disadvantaged in public allocations to various economic sectors (Elbashier and Faki, 2006). Its allocations are both meager and dwindling: from 3.4% to 1.6% during 2000 to 2005 (by more than 50%). The actual share of agriculture in the total development expenditure varied from 8% to 44% over the period 2000 to 2005, but the trend is irregularly increasing. Higher shares were allotted to agriculture within actual expenditure on the overall national development programs ranging from 21% to 46%; yet also with irregular distribution among years (Faki et al, 2009). Agricultural production in Sudan is hampered by high production costs especially the irrigated one, excessive taxation particularly for livestock, high costs of provision of services, and charges that are not connected with the provision of any services. This paper aims to assess the interrelation between agricultural deterioration and poverty incident in rural area. Finally, economic activities in public and private sectors, development interventions and commodity movement have been quite restricted. Under such a situation agricultural constraints and poverty incident would obviously be expected to escalate. The main findings of this paper indicated strong relationship between the agricultural diminishing and poverty incidence in rural area. Accordingly, the research seeks to draw a road map of agricultural reforms, State policies and public investments in agriculture.
2. Methodology
- This study aimed to cover the main three agricultural production domains namely: traditional rain-fed, mechanized rain-fed and irrigated farms overall the country States. The study is based on a field survey data involved direct interviews using a structured questionnaire with detailed information on agricultural activities and poverty measurement-related variables. The data is subjected to analyses on crop yield, poverty line construction and welfare distribution. The income component analysis is carried out that allowed netting out the role of agriculture in poverty generation. Secondary data also used from their relevant sources. The collected rural agricultural information included: a delineation of the crop yields’ diminishing and poverty incident over the State’s agricultural sectors are regarded the main objective of this research, some household agricultural activities beside some other socioeconomic information. The research traced the human poverty index (HPI) assessment obtained recently (2009) by Agricultural Economics and Policy Research Centre (AEPRC) in Sudan. Using the mathematical property of the HPI a distributive device that achieves regional equity was also derived. Since agriculture is the main source of livelihood for the majority of the people in the Sudan, the poverty levels are largely shaped by the conditions of agriculture. In this respect the level of use of natural resources and the associated pressures on land have been illustrated within their space and time dimensions that has close relation to the spread of poverty. In tracing differences in the agricultural situation, detailed calculations from available data were made to estimate average per capita rural income from agriculture and derive poverty levels related to these incomes in each of the 15 northern sates based on data availability at the state level. Further, for highlighting possible interventions for improvement, crop yield and farm income are derived by the type of agricultural activity in different states. Moreover, the important association between the spatial distribution of agricultural incomes and land productivity of crops is manifested by the analysis of time-series crop yields in different states. Yield gap analysis between research and farmers’ yields is further conducted to illustrate the potential that exists to boost productivity levels. To verify the relationship between crop yield instability and poverty incident the research focused on a household budget survey that conducted in four selected states based on their poverty levels.
3. Results and Discussion
3.1. Prevalent Farming Systems in Sudan
- Sudan’s farming systems are commonly classified into three major categories, namely irrigated, mechanized rain- fed and traditional rain-fed systems. Currently, the potential of arable land under utilizing is about 24%. Only 18% of that is under intensive irrigated agriculture. The remainder including mechanized rain-fed and traditional rain-fed agriculture is under extensive patterns of land use, about 75% of the total natural pasture is utilized by nomadic and trans human animal production systems through an enabling policy frame work, use of modern technology for increased productivity and improved rural and public physical infrastructure. The present level of productivity per man or unit land is low in both crops and livestock (Ahmed, 2009). Livestock as a system is generally incorporated within the mentioned three cropping systems. Furthermore, livestock farming takes place on natural pasture with the vast majority of the pastoralists operating on dry lands. It thriving on the rich flood plains provides the fundamental basis for wealth, status and social linkages. The rich resource setup and seasonal variability allows people to utilize food availability in different seasons and areas, but this depends on ability of people to move, trade, and feed their livestock. Accordingly food problems exist only when such movement is hindered due to security problems. Yet agro-climatic conditions induce high variability the extent mentioned above from bumper harvests to crop failure. Historically, considerable conflicts between herding and crop agriculture is usually occurred due to of the encroachment of herding on cropland, but it is dominantly distributed within the conventional rain-fed agriculture in the form of pastoral grazing with over-riding transhumance mode of livestock keeping. However, many sub-systems exist within these major systems. Irrigated agriculture comprises three sub-categories namely, the Gravity irrigation, Pump irrigation and Basin (Flush) irrigation as well as some small basins. The irrigated farm size in Sudan is plotted in limited areas of approximately averaged 15 feddans to tenants who are effectively under fixed rental contract with the country State. While conventional agriculture is also diverse with large areas under clay soils across central and southern Sudan and others under sandy soils in the western parts. With a total arable land of about 84 million hectare, the average area under cropping during the period 2004–2006 amounted to close to 17 million ha representing some 20% of the total arable land. The farming system of the mechanized rain-fed sub-sector is described as the largest one, it can be range from one thousand feddan escalating to 50,000 and a million feddans are leased out to individuals. The distribution of crop cultivation over the three main farming systems (Figure 1) namely irrigated, mechanized rain-fed and traditional rain-fed systems are indicated wide prevalence of traditional agriculture (58%) and sizeable mechanized cropping (33%). Irrigated farming, although smaller in area, assumes high importance in total value of production and contribution to the country’s GDP relative to the other two sectors as shown in Figure (1). In general terms, the main crops grown in the irrigated sector are cotton, wheat, sorghum and groundnuts. The traditional rain-fed sector is dominated by sorghum in the central clay soils where sesame and sunflower in addition to limited amounts of cotton are produced. In the sandy soils of western Sudan the major crops are millet, sesame and groundnuts. On the other hand in areas of mechanized agriculture in eastern, central and western Sudan, sorghum and sesame are the major crops, but sunflower production gains increasing importance while cotton is also produced. Vegetables and fruits are found almost in all parts of the country, although they are of more importance in the northern part of the country, which is also the hub of production of cool-season food legumes such as faba bean, chickpea and lentil. Livestock production, which contributes about 20% to the total GDP, prevails all over the country under three main sub-systems. The most prevalent is transhumance animal keeping within an agro-pastoral system characterized by presence of arable farming and livestock migration in part of the season in search for feed and water. Sedentary livestock keeping is also widely spread and is more obvious under irrigated farming. The most intensive type of the sedentary type is the relatively modern dairy farming in urban and peri-urban locations in most parts of the country. Nomadic livestock keeping is also found in all parts of northern Sudan, but is decreasing in importance where nomads represented 3.4% of the total population in 1993 compared with about 14% in 1956 (Zarroug, 1996). In northern Sudan cropping activities are contributing significantly to the household food economy.
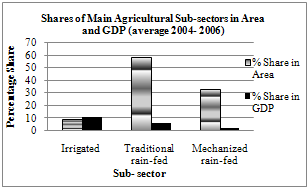 | Figure 1. Percentage Shares of main agriculture sub-sectors in area and GDP |
3.2. National Agricultural Policy
- Sudan’s agriculture contributed almost all the exports until the late 1990s. The emergence of oil has not just reduced their share of total exports, but has drastically reduced their absolute levels of exports. Obvious example for that are sesame and livestock exports. Their export after years of rapid growth began to fall drastically after 1999.
3.2.1. Scenario of Agricultural Exports Dwindling Against Oil Export
- The last decade (2000s) that the country’s conventional agricultural exports are witnessed clear decline against rise of oil exportation warning decision makers for emergent reform. Careful management of the exchange rate and compensatory incentives for agriculture must be designed to forestall that possibility. Even before the emergence of oil exports, Sudan’s production and export of cotton had been declining due to the official policy of encouraging self- sufficiency in food by transferring switching irrigated land from cotton as an essential cash crop to food crops by the centrally-enforced system of crop rotation. There is no evidence that this policy made any economic sense. Its implementation deprived large numbers of agricultural workers of their livelihood due to the large net reduction in labor use brought about by the shift of cultivated area from cotton to food crops. No doubt the deterioration in agricultural exports regarded as a major cause of poverty incident for a large number of conventional farm households. If the emergent institutional reform mentioned above is implemented in irrigated agriculture sub sector, the principal tool of this discrimination against cotton will be eliminated. It is however not clear if there are additional disincentives to cotton in the system of taxation, trade or input pricing. These discriminations, as indeed discrimination against agricultural products generally, especially those produced by, and/or employing, the poor, should be carefully identified and ended. The creation of monopoly in the export marketing of livestock products had an adverse effect on both productive efficiency and income distribution. Marketing Board control over export of Gum Arabic also amounts to a tax on its producers. These disincentives should be ended and replaced by the promotion of competition in marketing. Indeed, the promotion of competition in the marketing of agricultural produce and the distribution of agricultural inputs is a general principle that should be aggressively pursued.
3.2.2. Human poverty in Sudan
3.3. Agriculture and Poverty Incident
- Relating the performance of the agricultural sector to other important aspects like poverty rates one can obviously see that, despite high growth rates of the Sudanese economy during the past years, the level of poverty has dramatically increased. Poverty and agricultural development in Sudan estimated through the observations of rural factor markets (Pearson et al, 2003). The (water and land resources) agricultural development potential is manifest in the large mass of productive land not yet utilized and in the favorable land/ man ratio.
3.3.1. Agricultural Resources Use in Sudan
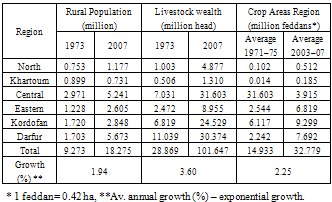
- The magnitude of the arable land, water and vast pastures forests qualified the Sudan for large scale crops and livestock production. UNEP (2007) reported that Sudan with its large land expanses extending over about 2.5 million km2 is bestowed with diverse natural resources. Agricultural activities, forming the main source of livelihood in the country, are basically geared by the magnitude of natural resources. This is particularly so on account of the low level of use of modern agricultural inputs. While soil types vary across the country, agro-ecological characteristics are largely shaped by climatic variation along its north-south axis. Rainfall is the single major component influencing natural resources and their use patterns. Rainfall increases along the north-south axis from almost null in the northern borders to over 1400 mm in south-western part of the country. Most of the administrative regions fall with rainfall zones characterized by the north south rainfall decrease. All their southern parts enjoy reasonable amounts of rainfall averaging approximately 700 mm. The variability of Sudan’s agro- ecological resources is reflected by Purnell and Venema (1976) identifying 16 mapped units with different agricultural potential based on the interplay of soils and climate that were further divided into 38 subclasses across the country. Rainfall is generally variable as reflected by annual variations of 45% in northern Sudan and 15% in its south and south-eastern parts (Eltom, 1996). In addition to rainfall, however variable as it is, Sudan’s water resources are augmented by flows from the Nile and its tributaries, annual flows from many seasonal rivers and streams, and by underground and deep water. Utilization of most of these waters is bound with high costs due to the diverse geography and variable nature of water flows among and within years. In spite of this, a considerable potential exists to develop water resources of the country to expand irrigated areas and employ water-harvesting techniques to improve agricultural productivity; a situation congruent with objective of poverty reduction. Enormous pressures have been exerted on those agricultural resources over time. Some 50 years back land was generally far in excess of demand and natural resources were capable of sustaining the livelihood of people even under problematic land use patterns. Hinging on the prevailing problematic land tenure system, such pressures have mounted since then and developments in human and livestock populations and arable cropping (Table 2), as well as deforestation have been largely behind degradation of the natural resource base. From Table (2) it is obvious that the three factors show a great increase. The high livestock growth rates are remarkable, substantially surpassing those of rural population and reflecting rising per capita livestock numbers in rural areas that can be calculated to grow annually by an average 1.66%. The per capita growth rates were variable among regions, being highest in Khartoum (3.3%) and North (3.2%). Relatively high growth rates are also derived for the Central Region and Kordofan (2.7% and 2.2%, respectively). Rates were relatively lower in the Eastern region (1.5%) and negative in Darfur due to migration influxes. Growth rates in terms of Tropical Livestock Units (TLU) have been slower in all regions (except the Central Region where they increased to 4.2%), indicating a shift towards small ruminants (Faki et al, 2009). Deforestation has been significant. The FAO data shows that total forests have been reduced by 8.247 million ha, or 11.6%, between 1990 and 2005. UNEP (2007) estimated the increase in deforestation at an annual rate of over 0.84% at the national level, while at the regional level, two-thirds of the forests in north, central and eastern Sudan disappeared between 1972 and 2001. In Darfur, one third of the forests cover was lost between 1973 and 2006.
|
3.4. Agricultural Income
- Using detailed calculations from available data, the attempt is made to estimate average per capita rural income from agriculture in each of the 15 northern sates based on data availability at the state level. The estimates have been inspired by similar income assessments in Syria (Szönyi et al., 2005 and Faki et al., 2009) that were based on gross income calculations.
3.4.1. Technique of Assessing Agricultural Income
- Income derivation here is based on gross returns from crops and livestock less intermediate inputs that mainly constitute machinery use, fuel and agricultural chemicals. The following procedures and assumptions have been adopted in the agricultural income calculations:Crop and livestock production data available from official statistics, mainly the Ministry of Agriculture and Forests (MAF), the Ministry of Animal Resources and Fisheries (MARF), and Ministries of Agriculture in some States), are compiled as disaggregated by State for North Sudan. The most recent prices are used; predominantly those prevailing in 2007 but prices of some products, especially horticultural crops and livestock have been subject to estimates based on the ruling general market prices.Computations are made for each crop or livestock product under each state where from the total returns per activity (production * price), costs of intermediate inputs are deducted to arrive at total income per activity per state. The ranges of crop products included in the assessment are as follows:^ Field crops: sorghum, millet and wheat.^ Oil crops: sesame, groundnuts and sunflower.^ Winter legume crops: faba bean, beans and chickpea ^ Fiber crops: cotton.^ Tree crops: gum Arabic.^ Vegetables and spices: onion, tomato, okra, eggplant, leafy vegetables, cucurbits, potato, sweet potato, and spices. Rosella ‘karkade’ is included in this group. ^ Fruits: mango, banana, grape fruit, oranges, lemon and dates.Total income is derived by state and, using the state-level rural population given by the Central Bureau of Statistics (CBS), average per capita incomes are derived for each of the crops and livestock categories as well as for all agricultural activities under consideration (see Table 3). According to the data of the Central Bureau of Statistics (CBS) the average national AgGDP for the period 2002–2006, excluding forestry and fisheries, can be computed to amount to SDG 23, 740 million. The estimated AgGDP in Table (3) of SDG15, 646 million represents about 66% of the CBS reported total.
| ||||||||||||||||||||||||||||||||||||||||||||||||||||||||||||||||||||||||||||||||||||||||||||||||||||||||||||||||||||||||||||||||||||||||||||||||||||||||||||||||||||||||||||||||||||||
3.4.2. Assessment of Per Capita Agricultural Income Levels
- Per capita agricultural output increased, though at a very slow rate. The headcount ratio of poverty during this period increased very little. World Bank (1992) mentioned that the growth rate of agriculture in Sudan between 1965 and 1980 to have been 2.9 per cent per year and in (1993) reported that the growth rate between 1970 and 1980 to have been 3.3 per cent per year. During the next period, between 1978 and 1986 agricultural GDP may have declined absolutely. During this period per capita agricultural output appears to have fallen rather sharply. This was the period of the most rapid increase in rural poverty. The agricultural activities performed by household members significantly reduce the likelihood of being in a higher poverty status.In contrast, the irrigated farms show that the variables that are positively correlated with the probability of being poor are the size of the household, the number of children in the household and working in a secondary occupation and being affected by diseases, while the variables that are negatively correlated with the probability of being poor are gender, the age of the household head, the education level of the household head and household members performing agricultural activities (Elzaki et al, 2010). The aggregate per capita income per day can be derived at USD 1.08 at an exchange rate of SDG 2.05 per USD. While acknowledging variation among states, the country is as a whole is close to the edge of poverty according to the average cost of the food basket computed as an equivalent $1.1(Faki et al, 2009). The estimated food poverty line in mechanized farms is equal to $0.17 per day per person, while those of irrigated and traditional farms are $0.14 and $0.34 per person per day, respectively. Similarly, the extreme poverty line of the traditional farms is $0.41 per person per day, whilst those of the mechanised and irrigated farms are $0.21 and $0.16 per person per day (Elzaki et al, 2010). The array of per capita income per day in USD for the 15 Northern States is presented in Figure (2). The range is from USD 2.56 (Blue Nile) to USD 0.61 (Red Sea). Seven states are shown by the Figure to fall below the poverty line as far as agricultural incomes are concerned. This is most likely the case since agriculture is known to provide the main livelihood source in rural Sudan. Over the period between 1986 and 1992, agricultural GDP appears to have increased modestly, at about 3 per cent per year. Per capita agricultural output increased at a moderate rate of perhaps one and a half per cent per year or more. It should however be noted that for the two years prior to 1991/92, agricultural performance was extremely bleak so that some of the output growth in 1992 must have gone to offset a part of the debts and obligations accumulated by the poor during those adverse years. Even so, the rate of increase in poverty moderated during this period. Together with the acceleration in migration to urban areas, this led to the lowest rate of increase in the absolute number of rural poor during this period (Khan, 2004). Average yields for (2006/2007) and at current prices. Although of this, presence of other income sources is highly possible such as small businesses and remittances. Figure (2) reflects the estimated average per capita agricultural income in USD at an exchange rate of SDG2.05/USD in rural areas of Sudan at On the other hand; the analysis does not allow any type of inter-state disaggregation to identify agricultural income poverty levels among various population groups who possibly undertake different agricultural activities. For instance, in almost all states that are endowed with irrigation facilities rain-fed agriculture is also practiced with varying degrees. Evidence shows that yields under the latter system are poor, but the farm size could matter as far as per capita income levels are concerned. It is to be noted that, while the low-income states include those that are usually reported to have high poverty levels, namely North Kordofan, Kassala, Red Sea and North and south Darfur, estimates also reveal income poverty in the rural areas of Gedarif and Gezira States, which have until now been considered to remain outside the poverty zone. In the Gezira State, this is likely to be a result of the enormous restructuring challenges that have been facing the Gezira Scheme in recent years, which is the major source of agricultural income in the State with a tremendous area of two million feddan. Gedarif, even with its known lead in producing sorghum and sesame, has been prone to low and deteriorating crop productivity and low prices of the crops produced. Income poverty in Gedarif might be higher than denoted by the figures if it is taken into consideration that the state is highly dominated by semi-mechanized crop production in the hands of big investors, with limited spill-over income effect to small rural households. It is also worth noting that Khartoum, which might be considered as a relatively favored state, its rural part is not far away from the fringes of poverty.
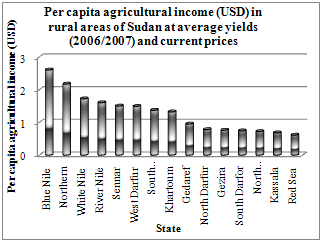 | Figure 2. Estimated average per capita agricultural income (USD)* in rural areas Sudan at average yields for (2006/07) and current prices |
| ||||||||||||||||||||||||
3.4.3. Interface of Income, Agriculture And Human Poverty
- The socioeconomic characteristics of rural poor households are expected to have great effects on the poverty incidences in the study areas. The educational attainment of the head of the household is found to be among the important factors associated with poverty (Elsheikh and Siwar, 2004; Chadha, 2002; Dasgupta, 1989). The majority of the poor rural household heads are illiterate. The estimated illiteracy in the irrigated farms (68.1%) and traditional farms (62.5%) are more than those in the mechanized farms (49.3%) (Elzaki, 2010). To bring the three indicators together, it becomes inevitable to go for computations per region as a common denominator. Table (5) gives the ranking of the six northern regions according to each indicator. The highest number of rural poor people is found in the traditional farms (91%), followed by the mechanized farms (85.4%) and the irrigated farms (66.7%). Poverty in rural Sudan over 2005–2006 had been more widely spread and deep in traditional and mechanized farms than in the irrigated farms.
|
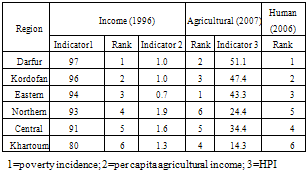
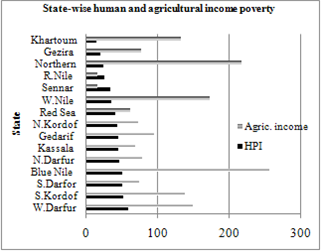 | Figure 3. State-wise human, agricultural income poverty and their ranking HPI Agric. State Level Rank Level Income Rank |
3.5. Crop Yield Volatility and Poverty Incident
- Agricultural resources productivity of crops especially land and water form an important factor influencing spatial distribution of incomes and poverty in various states. Further, it is clear that farm size and agricultural production costs are another two essential components to crop productivity to determine incomes and poverty levels. The contribution of various agricultural activities to agricultural incomes varied from state to another. The most dominant cash and food crops existed overall the country States are cereals, oil crops, cotton, gum Arabic, legumes, vegetables (including spices and rosella ‘karkade’), fruits (including dates) beside livestock. The share of horticultural crops is sizeable within this group, especially in Kassala State with respect to both vegetables and fruits) and in North Darfur with respect to vegetables where relatively high production of cucurbits, tomatoes and okra is reported. It can therefore be argued that horticultural crops and cool-season food legumes, in addition to a well-managed livestock production could form important options to raise incomes in these states. All these activities require a good market structure that enables efficient movement of products to consumption centers. Further, and except for Gezira, the low-income states are characterized by lower availability of the water resource compared with the high income states.The situation is implying the importance of providing higher investments in sourcing water for agriculture. Figure (4) shows assessment of yields volatility per unit area of the major crops in various states over two 5-year time periods: 1970/71–1974/75 and 2002/03–2006/07 listed according to the poverty ranks shown earlier.
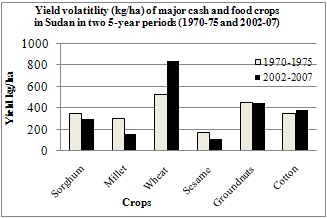 | Figure 4. Yield volatility (kg/ha) of major crops in Sudan over two 5-year periods: 1970/71–1974/75 and 2002/03–2006/07 |
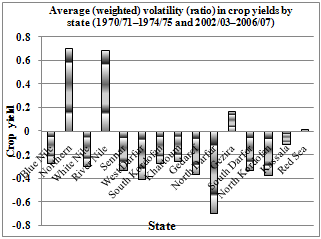 | Figure 5. Average (weighted) volatility (ratio) in crop yields by state (1970/71–1974/75 and 2002/03–2006/07) |
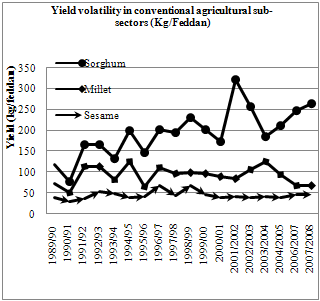 | Figure 6. Yield volatility in conventional agricultural sub-sectors (kg/fed) |
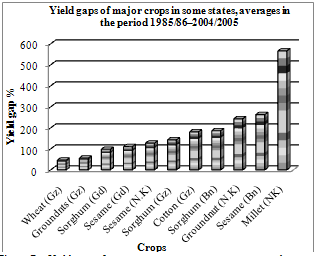 | Figure 7. Yield gaps of major crops in some states, averages in the period 1985/86–2004/2005 |
4. Conclusions
- Rising crop yield volatility could have important implications for poverty vulnerability. Crop yield volatility in Sudan could increase drastically in different agricultural sub- sectors especially the conventional one that dominated at the rural areas in comming future as poverty incident expected to become increasingly volatile as well. The paper unveiled that highly significant proportions of the rural population in the conventional farms are living below the poverty line suffering all forms of deprivations where poverty is sensitive to both food and cash crop.It also revealed that the incidence of poverty is differed considerably according to State. The diverse of poverty incidences may be due to inequalities distribution of economic growth and severe disparities in manipulation of deprivation (i.e. access to education, clean water, natural resources and public services).The research addresses generally this relation between them to derive the poverty responses and to assess its various indicators within the different periods under study and the agricultural contribution to the economic growth in the country including, assessment of the current human poverty in Sudan, the national agricultural policies and squeezed scenario of agricultural exports deterioration againist non-agricultural exports. The paper also deals with government expenditure on agriculture development. It delineates with the current situation of agricultural resources use, dominant farming systems and Interface of income, agricultural and human poverty incident considering crop yield volatility to enable the policy makers to determine how the distribution of poor households of agricultural sub-sectors and volatiles attributable to crop yields volatility during coming decades and how could change in the future and designing the relevant strategies and programs. However, to promote this situation to meet the future challenges, it is requisite for the country to plan for capacity building efforts to focus on designing a relevant research and enhancing the performance of the agricultural policy. In addition, tremendous efforts needed to assault poverty incident into economic development policies and strategies. Furthermore, it is necessary a greater accessibility to a comprehensive detailed food and cash crop yields volatility and poverty incident data especially among poor households of agricultural sub-sectors. The paper results also showed that introduction of advanced technology and input subsidies is become essential particularly in the conventional agricultural sub-sector, which is considered as one of the biggest agricultural sub-sector for agricultural development and hence in reducing poverty incidence in Sudan.
5. Recommendations
- Based on the study findings, important recommendation for future priorities in poverty alleviation have appeared and could be handled by the Federal Ministry of Agriculture and Forest and Ministry of Economic and Finance to achieve better stander living for poor households especially in vulnerable households in agricultural sub-sectors of the country (i.e. those under the poverty line). Accordingly, the paper is proposed the following recommendations:Introduction of suitable advanced technologies and usage of modern agricultural inputs conventional agricultural systems. Evidences have shown that they are conducive to substantial yield improvements and to avoid yield volatility under different agricultural sub-sectors and different production systems will increase the levels of incomes and reduce poverty incident.Promotion of agricultural research sectors.Increase the public and financial sector lending to the agriculture sector. Widespread institutional reform is needed to increase agricultural investment and to create farming entrepreneurs to lead agricultural development in each of the three farming systems.Provision of extra occupations (off-farm income) for poor households farmers more social services will increase likelihood of being in a low poverty status.Raising awareness of rural societies. Promotion of social harmony and equity to avoid Civil war and environmental instability. Setting up a system of generating information for poor households such as household income and expenditure possibly expanded to cover basic information concerning costs and returns of household farms and non-farm activities.
ACKNOWLEDGMENTS
- I am thankful to Alla Almighty for the health and the strength to conduct this study. I express my deep appreciation to my colleagues Prof. Jamalludin Sulaiman and Dr. Saidatulakmal Mohd for their valuable assistance and comments during the course of the study. I am indebted and grateful to the Agricultural Economics and Policy Research Center in Sudan for their great encouragement during the study period.
References
| [1] | Ahmed, E.A., 2009, Economic Aspects and Water Use Efficiency in Elzeidab and Elketiab Schemes of the River Nile State- Sudan. Ph.D. Thesis, University of Khartoum |
| [2] | Angelsen, A. and Kaimowitz, D., 1999, Rethinking the Causes of Deforestation: Lessons from Economic Models, The International Bank for Reconstruction and Development/ The World Bank, The World Bank Research Observer, Vol. 14, No. 1 |
| [3] | Chadha, G.K. (2002). ‘Indian agriculture in the new millennium. Human response to technology challenge’, Presidential Address, 62nd Annual Conference of the Indian Society of Agricultural Economics, New Delhi, India |
| [4] | Dasgupta, B., 1989, Diffusion of Agricultural Innovations in Village India, New Delhi: Wiley Eastern |
| [5] | De Wit, Paul V., 2001, Legality and legitimacy: A study of the access to land, pasture and water; Sudan. A study financed by the European Community; prepared for the IGAD Partner Forum Working Group on Planning for Peace in Sudan by the Food and Agriculture Organization of the United Nations; Draft, FAO 2001 |
| [6] | Dreze, J., Lanjouw, P. and Stern, N., 1992, ‘Economic mobility and agricultural labour in rural India: a case study’, Indian Economic Review, India |
| [7] | DTIS, 2008, Sudan: Revitalizing Non-Oil Exports. Diagnostic Trade Integration Study (DTIS) for the Integrated Framework Program. Study prepared by the World Bank and other international agencies in collaboration with Sudan’s Commission for WTO Affairs (CWTOA), June 2008 |
| [8] | Elbashier, A. and Faki, H. M., 2006, The Role of agriculture in Poverty Reduction and Food Security in the Sudan. Draft for Review (2006) |
| [9] | Elsheikh, S. and Siwar, C., 2004, Tenant Households and Poverty in the Gezira Irrigated Area, Sudan: Analysis and Implications, Faculty of Economics, University Kebangsaan, Selangor, Malaysia |
| [10] | El-Solh, C.F., 2003, Gender, Poverty and Employment in the Arab Region, National Policy Group Policy Integration Department, International Labour Office, Geneva |
| [11] | Eltom, Osman, 1996, Irrigation and water resources; In: Proceedings of the AgriculturalConference, Ministry of Agriculture and Forests, 3–2 March 1996, Khartoum |
| [12] | Elzaki, R., Elamin, E., Ahmed, S., 2010, International Journal of Sudan Research, Vol. 1, No. 1, 2010 Poverty and agricultural development in Sudan |
| [13] | Faki, H., and van Holst Pellekaan, J., 2009, Sudan DTIS: Trade in agricultural products, the World Bank |
| [14] | Faki, H. M., Eltahir M. N., and Abdelaziz A. H., 2009, Poverty Assessment and Mapping in the Sudan. Joint Poverty Progress Report prepared by the Centre for Agricultural Research in the Dry Areas (ICARDA) and Agricultural Economics and Policy Research Centre (AEPRC), Agricultural Research Corporation (ARC), Sudan. Poverty Assessment in Sudan IFAD Grant 961. Final Draft of Progress Report of North Sudan |
| [15] | Gunasena, H.P.M., 2003, Food and Poverty: Technologies for Poverty Alleviation, Council for Agriculture Research & Policy (CARP), Sri Lanka |
| [16] | ICARDA and AEPRC, 2009, Poverty Assessment and Mapping in the Sudan. Joint Poverty Progress Report prepared by the Centre for Agricultural Research in the Dry Areas (ICARDA) and Agricultural Economics and Policy Research Centre (AEPRC),Agricultural Research Corporation (ARC), Sudan. Poverty Assessment in Sudan IFAD Grant 961. Final Draft of Progress Report of North Sudan |
| [17] | Khan, A. R., 2004, Agriculture Development and Poverty Reduction In Sudan. An Analysis of Performance, Policies and Possibilities. University of California, Riverside, Final Draft. Revised 30 May 2004, A Paper Prepared for the UNDP Project on “Macroeconomic Policies for Poverty Reduction in Sudan” |
| [18] | Pearson, S., Gotsch, C. and Bahri, S., 2003, Applications of the Policy Analysis Matrix in Indonesian Agriculture, p.104 |
| [19] | Purnell M.F. and J.H. Venema, 1976, Agricultural potential regions of the Sudan. UNDP Project for Strengthening the Soil Survey (SUD/71/553) Project Working Paper. Ministry of Agriculture, Food and Natural Resources, Democratic Republic of Sudan |
| [20] | Shams, E. S., 2008, The Effect of Technological Production Package on the Yields of Major Crops In Sudan During Seasons 1985/1986–2004/2005. Draft Annual Report 2007, Agricultural Economics and policy Research Center, Agricultural Research Corporation |
| [21] | SSCCSE (Southern Sudan Centre for Census, Statistics and Evaluation) (undated).Southern Sudan Livelihood Profiles: A Guide for Humanitarian andDevelopment Planning. Parklands Nairobi |
| [22] | Szönyi, J.A., E. De Pauw, A. Aw-Hassan, R. La Rovere and B. Nseir, 2005, Mapping agricultural income distribution in rural Syria: A case study in linking poverty to resource endowments. International Center for Agricultural Research in the Dry Areas (ICARDA), Aleppo, Syria |
| [23] | UNDP, 1997, Human Development Report |
| [24] | UNDP, 2004, Agriculture Development and Poverty Reduction in Sudan, an Analysis of Performance, Policies and Possibilities. Final Draft Report, Revised 30 May 2004 |
| [25] | UNEP, 2007, Sudan Post Conflict Environmental Assessment. United Nations Environment Programme, Nairobi, KENYA |
| [26] | World Bank, 1992, World Development Report 1992 shows the growth rate of agriculture between 1965 and 1980 to have been 2.9 per cent per year |
| [27] | World Bank, 1993, World Development Report 1993 shows the growth rate between 1970 and 1980 to have been 3.3 per cent per year |
| [28] | World Bank, 2008, Sudan. Revitalizing non-oil exports - Diagnostic Trade Integration Study (DTIS) for the Integrated Framework Program |
| [29] | Zarroug, Mahgoub, 1996, The pastoral sector: current situation and development prospects. In: Proceedings of the Agricultural Conference, Ministry of Agriculture and Forests, 3–2 March 1996, Khartoum (in Arabic) |