-
Paper Information
- Next Paper
- Previous Paper
- Paper Submission
-
Journal Information
- About This Journal
- Editorial Board
- Current Issue
- Archive
- Author Guidelines
- Contact Us
International Journal of Agriculture and Forestry
p-ISSN: 2165-882X e-ISSN: 2165-8846
2011; 1(1): 14-20
doi: 10.5923/j.ijaf.20110101.03
Sequestrated Carbon: Organic Carbon Pool in the Soils under Different Forest Covers and Land Uses in Garhwal Himalayan Region of
 Abstract
 Reference
 Full-Text PDF
 Full-Text HTML
1Forest Soils & Land Reclamation Division, Forest Research Institute, Dehra Dun, 248006, India
2Forest Informatics Division, Forest Research Institute, Dehra Dun, 248006, India
Correspondence to: S. D. Sharma , Forest Informatics Division, Forest Research Institute, Dehra Dun, 248006, India.
| Email: |  |
Copyright © 2012 Scientific & Academic Publishing. All Rights Reserved.
Sequestration of atmospheric CO2 in the soil, as stable soil organic matter, provides a long lasting solution to decrease the CO2 in the atmosphere. The soil organic carbon pool was estimated in forests, tree plantations, horticulture and grasslands in the Garhwal area of Himalayan region which has wide variety of land uses and land cover. The forestry species included Shorea robusta, Cedrus deodara, Quercus leucotrichophora, Pinus roxburghii, Picea smithiana & Abies pindrow, Pinus wallichiana and Miscellaneous species. Pyrus malus, Psidium guava, Mangifera indica, Citrus spp. and Lichee chinensis were the major fruit crops and the tree plantations comprised of Eucalyptus spp., Tectona grandis, Dalbergia sissoo and Pinus roxburghii. SOC pool was the maximum in the forest lands followed by grass lands, orchards and plantation areas. Differences in SOC pool under different land uses were statistically significant (p < 0.05). The forests had 15.84 million tons (78.49 t ha-1) soil organic carbon pool in this region and P. smithiana & A. pindrow forests had higher mitigation potential as they can store more than double SOC pool as compared to S. robusta. The soils under orchards contained 1.40 million tons SOC pool which is 13.05% of the total SOC pool of the orchards of Uttarakhand state. P. malus had the mitigation potential of 2.71 which indicates that it can have more than double SOC pool as compared to P. guava. SOC Pool in the grasslands was 75.76 t ha-1.
Keywords: Soil Organic Carbon Pool, Natural Forests, Horticulture, Plantations, Grasslands
Cite this paper: M. K. Gupta , S. D. Sharma , "Sequestrated Carbon: Organic Carbon Pool in the Soils under Different Forest Covers and Land Uses in Garhwal Himalayan Region of", International Journal of Agriculture and Forestry, Vol. 1 No. 1, 2011, pp. 14-20. doi: 10.5923/j.ijaf.20110101.03.
Article Outline
1. Introduction
- Concentration of atmospheric CO2 can be lowered either by reducing emissions or by taking CO2 out from the atmosphere and stored in the terrestrial, oceanic or aquatic ecosystems. Several studies have established the fact that carbon sequestration by trees could provide relatively low cost net emission reductions[1,2,3,4]. Most of the carbon enters the ecosystem through the process of photosynthesis in the leaves. After the litter fall, the detritus is decomposed and forms soil organic carbon by microbial process. Intergovernmental Panel on Climate Change has recognized soil organic carbon pool as one of the five major carbon pools for the Land Use Land Use Change in Forestry sector. It is mandatory for all nations to provide soil organic carbon pool and changes from LULUCF sector under National Communications to the United Nation’s Framework Convention on Climate Change.Soil especially, the forest soil is one of the main sinks of carbon on earth because these soils normally contain higher soil organic matter however, the soil organic carbon (SOC) has been ignored since long because it was treated as a dead biomass. Soil contains an important pool of active carbon that plays a major role in the global carbon cycle[5,6]. Soil organic matter is a key component of terrestrial ecosystem. Enhanced sequestration of atmospheric CO2 in the soil, ultimately as stable soil organic matter, provides a more lasting solution than sequestering CO2 in standing biomass. Soils store 2.5 to 3.0 times as much that stored in plants[7] and two to three times more than the atmospheric as CO2[8] The conversion of natural vegetation to various land uses results in rapid decline in soil organic matter[9]. Up to 87% decrease in soil organic carbon due to deforestation has been reported by researchers[10,11]. Land use and soil management practices can significantly influence soil organic carbon dynamics and carbon flux from the soil[9,12]. No systematic project / study has been undertaken to estimate the soil organic carbon pool in forests, as well as in other land uses in the Garhwal Himalayan zone. Although some investigations have been carried out and data generated on the soil organic carbon pool in the forests, but it was on the basis of desk review by using some indirect methods or using some assumptions. Soil organic carbon in India based on different forest types were estimated[13] but the bulk density, which is the key factor for soil organic carbon estimation has been calculated indirectly in their method.Therefore, a study was conducted to estimate SOC pool under different land uses. The results of this study have provided the authentic and comprehensive estimates of the SOC pool under different land uses and vegetation covers. Information generated from this study can be used as a benchmark for future work to estimate the changes in SOC pool in these land uses.
2. Materials and Methods
- The study was carried out in part of Garhwal region of Himalayas which includes Dehra Dun Forest Division, Mussoorie Forest Division, Chakrata Forest Division, Kalsi Soil Conservation Forest Division and part of Rajaji National Park. It lies between 290 56’ 36” N to 300 58’ 26” N latitude and 770 34’ 36” E to 780 18’ 22” E longitude. The sites for soil sampling were selected in four land uses viz. Forests, Plantations, Horticulture and Grasslands. Under forests land use, the SOC pool was estimated in S. robusta, C. deodara, Q. leucotrichophora, P. roxburghii, P. smithiana & A. pindrow, P. wallichiana and Miscellaneous forests. Under horticulture land use the SOC was estimated in P.malus, P. guava, M. indica, Citrus spp. and L. chinensis orchards and under plantation land use the SOC was estimated in block plantations of Eucalyptus spp., T. grandis, D. sissoo and P. roxburghii. Area under different land uses were visited and systematic random sampling was applied for selection of sites in each land use and geographical coordinates and altitude of the sampling sites were recorded by GPS. Five samples were randomly collected for organic carbon estimation and two samples were collected for bulk density and coarse fragment estimation from each sampling sites. In all 154 sampling sites were selected and 1078 soil samples were collected for SOC pool estimation, including 607 soil samples from the forests, 175 samples from the horticulture, 268 samples from the plantations and 28 samples from grasslands. Variation in the number of samples was due to difference in area available under particular land use / species. Information on the sites selected and the number of samples collected are presented in Table 1. Because the input of organic matter is largely from aboveground litter, forest soil organic matter tends to concentrate in the upper soil horizons, with roughly half of the soil organic carbon of the top 100 cm of mineral soil being held in the upper 30 cm layer. The carbon held in the upper profile is often the most chemically decomposable, and the most directly exposed to natural and anthropogenic disturbances[14]. Therefore, soil organic carbon pool was estimated up to the depth of 30 cm in this study.
 SOC horizon =
  ([SOC] * Bulk density * depth * (1 – C fragments) * 10) horizon Where, SOC = Representative soil organic carbon content for the forest type and soil of interest, tones C ha.-1 SOC horizon = Soil organic carbon content for a constituent soil horizon, tones C ha –1[SOC] = Concentration of SOC in a given soil mass obtained from analysis, g C (kg soil)–1Bulk density = Soil mass per sample volume, tones soil m-3 (equivalent to Mg m-3)Depth = Horizon depth or thickness of soil layer, mC Fragment =% volume of coarse fragments / 100, dimensionless
3. Results and Discussion
3.1. Soil Organic Carbon Pool under Forests
- SOC pool under P. smithiana & A .pindrow was maximum (132.00 t ha-1) followed by C. deodara (120.35 t ha-1), Q. leucotrichophora (102.96 t ha-1) and the least was in S. robusta (60.07 t ha-1) (Table 2). SOC pool was nearly similar under S. robusta, P. roxburghii and Miscellaneous forests. It was 9.68% higher under P. smithiana & A. pindrow as compared to C. deodara, 28.21% higher as compared to Q. leucotrichophora and 119.74% higher as compared to S. robusta forests. SOC pool under C. deodara was 16.89% higher as compared to Q. leucotrichophora and 40.48% higher as compared to P. wallichiana while 87.14%, 91.64% 100.35% higher in comparison to Miscellaneous, P. roxburghii and S. robusta forests respectively. Under Q. leucotrichophora forests, SOC pool was 20.18% higher as compared to P. wallichiana and 60.10%, 63.95% and 71.40% higher as compared to Miscellaneous, P. roxburghii and S. robusta respectively. SOC pool under Miscellaneous forests was marginally higher as compared to P. roxburghii (2.40%) and S. robusta (7.06%). Subset for α = 0.05 indicate that P. smithiana & A. pindrow and C. deodara stand separately (a), Q. leucotrichophora stand separately (b), P. wallichiana stand separately (c) and S. robusta, P. roxburghii and Miscellaneous are together (d) (Table 2). Standard Error varied from 2.09 in S. robusta forests to 9.55 in P. wallichiana forests. Reason of slightly higher standard error in P. wallichiana may be due to the fact that area under P. wallichiana forests was very less in study area therefore, lesser numbers of the samples were collected, hence this variation was expected.
| |||||||||||||||||||||||||||||||||||||||||||||||||||||||||||||||||||||||||||||||||||||||||||||||||||||||||||||||||||||||||||||||||||||||||||||||||||||||||||||||||||||||||||||||||||||||||
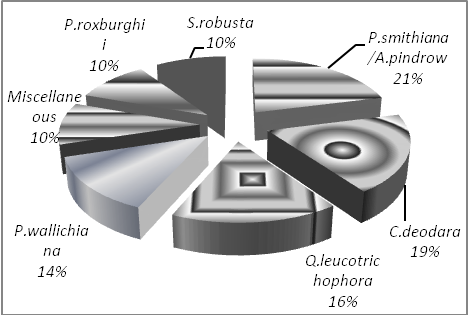 | Figure 1. SOC percent share of different forest covers under Forest Land Use. |
3.2. Soil Organic Pool under Tree Plantations
- The average SOC pool in tree plantation was 46.13tha-1. SOC pool under Eucalyptus spp. was maximum (54.03 t ha-1) followed by P. roxburghii (46.07 t ha-1), T. grandis (41.19 t ha-1) and the least was under D. sissoo (40.8 t ha-1). It has been reported that tree height of 7 m and above had more influence on soil properties than smaller trees[19]. SOC pool under Eucalyptus spp. was 17.28% higher as compared to P. roxburghii while it was 31.17% and 32.43% higher in comparison to T. grandis and D. sissoo respectively. Fraction of total SOC pool shared by each plantation has been shown in Figure 2. SOC pool under Eucalyptus spp. has contributed maximum (29.67%), followed by P. roxburghii (25.30%), T. grandis (22.62%) and the minimum was occupied by D. sissoo (22.40%). Standard error varied from 3.10 to 4.78 which reflects low variation in data. Mitigation potential was worked out for these plantations against D. sissoo as it had the minimum SOC pool. It was observed that Eucalyptus spp. has the maximum mitigation potential (1.32) while all other plantations do not differ much.
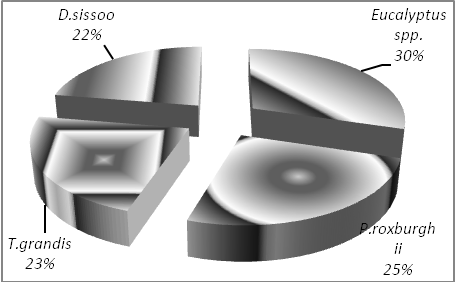 | Figure 2. SOC percent share of different plantations. |
3.3. Soil Organic Pool under Horticulture and Grasslands
- SOC pool under different orchards was estimated and it was found maximum in P. malus (105.2 t ha-1) followed by M. indica (53.24 t ha-1), L. chinensis (45.47 t ha-1), Citrus spp. (43.10 t ha-1) and the P. guava (38.88 t ha-1). However the average SOC pool of this region under horticulture land use was 54.33 t ha-1. Higher SOC pool under P. malus orchards may be because of the reason that these orchards were well maintained and farmers provided lot of inputs including farm yard manure and therefore, higher SOC pool was expected. M. indica orchards had 17.08%, 23.52% and 36.93% higher SOC pool as compared to L. chinensis, Citrus spp. and P. guava respectively. SOC pool under L. chinensis was 5.50% higher as compared to Citrus spp. while 16.95% higher in comparison to P. guava. Standard error varied from 1.56 in Citrus spp. to 4.03 in P. guava except 7.85 in P. malus orchards. Little higher standard error was expected as management of P. malus orchards is different in different farms depending upon the financial status of the farm owner. Maximum share of total SOC pool was shared by P. malus (36.80%) followed by M. indica (18.62%), L. chinensis (15.90%), Citrus spp. (15.08%) and P. guava (13.60%) (Figure. 3). P. malus has high mitigation potential (2.71) which indicates that it can store more than double SOC pool as compared to P. guava. Mitigation potential of L. chinensis, Citrus spp. and P. guava was not much different. The study area has 25336 hectare under horticulture and the soils under this land use have 1.40 million tons SOC pool which is 13.05% of the total SOC pool of the horticulture land use of Uttarakhand state.
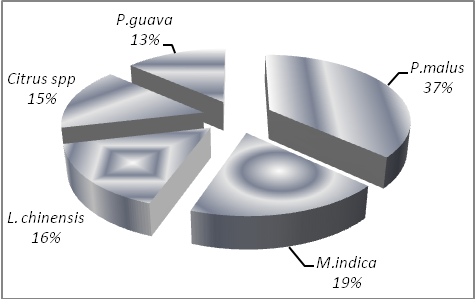 | Figure 3. SOC percent share of different orchards under horticulture land use |
4. Statistical Analysis
- Results of one-way ANOVA indicated that SOC pools between the forestry species were significantly different at 0.05 level (Variance ratio, F = 48.764; p = < 0.05). SOC pool under P. smithiana & A. pindrow was significantly different from the SOC pool under Q. leucotrichophora, S. robusta, P. roxburghii, P. wallichiana and Miscellaneous forests and SOC pool under C. deodara was also statistically significantly different from Q. leucotrichophora, S. robusta, P. roxburghii, P. wallichiana and Miscellaneous forests. SOC pool under Q. leucotrichophora was statistically significantly different from S. robusta, Miscellaneous and P. roxburghii while SOC pool under P. wallichiana forests was significantly different from S. robusta and Miscellaneous forests (Table 2). When SOC pool of different plantations was tested statistically, it was found to be significantly different at 0.05 level (Variance ratio, F= 3.337; p < 0.05). SOC pool under Eucalyptus spp. was statistically different from T. grandis and D. sissoo and it differed non-significantly from D. sissoo, T. grandis and P. roxburghii. When SOC pool of different orchards was tested it was observed that the species i.e. M. indica, L. chinensis, P. malus, P.guava and Citrus spp. were statistically different at 0.05 level (Variance ratio, F = 20.263; p < 0.05). SOC pool under M. indica was significantly different from P. malus and P.guava. SOC pool under P. malus was significantly different with all other orchards (Table 3).
| |||||||||||||||||||||||||||||||||||||||||||||||||||||||||||||||||||||||||||||||||||||||||||||||||||||||||||||||||||||||||||||||||||||||
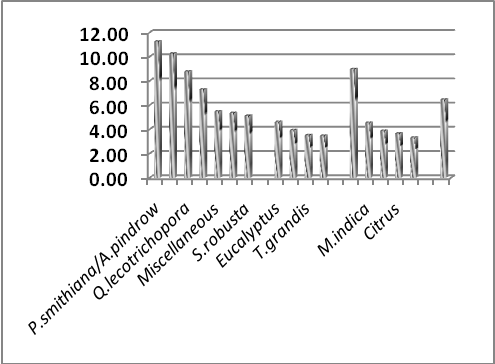 | Figure 4. SOC percent share of different vegetations. |
5. Conclusions
- SOC pool was the maximum in the forest lands followed by grass lands, orchards and plantation areas. Differences in SOC pool under different land uses were statistically significant (p < 0.05). The average content of SOC was 78.49 t ha-1 in forests, 54.33 t ha-1 in orchards, 46.13 t ha-1 in plantations and 75.76 t ha-1 in grasslands. P. smithiana & A. pindrow forests had higher potential to store SOC among the forest species whereas the SOC storage potential of P. malus was higher in case of fruit crops. The capacity to store SOC, in case of Eucalyptus spp. was 1.3 times higher than D. sissoo in case of tree plantations.
References
| [1] | Parks, P. J. and. Hardie, I. W., 1995, Least-cost forest carbon reserves: Cost effective subsidies to convert marginal agricultural land to forests. Land Economics , 71(1), 122:136 |
| [2] | Plantinga, A. J. and Birdsey, R. A., 1995, Carbon fluxes resulting from U.S. Private Timberland Management. Climate Change, 23, 37-53 |
| [3] | Callaway, J. M. and B. Mc Card., 1996, The economic consequences of substituting carbon payments for crop subsidies in US agriculture. Environmental and Resource Economics 1996, 7 (1), 15-43 |
| [4] | Stavin, R. N., 1999, The costs of carbon sequestration: A reveled – Preference approach. American Economic Review, 89 (4), 994-1009 |
| [5] | Melilo, J. M., Kicklighter, D., McGuire, A., Peterjohn, W. and. Newkirk. K, 1995, Global change and its effects on soil organic carbon stocks. In: Dahlem Conference Proceedings, John Wiley and Sons, New York., 175-189 |
| [6] | Prentice, I. C., Farquhar, G. D., Fasham, M. J. R., Goulden, M. L. and Heimann, M.., 2003, The carbon cycle and atmospheric CO2. In: The Third Assessment Report of Intergovernmental Panel on Climate Change (IPCC). Chapter 3, Cambridge University Press, Cambridge |
| [7] | Post, W. M., Pengh, T. H., Emanuel, W., King, A. W., Dale, V. H. and Delnglis., 1990, The global carbon cycle. American Science, 78, 310-326 |
| [8] | Davidson, E. A., Trumbore, S. E and Amudson R., 2000, Soil warming and organic carbon content. Nature, 408, 789-790 |
| [9] | Post, W. M. and Kwon, K. C., 2000, Soil carbon sequestration and land use change Process and potential. Global Change Biology, 6, 317 – 327 |
| [10] | Totey, N. G. Bhowmik, A. K. and Khatri, K.,1986, Performance of Shorea robusta on the soils derived from different parent material in Shahdol forest division, M. P. Indian Forester, 112 (1), 18 –31 |
| [11] | Singh, J.; Borah, I. P. and Baruah, A., 1995, Soil characteristics under three different plant communities of northeast India. Indian Forester, 121 (12), 1130 – 1134 |
| [12] | Tian, H., Melillo, J. M. and Kicklighter, D. W., 2002, Regional carbon dynamics in monsoon Asia and implications for the global carbon cycle. Global and Planetary Change, 37, 201-217 |
| [13] | Chhabra, A., Palria, S.and Dadhwal, V. K., 2002, Growing stock based forest biomass in Indian forests. Biomass and bio-energy, 22 (3), 187-194 |
| [14] | IPCC. 2003, Good Practice Guidance for Land Use, Land Use Change and Forestry. Published by the Institute for Global Environmental Strategies (IGES) for the IPCC. Publishers Institute for Global Environmental Strategies, Japan |
| [15] | Walkley, A. and Black, I. A., 1934, An Examination of Degtjareff Method for Determining Soil Organic Matter and a Proposed Modification of the Chromic Acid Titration Method. Soil Science, 37, 29-37 |
| [16] | Wilde, S. A., Voigt, G. K. and Iyer, J. G., 1994, Soil and Plant Analysis for Tree Culture. Oxford Publishing House, Calcutta, India |
| [17] | Ravindranath, N. H. and Ostwald, M., 2008, Carbon Inventory Methods: Handbook for Greenhouse Gas Inventory, Carbon Mitigation and Round wood Production Projects. Springer Publications |
| [18] | Anon., 2010, Uttaranchal Forest Statistics 2009 - 2010, Forest Department, Uttarakhand |
| [19] | Isichei, A. O. and Moughalu, J. I., 1992, The effects of tree canopy cover on soil fertility in a Nigerian savanna. Journal of Tropical Ecology, 8 (3), 329-338 |
| [20] | Brown, S., 1993, Estimating biomass and biomass change of tropical forests: A primer. FAO Forestry, Paper 134, FAO, Rome |
| [21] | Eswaran H, Reich P. F., Kimble J. M., Beinroth F. H., Padmanabhan E., Moncharoen P., 1999, Global Climate Change and Pedogenic Carbonates (Ed.) by: Lal R, et al. Lewis Publishers, Fl, USA, 15-25 |
| [22] | Bhattacharyya, T., Pal, D. K., Chandran, P., Ray, S. K., Mandal, C., and Talpande, B., 2008, Soil carbon storage capacity as a tool to prioritize area for carbon sequestration, Current Science, 95 (4), 482 – 484 |
| [23] | Batjes, N. H.,1996, Total carbon and nitrogen in the soils of the world. European Journal of Soil Scence, 47, 151-163 |
| [24] | Gua, L. B. and Gifford, R. M., 2002, Soil Carbon stocks and land use change: a meta analysis. Global Change Biology, 8 (4), 345 – 360 |
| [25] | Six, J. and Jastrow, J. D., 2002, Organic matter turnover. Encyclopedia Soil Science, 936-942 |
| [26] | Baker, D. F., 2007, Reassessing carbon sinks, Science, 316, 1708-1709 |
| [27] | West T. O., Post W. M., 2002, Soil organic carbon sequestration rates by tillage and crop rotation: A global data analysis. Soil Science Society of America Journal, 66, 1930-1946 |