Ebrahim Abbasi 1, Sajad Pishghadam 2, Saman Ghasemi 2
1Professor Assistant of Faculty of Social and Economic Science, Alzahra University, Deh vanak, Tehran, Iran
2Ph.D student of Financial Management, Islamic Azad University, Electronic Branch of Tehran, Iran
Correspondence to: Ebrahim Abbasi , Professor Assistant of Faculty of Social and Economic Science, Alzahra University, Deh vanak, Tehran, Iran.
| Email: |  |
Copyright © 2016 Scientific & Academic Publishing. All Rights Reserved.
This work is licensed under the Creative Commons Attribution International License (CC BY).
http://creativecommons.org/licenses/by/4.0/

Abstract
Proper portfolio selection is one of the most important subject in financial literature that follows maximized expected return and minimized the risk aim of investment. Fuzzy multi-attribute decision making (FMADM) method is used to selecting and ranking the stocks of portfolio with fuzzy analytic hierarchy process (FAHP) and fuzzy simple additive weighting (FSAW) as well. Finally, stocks in portfolio ranked based on FAHP and FSAW methods, and showed that the computed rank of selected stocks in portfolio with fuzzy analytic hierarchy process (FAHP) method in comparison with computed rank of selected stocks in portfolio with fuzzy simple additive weighting method didn’t have differential result and the investors can select the criteria for portfolio selection whether FAHP or FSAW.
Keywords:
Portfolio Theory, Multi-Attribute Decision Making, Fuzzy Theory, Fuzzy Analytic Hierarchy Process (FAHP), Fuzzy Simple Additive Weighting (FSAW)
Cite this paper: Ebrahim Abbasi , Sajad Pishghadam , Saman Ghasemi , Fuzzy MADM Approach of Stock Ranking and Portfolio Selection in Tehran Stock Exchange, Human Resource Management Research, Vol. 6 No. 3, 2016, pp. 55-64. doi: 10.5923/j.hrmr.20160603.01.
1. Introduction
One of the important features of industrialized and developing countries is the existence of active and dynamic money and investment markets. In other words, if the savings of individuals with correct mechanism are directed toward the production sector, in addition of efficiency that brings for the capital owners, it can be useful as an important funding, to launch economic projects in the community and if they enter into unhealthy economic trends, it have undesirable effects for society. According to expert opinion, one of the reasons for the underdevelopment of the developing countries is low levels of fixed investing in these countries. The major problem of third world countries is the lack of appropriate structure for investments of individuals and organizations. On the other hand the active participation of investors in the capital market is such that the essence of the existence of Stock Exchange depends on individuals investing. Selecting a suitable portfolio is always considered to be one of the most important issues in financial literature associated with the aim to maximize future returns and to minimize investment risk. In this regard, different techniques and approaches are used, each having advantages and disadvantages. In addition, due to investment market dynamism, in relation to the models portfolio selection processes and new needs are always identified. Current methods of selecting the optimal portfolio do not have necessary performance. Therefore, to solve these problems, innovative approaches are of great concern. Fuzzy Multi Attribute decision making method (FMADM( used in this study to rank and to choose stocks portfolio, is one of the innovative ways that can assess the issue of selection portfolio and its performance by considering the Analytic Hierarchy Process (AHP) and Simple Additive Weighting (SAW). In this study, we intend to answer the question of how fuzzy theory can be consistent with the uncertainty caused by the financial markets and the behavior of investment decision and how Fuzzy Multi Attribute decision making method can act in line with the stock ratings as well as lead to selecting the stock portfolio and determining the portfolio based on its performance.
2. Literature Review
The word "portfolio", in simple words, is referred to a combination of assets which is formed by an investor to Invest and to gain greater efficiencies and to reduce risk. (Noorbakhsh, 2010)Modern stock portfolio theory is a holistic approach to the stock market. This theory, unlike the other methods (technical and fundamental), pays attention to the stock selection or market basket. In other words, the macro perspective is against the microeconomic perspective. As well as in creating a stock portfolio, relationship between risk and return stock with each other as a whole is important. This view is based on mathematical and statistical calculations and using the modern portfolio theory and optimization models, we can construct portfolios with the lowest risk relative to expected return or the highest returns relative to expected risk (Jabbari, 2012).Modern portfolio theory (MPT), is an investment theory that tries to maximize portfolio expected return for accepting an amount of portfolio risk, to equate or to minimize the risk to a level of expected efficiency that this matter is fulfilled through careful choose of different proportions obtained by diverse assets. There are many models in the optimal portfolio selection. The first study in forming of an optimal portfolio is semi-variance model that is presented by Harry Markowitz in 1952. This model is based on the normal distribution of expected stock returns. Since with the escalating crisis in the corporate operating environment, uncertainty is also increased, therefore the use of statistical criteria does not give acceptable, reasonable and adequate results. (Ustun S. K., 2010)Markowitz’s view is the relationship between risk and return. Markowitz, for the first time, proposed the optimizing of portfolio decision making according to the mean and variance criteria. He defined variance portfolio as the sum of the weighted variance and covariance of stock in the portfolio and showed that the stock portfolio diversification can reduce risk. He defined property of efficient stock portfolio as follows: the property of having minimum variance for a given yield or having maximum return for a given risk. He defined locus of efficient portfolios (the different risks) as efficient frontier and used a mathematical second grade programming for obtaining the minimum variance for a given yield. (Abiri, 2011)Ranking (in industry or the overall market) is one of the strategies to achieve the concept of conversion of raw information into relevant information for decision-making. Rankings can be done based on various parameters which are included as fundamental elements of analysis. (Ustun S. K., 2010)The aim of researchers is to use more accurate Word "portfolios engineering" instead of the term "portfolio optimization". The term portfolio engineering was first introduced in the seminal work of Jacobs and Levy (1995), in which they proposed that equity managers use a unified approach when structuring their portfolios, focusing on the widest possible stock universe, not on preselected groups or particular subsets of equity securities. As an effort to implement the use of this word and dispel doubts rooted in universities and educational environment or financial industry, we express the following definition of engineering portfolio:«Portfolio engineering is a cross-disciplinary field that relies on the techniques and methods of mathematical optimization (single or multi-objective), portfolio theory, and computer science to structure high-yield, well-diversified investment portfolios.» (P. Xidonas, 2012)Some mathematical optimization methods and their application in engineering portfolio, based on fuzzy theory and its methods are mentioned following:Multi-criteria decision makingThe multi-criteria decision-making in recent decades has been of interest to researchers. Instead of using the optimality criterion, the multi-criteria is used. In most cases, decisions are desired and satisfactory for the decision maker if decision is evaluated according to multi-criteria. The criteria may be quantitative or qualitative. Multi-criteria decision-making models (MCDM) which are one of the first obvious aspects of the decision making are classified into two major categories of multi-objective decision models (MODM) and Multiple Attribute Decision Making model (MADM). (P. Xidonas, Multicriteria Portfolio Management, 2012).Multi-objective decision modelsIn these models to optimize several targets simultaneously, are considered. The criteria for each goal may be different with scale for other purposes. The main difference between multi-objective decision models and multi-criteria decision-making models is that the former is defined in the decision making continuous space and the second is defined in discrete space. (P.Xidonas, Multicriteria Portfolio Management, 2012)Multi-attribute decision making modelsMultiple Attribute Decision Making, means deciding on the criteria which are usually in conflict. In these models, selecting an option from among the available options is considered. In a general definition, Multi Attribute decision making is referred to certain decisions (the preferred type) such as assessments, priorities, or choosing from the available options (which sometimes should be done between several conflicting attributes). (T. Hester, 2013)Fuzzy theoryFuzzy logic is a strategy by which complex systems that their modeling using classical mathematics and modeling methods is impossible or very difficult can be modeled easily and with greater flexibility. Fuzzy set theory is an extension of traditional set theory "which solves many of the problems associated with uncertain and ambiguous data. This will cause that it include very complex problems with law low. This theory provides a strong mathematical framework and studies phenomena vague conceptual that can be precise. Fuzzy set theory is a valuable tool for strengthening comprehensiveness and reasonableness of the decision-making process. (Patrick T. Hester, 2013)Fuzzy Multiple Attribute Decision MakingThe concept of combining theory and fuzzy Multi Attribute decision-making are expressed as Fuzzy Multiple Attribute Decision Making (FMADM). (Kiris, 2010)Fuzzy hierarchical analysis process (FAHP)Analytic Hierarchy Process or AHP is one of the most popular multi-criteria decision-making techniques that can be used, when the decision maker is faced with several competitor options and decision-making criteria. Approach AHP (Analytical Hierarchy Process fuzzy) is used for determining the benchmark in terms of subjective and individual judgment of each decision-maker. (Ustun S. K., 2010)Fuzzy SAW (SAW)Simple Additive Weighting (SAW) is a valued function formed by additional simple concessions that expresses the target achievement under any standard and is multiplied by special weight. This method can compensate criteria. It also gives insights for decision-making for the selection of suitable alternatives ahead. (Lazim Abdullah, 2014)In this section we focus on providing the current research activities in the field of portfolio management and multi-criteria decision through the pondering the source bibliography and literature of converging and similar studies.Investing approach in the framework of portfolio selection, in the light of the ideas of Markowitz and Sharpe crossed the evolutionary process and application of mathematical programming has increased the accuracy of investing decision in the portfolio selection. Various models for the leading the investing within the framework of portfolio selection using mathematical programming is provided. Because of the development of fuzzy mathematics in many different sciences and its increasing importance in financial matters, different models are presented to solve the financial problems by using the fuzzy mathematics science. In this study, conducted research in the financial field using portfolio theory is first discussed, and then research in the field of portfolio selection using the portfolio theory and the fuzzy set theory is expressed: Hamid Shahristani et al in their research began to study on the generalized theory of Markowitz portfolio optimization through the presentation of their proposed model of optimal stock selection. Findings of this study show that in spite of using the CAPM theory in financial circles by investors, it was observed that this model cannot be used for retail investors because portfolio selected by them are a subset of the market portfolio. Mohammadi and Molaei in a research entitled the use of multi-criteria decision gray in evaluating the performance of companies, using their entropy method, ranked the investment and Mother companies listed on Tehran Stock Exchange based on financial ratios and criteria. They have used the concept of gray theory to overcome the unreliable conditions due to the lack of information.Zohouri and Fazli (2009), using the approach of decision-making and the fuzzy multi-criteria optimization, have presented a new approach for stock screening. Two general criteria are used in this analysis: The firms’ health criteria and the companies market success criteria. Finally, the basic criterion for selecting the suitable companies to invest is proximity of the two criteria of financial health and success in the corporate market. Yahyazadehfar et al (2011) could select and form portfolio using the historical data and statistical techniques of fuzzy set theory in the new model portfolio selection of mean-variance λ to estimate future returns. In this model, they attempted to Portfolio using the financial expert judgment and the optimism - pessimism mentality of investors with respect to the expected return and with the assumption that stock returns are fuzzy random variable.Heibati Farshad et al (2011) in research for optimal stock portfolio using Analytic Hierarchy Process (AHP), gray relational analysis (GRA), and goal programming (GP), in new ways, could select the shares of companies based on investment criteria based on expert opinions, then prioritize them using gray relational analysis. They then selected the optimal portfolio according to the priorities obtained by goal programming. Kav et al in a research, entitled using the gray relationship analysis for solving multi-criteria decision, described this model. In this study, two case studies are solved using gray relational analysis and the resulting solution is compared with the solutions that is obtained by solving the problems using the data covering analysis method, using the TOPSIS method and using the weighted simple sum method (SAW). Ranking the options by gray relational analysis is closer to the results of TOPSIS and simple weighted average. Seffak Kirish et al (2010) presented the fuzzy multi-criteria decision-making approach to portfolio selection under uncertainty. They began to rank the stock portfolio of companies listed on the Istanbul Stock Exchange by an accurate definition of the circumstances and patterns of linguistic (semantic). In their research, they also presented a flexible decision-making method for the integrating of investor’s preferences.The hypothesisPresented the fuzzy multi-criteria decision-making approach to portfolio selection under uncertainty. They began to rank the stock portfolio of companies listed on the Istanbul Stock Exchange by an accurate definition of the circumstances and patterns of linguistic (semantic). In their research, they also presented a flexible decision-making method for the integrating of investor’s preferences.
3. Methodology
In this research, the attitude FMADM (Fuzzy Multi Attribute Decision Making) is presented to rank the stock and to select the portfolio to establish a performance evaluation method for investors. General steps of proposed method are as following:A) Identifying indicators for the stock performance to determine criteria for the constructing a framework for performance evaluation.B) The use of fuzzy AHP to find the weight criteria using individual and subjective guesses.C) Application of SAW fuzzy (FSAW) to the stock performance ranking.D) Create a portfolio using the stock performance. (Ustun S. K., 2010)As this study states ranking the stock and portfolio selection based on multi-criteria decision, so according to the definition of multi-criteria decision making, identifying and designating them as studied variable criteria (criteria) is carried out.One of the main criteria that can be taken into account as a criterion in hypothesis of study, is the financial structure criteria, which can be defined as expected returns, the ratio of price to earnings per share, profit (loss) net, the market price (value office) etc. given in the hierarchical structure evaluation in fuzzy portfolio selection problem. That is, when the investment strategy for portfolio selection is evaluated according to the mentioned aspects, they can be proposed as a fuzzy multi-attribute decision problem. After that the decision-making criteria problem is determined, weighting the variables should be done based on AHP fuzzy and aaccording to the mental guesses and the linguistic variables. Afterwards, based on the weighted simple fuzzy sum and according to the three steps of evaluation (evaluating the variables), fuzzy combined decision and ranking the fuzzy number by without scaling the data, the performance of the stock is ranked. Finally, the stock portfolio is expressed by stock performance and its ranking. (Ustun S. K., 2010)Software MATLAB will be used for performing the data analysis for the implementation of fuzzy multi-criteria decision-making methods, to rank and select the stock portfolio. The population in this study is related to all public companies listed on the Tehran Stock Exchange which were active in the considered period. The sample based on the limitations of the statistical population is determined as follows:1. All active companies in leading industries that are accepted by the end of 2009 at Tehran Stock Exchange, and by the end of 2012 still exist in the markets list of security exchange.2. They fiscal year ended March each year.3. During this period, not having more than three month transactional interruption.4. Companies that their natures are not investing companies, because we do not intend to form new portfolio from the stock portfolio.5. During this period the three-year financial information is available and their information can be accessed.On this basis, and considering the limitations mentioned, among all companies in the Tehran Stock Exchange, 62 companies were selected from the community.Do any research to answer the research questions and hypothesis testing involves detecting, identifying and defining each of the variables is accurate. Variables based on hierarchical structure charts as well Multiple Attribute Decision Making Based on Fuzzy approach to the problem of fuzzy portfolio selection are expressed as follows:The FAHP methodHierarchical fuzzy concepts used in the analysis are briefly described below: Fuzzy number (a qualitative criteria to quantitative criteria) The concepts used in fuzzy hierarchical analysis is briefly described below:Fuzzy number (converting the qualitative criteria to quantitative one):Fuzzy numbers are a fuzzy subsets of real numbers that indicates the extent of the confidence interval. This number is proposed in the form of a triangular fuzzy number (TFN), is used for weighting and value of success of prediction. According to the definition Larhuven and Pdrych in 1983, a triangular fuzzy number (TFN) must have the following basic characteristics: (Kiris, 2010)A fuzzy number one on the R, if a member of the 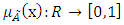 , a triangular fuzzy number (TFN) and is equal to:
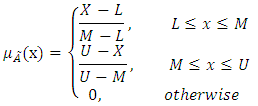 Where L and U respectively as upper and lower boundaries are fuzzy number A, and M is defined as the nominal value. Triangular fuzzy number (TFN) can be expressed as
  be shown and operational rules two triangular fuzzy number
  and
and 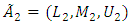 is shown as follows:A) Collecting a fuzzy number:
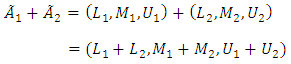 B) Subtract a fuzzy number:
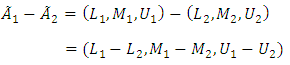 C) Multiplied by a fuzzy number:
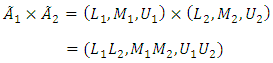 D) For
  and
and  and
and  into a fuzzy number will be as follows:
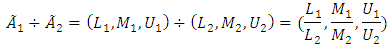 E) For
  and
and  and
and  reverse a fuzzy number will be as follows:
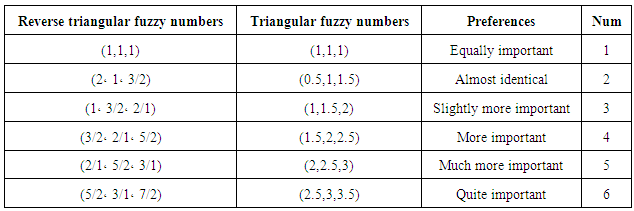
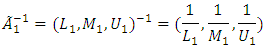 Linguistic variables (mean)In this research, computational techniques are based on fuzzy numbers defined by Karaman and his colleagues in 2006, according to Table 1:
Table 1. Linguistic variables
 |
| |
|
Linguistic variables have first been used for evaluating of semantic ratios that by investors to compare binary pairs and the importance of standards in AHP was given. As well as the performance of variables for each criterion are used, as a method to calculate by the linguistic conditions as "very good", "good", "relatively good", "weak" and "very weak". Procedure and methods to determine and evaluate weights of criteria By FAHP can be classified according to the following steps:First stage: Formation of Comparative matrix pairs (pairs) among all elements (criteria) in the size of hierarchical system and to identify and assign conditions and patterns of linguistic (semantic) to compare pairs of double standards by using this question which of the two elements (criteria) are more important.Second stage: The use of geometric mean technique in the expression of geometric mean fuzzy and fuzzy weight of each criterion based on the model of Buckley is according to the following relationship: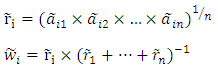 Where
Where  is in comparative value of criterion I relative to the criterion n. Therefore,
  is fuzzy geometric mean comparative value criterion i compared to other criteria and where
  fuzzy weight of i-th criterion, can be denoted by a triangular number fuzzy as
  . Here
  and
and  are respectively low, average and up value of i-th criterion. (Ustun S. K., 2010)SAW phase (Fuzzy SAW):Additional simple weighting (SAW) is the valued function based on additional concessions simple form that expresses the target achievement under any criterion and is multiplied by special weight. This method is able to compensate criteria. It also provided insight into the decision-maker for creating the selection of available suitable alternatives. Its calculation is simple and can be done without the aid of complicated computer programs.FSAW can be expressed as follows:Measure the variables:By using the assessment of linguistic variables (semantic) to show the performance criteria by such phrases as "very good", "good", "relatively good", "weak" and "very weak", investors will be asked to judge their mental transfer and each variable linguistic (semantic) can be shown by a TFN (triangular fuzzy numbers) with the scale between the 0-100.Consider
  for denoting the value of fuzzy performance of investor k which states variable i under criterion j, and all the evaluation criteria will be shown as follows:
 This study uses the concept of mean value, for integrating the value of judgment fuzzy investor m that is as follow:
 The value of endpoint
  of the average fuzzy number
  can be solved by method of Buckley as follow:
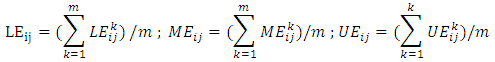 Fuzzy synthetic decisionAccording to the weight of each of the above criteria, the weight
  is derived from FAHP that direction (vector) w = weight criteria can be denoted
  , while fuzzy performance matrix E in each of the variables can be obtained by each fuzzy performance value of variable under criterion n and is equal to
  . (Ustun S. K., 2010)Approximation of fuzzy number
  of Fuzzy Synthetic Decision variables can be denoted
  . Considering the fact that
  are respectively the value of low, medium and high combined performance of variable i which is as follow:
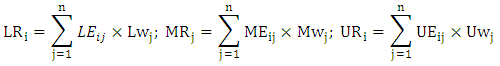 Ranking the fuzzy numbersIn stock rating, one can try to form the portfolio according to the BNP values calculated for each variable. (Ustun S. K., 2010)In this study, procedure of defuzzification is defined in the form of determining the value of the best non-fuzzy performance (BNP), which is simple and practical method and the does not need to consider the preferences of investors. The best non-fuzzy performance (BNP) of fuzzy number
  can be obtained by the following equation:
 Problem of stability and determining the fuzzy binary comparison matrix in FAHP is another issue that needs to be addressed. Stability and determination of comparison matrix in AHP is evaluated by the ratio stability. But the results of fuzzy synthetic decision obtained by fuzzy numbers are due to the linguistic judgments. Hence, it is necessary that non-fuzzy ranking method or in other words defuzzification or making non- fuzzy technique is used. Defuzzification is a technique for converting fuzzy numbers to the real ones. There are several methods for this purpose. In this study, we have used the best non-fuzzy performance method. Implementation of fuzzy AHP methodStep One: outlining the modelBecause in this study, the AHP method is used for ranking and selection of the portfolio, so the first step is to create a hierarchical structure. At this point, using the information obtained from the previous steps, the hierarchy was established. Then, to outline hierarchy, dependency relationships between criteria was evaluated by a team of experts according to corresponding indices and the companies included in the portfolio, through nominal group method. The research variables by hierarchical structure diagram as well Multi Attribute Decision Making Based on fuzzy approach to solve the problem fuzzy portfolio selection are expressible according figure 1.
 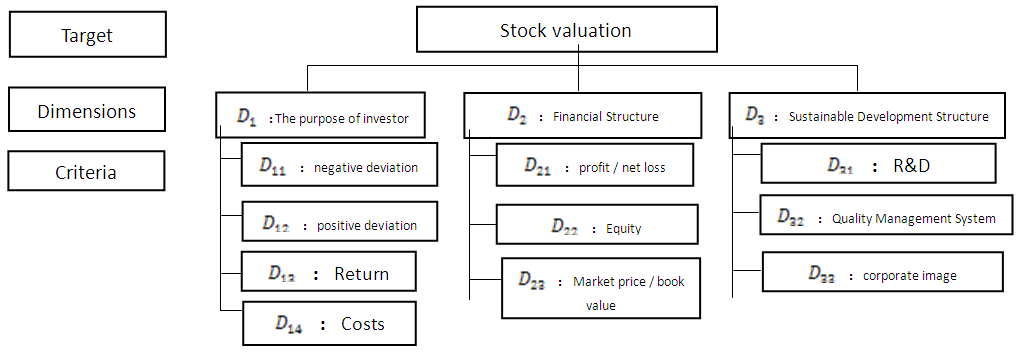 | Figure 1. The hierarchical structure evaluation |
Step Two: Pairwise comparisons and calculating the indexes Compatibility:After collecting questionnaires paired comparisons, Compatibility indices were calculated for all matrices, to ensure paired comparisons numbers.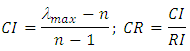 where in:CI: Compatibility IndexCR: Rate AdjustmentRI: Random Indexn: number of factors comparedInconsistency rate of matrices less than 0.1 is certified and reliableAccording to the carried out calculations and based on collected the data, finally, the rate of incompatibility matrices was 0.081 that is less than 0.1.Step Three: forming the judgment matrix To calculate the weighted geometric mean of comments, it is operated according to following relation:
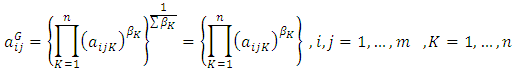 Step Four: Calculate the weight of evaluation criteria In the following steps, the calculations of weight of evaluation criteria according to the fuzzy analytic hierarchy process are presented:Calculating
  for each pair-wise comparison matrix row:After calculating the weighted geometric mean comparison matrix,
  , which is a triangular fuzzy number for each of the rows of the matrices, is calculated from the following relation:
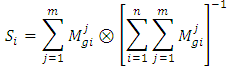 In this relation i represents the i-th row and j represents the j-th column. In this relation
  are triangular fuzzy numbers are pair-wise comparison matrix.Calculation of magnitude of
  relative to each other:In general, if
 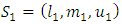 and
and 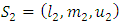 are two triangular fuzzy numbers, magnitude
  relative to the
  is defined as follows:
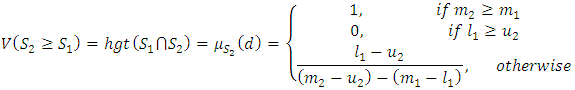 Calculating the magnitude degree of a convex fuzzy number:Calculate the magnitude of a convex fuzzy number S that is greater than K convex fuzzy number
  that
that  is obtained as follows:
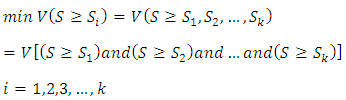 Calculating the weight or importance of criteria:Following relation is used to calculate the weight of the criteria:
 So not normalized weight vector will be as follows:
 Calculation of the final weight in the form of normalized criteria:By help of the above relation, non-normal relationship results obtained from the previous step is normalized, obtained normalized results is called W.
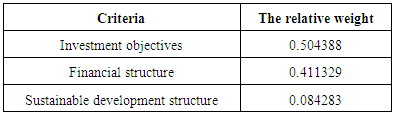
Table 2. Calculate the relative weights of the criteria
 |
| |
|
Step Five: calculation of the final weight of criteriaIn this step, dependence matrix was formed using the matrices of final weight of weighted average of pairwise comparison of the total weight interdependence criteria. The final weight of each criterion was obtained according to following relation from the dependency matrix multiplication multiplied by the relative weighting matrix criteria, obtained from a weighted average pairwise comparison matrices criteria. In the following the way of calculating the final weight of criteria is given:
 : final weight of the j-th criterion B: dependency matrix criteria
 : the relative weight of the j-th criterion
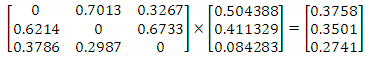
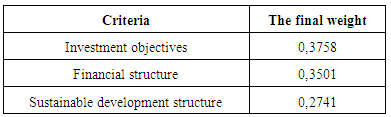
Table 3. Calculate the final weight of the criteria
 |
| |
|
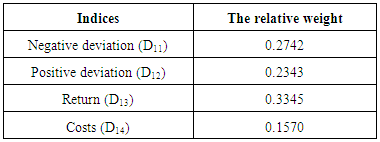
Step Six: calculating the relative weight of indicesThe first index includes 4 sub-criteria and second and third criteria, each include three sub-criteria. To determine the relative weights of the sub-criteria, we act similar the steps 1 to 5 which was mentioned in step 4.The relative weight of investor’s purposes:In this step using paired comparisons of the quadruple criterion indices of investors’ purposes relative to each other, the relative weight of each was obtained according to the corresponding judgment matrix.Table 4. Compute the relative weights investment goals
 |
| |
|
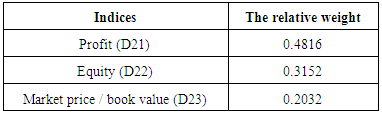
The relative weight of the financial structure:With paired comparisons of triple indices of criterion of financial structure relative to each other, the relative weight of each was obtained according to the corresponding judgment matrix.Table 5. Compute the relative weights in the financial structure
 |
| |
|
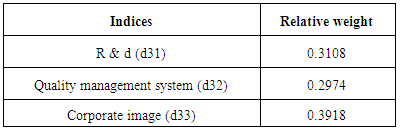
The relative weight of the sustainable development indices:Triple indices of sustainable development criterion were compared relative to each other and relative weight of each was obtained according to the corresponding judgment matrix.Table 6. Compute the relative weights in the Index of Sustainable Development
 |
| |
|
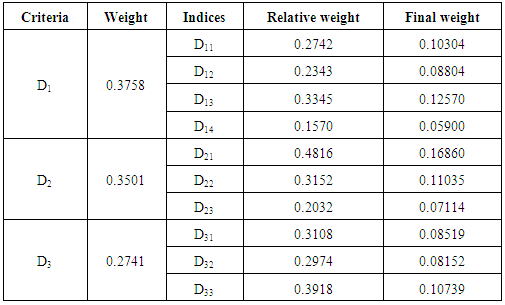
Step Seven: The final weight calculation indicesIn this step, the final weight of each of the indices has been obtained according to following relation by multiplying its relative weight by the final weight of its leaders. According to the above definition, the final weight of each of the indices is calculated in the following table: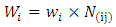
 final weight of the i-th index
 relative weights of the i-th index,
 final weight of the j-th criterion, leaders of the i-th index
Table 7. Calculate the final weight in the indices
 |
| |
|
Step Eight: calculation of relative weight of portfolio companiesAfter calculating the final weight of each of the indices, the relative weight of each of the companies in the portfolio was calculated according to the paired comparisons. In this point, every company existing in the portfolio (options) relative to the individuals sub-criteria are compared with each other.Step Nine: Calculate the weight of portfolio companiesSince the final weight of each of the portfolio companies is obtained by a combination of their ratings with respect to the indices, the weight of each of the portfolio companies is obtained by the following equation.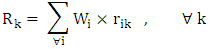
 final weight of the k-th portfolios company
 final weight of the i-th subcriteria
 the relative weight of the k-th portfolio company with respect to the i-th sub-criteria.Step Ten: Prioritization of portfolio companiesAccording to the final weights obtained from existing companies in the portfolio in the previous step and according to the criteria and existing conditions, Ranking the selected companies carried out.Implementation of SAW (SAW fuzzy)Step One: weighting indicesAs previously mentioned, first step in the SAW method is toweigh indices. Similar to the fuzzy AHP method for weighting the indices, we utilized paired comparisons. Step Two: The use of fuzzy approach to form decision-making matrixAfter determining the amount of weights, criteria, in the next step it is necessary that a value is assigned to each of the investors (portfolio companies) according to the above-mentioned indices. As previously mentioned, since the decision-maker provides values of the decision matrix in the form of subjective and qualitative based on indices, because of the being verbal nature of the variables.Fuzzy approach can be used to initialize them. fuzzy numbers used in this research that are introduced to assess investor j against the index i, is denoted in the form of
 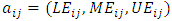 . In this approach, Valuation spectrum for each index is 5-point Likert spectrum and for each option (very low, low, medium, high and very high) has been defined to be a triangular membership function ranging from zero to 100. In this way, for the option quite low, fuzzy number (60, 30, 0) is defined, for the bottom option, fuzzy number (70, 40, 10) is defined, for medium option, fuzzy number (80, 50, 20) is defined, for the top option, fuzzy number (90, 60, 30) ) is defined and for high option, fuzzy number (100, 70, 40) is defined.Step Three: defuzzification decision matrix with the center area methodAfter determining the fuzzy values of investors, for the convenience of calculation it is necessary that all fuzzy numbers are converted to certain numbers or so-called defuzzy. For defuzzification of the fuzzy values, the center area method is used. Following relation shows formula of center area for the defuzzification:
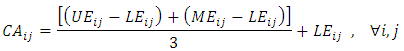 where
where  indicates the defuzzificated value of a fuzzy number.Step Four: evaluating and prioritizing short-term goals using SAW techniqueSAW technique is one of the oldest methods applying in the approach MADM. In this method, by having a vector W (weight index) and the value non-scaled of any option with respect to each Index
  , the most suitable option for
  can be calculated according to following relation.
 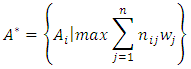 In other words, in this way, a better option is that the sum of the weighted values Scale
  is greater than the other options. This method requires similar scales or non-scaled measurements that can be compared with each other option.Findings of research using the methods of AHP and SAWIn each study, proceeding the findings and its results are considered to be important part. In fact, the detailed analysis and correct conclusions of the collected data, because they are investigated as the basis for future planning in society, are of much more important. The obtained results should be documented and be explainable to the scientific community to ensure its accuracy, and can be used for rectifying the defects and shortcomings and typically moving to the commercialization of research. The results obtained by the application of AHPIn this study, we were to apply other criteria in addition to the traditional criteria for stock selection and portfolio risk and return in the ranking. These criteria were identified by the hierarchical structure diagram and by the goals of investors and by the relationships between criteria and sub criteria, after collecting the opinion of experts, through completing the questionnaires designed and paired comparisons based on linguistic variables.Then, to ensure the numbers pairwise comparisons, compatible standards were calculated for all matrices. Inconsistency rate obtained for each matrix should not be greater than 0.1, otherwise the matrix is incompatible. Calculation of the rate of incompatibility Showed that this rate is 0.081, which is less than 0.1, and is not a sign of incompatibility of matrices.In the next step, the relative weight of criteria was obtained and showed that the relative weight of standard investor purposes (D1) 0.504388 weight and criteria of financial structure (D2) with a weight of 0.411329 As well as the criteria of sustainable development with the relative weight of 0.084283, are respectively in the second and the third priority and reflects the fact that individuals are paying more attention to the purpose criteria of investing.In determining the final weighting criteria, it was found that the final weight of investor’s purposes criteria of weigh 0.3758, has the most weight and financial structure criteria and the structure of sustainable development of weights 0.3501 and 0.2741, respectively, are next in rank. One of the main reasons for the rankings in determining the final weight is investors desire to get more average returns from the investing done in stocks of selected companies which the sub-criteria (average return) is related to criteria of purpose of the investor’s investing.Like the relative weight of the criteria, the relative weight of their sub criteria was also tested in a hierarchical diagram. Calculations show that relative weight of the average returns, among the sub criteria related to the investing purpose criteria in a hierarchical diagram, it has more weight and its weight is equal to 0.3345. Similarly, the standard deviation of the negative (less risk) of the value 0.2742 is in second priority and sub positive deviation (risk) and the cost respectively with values of 0.2343 and 0.1570, are in the next ranks. This ranking indicates that from the viewpoint of experts, among the sub-criteria related to the main criterion for the purpose of investing, investors pay more attention to average returns sub-criteria. Calculations show that in determining the relative weight criteria, the financial structure criterion (D2), the relative weight of the profit criterion, by assigning weight 0.4816, has the highest weight and is in first rank. This ranking indicates that from the view of experts, among the sub-criteria related to the main criterion of the company's financial structure, investors pay more attention to sub-criteria profit. Calculations show that in determining the relative weights of the sub-criteria of sustainable development criterion (D3), the relative weight of the standard company image by assigning relative weights of 0.3918 is in the first rank and the criteria for R & D and quality management system respectively with assigning the weight of 0.3108 and 0.2974 are respectively in second and third . This ranking indicates that from the view of experts, among the sub-criteria related tomain criterion of sustainable development of a company structure, investors pay more attention to company image sub-criteria. In determining the final weight of all the sub-criteria and according to the final weight criteria, It was found that sub-criteria net profit by assigning a weight of 0.16860 is in first rank with the highest weight And sub-criteria of average efficiency, equity and corporate image respectively by assigning weights to 0.12570, 0.11035 and 0.10739 are in second up fourth and the rest of the criteria, likewise were next in rank. The results obtained by the application of SAW In implementation of FSAW method due to the enormous calculation in the FAHP method, this method has been used as an alternative and comparison method we acted in following way:The index weight influencing the investor selection was done by pairwise comparison method. In the next step, the decision matrix is formed and assigned by the fuzzy numbers. After the making matrix using BNP which is one of the center area method in fuzzy theory and method FSAW, fuzzy numbers became definitive.
4. Conclusions
In this study, we proceed to review the issues related to the selection and stock ratings based approach FMADM in the Tehran Stock Exchange. Topics such as new portfolio theory, and fuzzy multi-criteria decision-making methods in its implementation, fuzzy hierarchical analysis process (FAHP) and how to implement it in determining and ranking the stocks in the portfolio, fuzzy SAW method (FSAW) and how to implement it in the selection and ranking of portfolios in an effort comparable with fuzzy hierarchical analysis process (FAHP) was expressed.Although the analytic hierarchy process (AHP) was developed by hour in 1980, a very useful tool for decision analysis in relation to the issue of multi-criteria decision takes into account, but in this study, fuzzy Analytic Hierarchy Process ( FAHP) based on the method of Buckley in years 1985 , and also the method of Karaman and their colleagues in the year 2006 for the analysis of the fuzzy hierarchical stated and type of expanded AHP model is hour model, has been used in order that in some cases, the creditors would be allowed to make use of ratio fuzzy instead of ratio accurate.The present research activity is in the field of connectivity portfolio management (PM) and Multiple Attribute Decision Making which has been developed with valuable suggestions to improve the efficiency of people involved in the investment activities either directly or indirectly. Fuzzy multi attribute Method (MADM), used in the research to rank and to select stock portfolio, is one of the innovative methods that can evaluate the stock portfolio selection problem and its performance by considering the technique of analytic hierarchy process (AHP) and also Simple Additive Weighting (SAW). According to the obtained results, it was determined that the results of these two are almost similar to each other and there is no discernible difference in the raking of investing by the two methods. Prioritizing the existing firms in the stock portfolio was also carried out by two ways of fuzzy SAW and fuzzy AHP. Therefore According to the results, investors are able for selecting and ranking the stock portfolio, use separately each of the fuzzy multi-criteria decision-making methods approach, consisted of two methods fuzzy hierarchical analysis process (FAHP) and SAW phase (FSAW). Researchers’ suggestion to investors is to use both techniques simultaneously so that they can obtain better results and comparable by using the two methods of FAHP and FSAW in decision-making.
References
| [1] | Abbasi Ebrahim, Moghadasi motahare. (2010). Selection and portfolio optimization using genetic algorithms based on different definitions of risk. Journal of Industrial Management, Islamic Azad University. Fifth year. No. 11. pp. 115-135. |
| [2] | Ching-Lai Hwang, Sho-Jen Chen. (1992). Fuzzy Multiple Attribute Decision Making. Berlin: Springer. Book Volume 375. |
| [3] | Enrique Ballestero, Mila Bravo, Blanca Pérez-Gladish, Mar Arenas-Parra, David Plà-Santamaria. (2012). Socially Responsible Investment: A multicriteria approach to portfolio selection combining ethical and financial objectives. European Journal of Operational Research, Volume 216, Issue 2, 16 January 2012, Pages 487–494. |
| [4] | Hasan Selim, Mualla Gonca Yunusoglu. (2013). A fuzzy rule based expert system for stock evaluation and portfolio construction : An application to Istanbul Stock Exchange . Expert System with Application , Volume 40, Issue 3, 15 February 2013, Pages 908–920. |
| [5] | Heibati Farshad, Rahnama Roodposhti Fereidoon, M.A Afsharkazemy, and A.H Abiry, (2011). Portfolio selection model evaluation using Analytical Hierarchy Process (AHP), gray relational analysis (GRA) and goal programming (GP). Journal of Financial Engineering and Management portfolios. Volume 2. (6). Pages 107-137. |
| [6] | Lazim Abdullah, C.W. Rabiatul Adawiyah. (2014). Simple Additive Weighting Methods of Multicriteria Decision Making and Application: A Decade Review. International Journal of Informayion Processing and Management (IJIPM), Volume 5, Number 1, February 2014. |
| [7] | Nese Yalcin Secme, Ali Bayrakdaroğlu, Cengiz Kahraman. (2009). Fuzzy performance evaluation in Turkish Banking Sector using Analytic Hierarchy Process and TOPSIS. Expert System with Application, Volume 36, Issue 9, November 2009, Pages 11699–11709. |
| [8] | Ozden Ustun, Safak Kiris. (2010). FUZZY MCDM APPROACH OF STOCKS EVALUATION AND PORTFOLIO SELECTION. 24th Mini EURO Conference “Continuous Optimization and Information-Based Technologies in the Financial Sector” (pp. 330-336). Izmir - Turkey: Izmir University of Economics, Turkey 2010. |
| [9] | Panos Xidonas, Mavrotas, G., Krintas, T., Psarras, J., Zopounidis, C. (2012). Multicriteria Portfolio Management. Springer Optimization and its Application, Springer Science + Business Media New York 2012, Pages 57-83. |
| [10] | Patrick T. Hester, Mark Velasquez. (2013). An Analysis of Multi-Criteria Decision Making Methods. International Journal of Operation Research, Volume 10, No. 2, Pages 56-66. |
| [11] | Safar Fazli and Taghizadeh Rasoul. (2010). Fuzzy ranking method for the optimum portfolio selection in Tehran Stock Exchange. Journal of Industrial Management Studies, Volume 8 Issue 19, Pages 125-146. |
| [12] | Yahyazadehfar Mahmoud, Safaei Qadikolaei Abdul Hamid and Khakpoor Mehdi, (2011). Compare the models at random and fuzzy random stock portfolio based on the expected return on the Tehran Stock Exchange. Shiraz University of accounting developments. Volume 3. (1). Pages 171-196. |

 Abstract
 Reference
 Full-Text PDF
 Full-text HTML