-
Paper Information
- Paper Submission
-
Journal Information
- About This Journal
- Editorial Board
- Current Issue
- Archive
- Author Guidelines
- Contact Us
Human Resource Management Research
p-ISSN: 2169-9607 e-ISSN: 2169-9666
2016; 6(2): 23-39
doi:10.5923/j.hrmr.20160602.01

Leader-Member Exchange and Its Relationship to Quality of Work and Stress among Information Technology (IT) Workers
 Abstract
 Reference
 Full-Text PDF
 Full-text HTML
James M. Fisher1, Sheila Hadley Strider2, Mark G. Kelso1
1College of Business, Columbia Southern University, Orange Beach, USA
2College of Business and Mass Communications, Brenau University, Gainesville, USA
Correspondence to: Sheila Hadley Strider, College of Business and Mass Communications, Brenau University, Gainesville, USA.
| Email: |  |
Copyright © 2016 Scientific & Academic Publishing. All Rights Reserved.
This work is licensed under the Creative Commons Attribution International License (CC BY).
http://creativecommons.org/licenses/by/4.0/

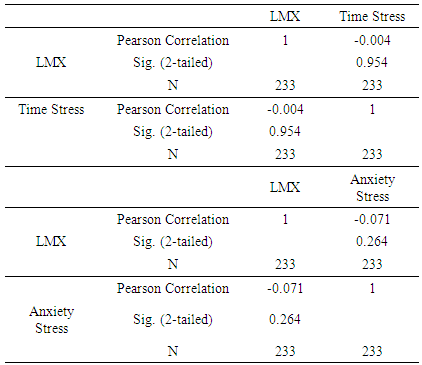
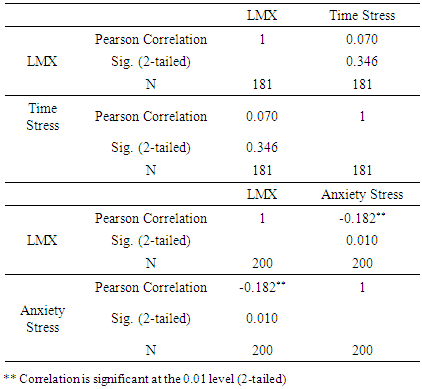
In the U.S., Information Technology (IT) organizations are a $639.4 billion-a-year business. Roughly, 60% of all IT workers feel stress in their jobs. The purpose of this quantitative correlational study was to identify to what degree, if any, a relationship existed between Leader-Member Exchange (LMX) and the levels of stress in IT organizations. The sample population consisted of IT professionals (n=449) of which 249 workers were from IT small-to-medium enterprises (SMEs) and 200 workers from large IT organizations. The target population (N=84,000) was from the Western region of the U.S. The Internet-based 28-item survey included the LMX-7 and Parker and DeCotiis job stress instruments. Examined were two dimensions of stress - time stress and anxiety stress. In IT SMEs and large IT organizations there were high quality leader-member exchanges. However, there was no correlation between LMX quality and time stress among IT workers within SMEs (p= .954) and large organizations (p= .346). Similarly, in SMEs, there was no relationship between anxiety stress and quality LMX (p = .264). Nonetheless, in large IT organizations there was a correlation between anxiety stress and quality LMX (p= .010). The p-value of .010 suggested that there was overwhelming evidence to infer that the alternative hypothesis was true.
Keywords: Leader-member exchange, Stress, Information technology, LMX-7, Parker and DeCotiis job stress scale, and IT
Cite this paper: James M. Fisher, Sheila Hadley Strider, Mark G. Kelso, Leader-Member Exchange and Its Relationship to Quality of Work and Stress among Information Technology (IT) Workers, Human Resource Management Research, Vol. 6 No. 2, 2016, pp. 23-39. doi: 10.5923/j.hrmr.20160602.01.
Article Outline
1. Introduction
- In April 2015, United States (U.S.) workers’ engagement in their employment was only 31.7% (Adkins, 2015). The remaining 68.3% of U.S. workers cost U.S. companies between $450 and $550 billion in lost annual revenue due to a decline in productivity (Sorensen & Garman, 2015). Job stress was a contributor to the causes of lost productivity (Johns, 2010). Job stress is a negative behavior that erodes revenue through a lack of productivity in workers (Johns, 2010). The costs of job stress were $300 billion per year (Petree, Broome, & Bennett, 2012). This study included the exploration of a possible correlation between leader-member exchange (LMX) quality and stress in workers of small-medium enterprises (SMEs) and in large information technology (IT) organizations. According to previous researchers, a relationship existed between LMX and job turnover, job satisfaction, organizational commitment, organizational citizenship behavior, and role stressors (Dulebohn, Brommer, Liden, Brouer, & Ferris, 2012; Harris, Li, & Kirkman, 2014). Nonetheless, this researcher studied IT workers in SMEs of 500 or fewer workers and large IT organizations with 501 or more workers within the Western region of the U.S. to extend previous research in LMX quality and stress. This researcher also discovered how LMX quality might assuage stress on workers in IT organizations. According to the Gross Domestic Products by Organizations and State Analysis (2009), IT organizations in the U.S. are a $639.4 billion-a-year business. However, roughly 60% of all IT workers suffer from stress in their jobs (Lorenz, 2014). Therefore, studying the relationship between LMX quality and stress in IT organizations was worthwhile due to the negative impact of stress on the economy.
2. Leader-Member Exchange Theory
- The leader-member exchange (LMX) theory rose to prominence in the 1970’s (Graen & Cashman, 1975). Since most leadership theories included a focus on the leader, researchers suggested a dyadic approach based on the vertical interaction between a leader and follower (Kalshoven, De Hartog, & De Hough, 2011; Power, 2013). LMX researchers reported relationships between LMX and various constructs including job stress, conflict, job involvement, mutual trust, employee engagement, interaction, and support from management (DeConinck, 2011; Dulebohn et al., 2012). Harris et al. (2014) found that high-quality LMX relationships were favorable. However, Thomas and Landau (2009) discovered that mentoring relationships with immediate supervisors decreased stress levels of workers, thus improving the health of the organization.High-quality LMX relationships enabled workers to gain greater job satisfaction and job autonomy (Harris et al., 2014; Zhang, Wang, & Shi, 2012). Workers also were more amicable in higher LMX than workers who had lower LMX relationships (Bisel, Messersmith, & Keller, 2012). Moreover, as the quality of LMX increased, employee organizational identity rose and turnovers decreased (Harris et al., 2014; Stark & Jeffries, 2011). In addition, in LMX quality relationships, workers viewed their jobs positively (Stark & Jeffries, 2011). Nevertheless, DeConinck (2011) suggested that LMX does not affect turnovers. Since there is a research gap concerning LMX and stress, the intent was to increase the body of knowledge on the effects of LMX and stress in IT organizations (Hesselgreaves & Scholarios, 2014; Lawrence & Kacmar, 2012).In the U.S., the disengagement of 68.3% of all workers costs the U.S. economy between $450 and $550 billion each year (Sorensen & Garman, 2015). The annual cost of job stress in the U.S. is roughly $300 billion (Petree et al., 2012). Therefore, determining if a correlation existed between LMX quality and stress levels IT workers was essential to combating the adverse financial impact that stress causes in the workplace (Abii, Orgula, & Rose, 2013; Harris et al., 2014; Lorenz, 2014). Researchers exploring this topic suggested there might be a correlation between LMX to stress (Hesselgreaves & Scholarios, 2014; Lawrence & Kacmar, 2012). Consequently, we were particularly interested in the influence of stress levels on IT workers in the Western region of the United States, and the outcomes quality LMX had on the same IT workers. The intent of our research was to bridge the knowledge gap between LMX quality and stress levels of IT workers. LMX was the independent variable and stress was the dependent variable.
3. Stress, the Workplace, and LMX
- The 2014 IT Stress and Pride Survey stated that job stress adversely affected 62% of all IT workers (Eddy, 2014). Furthermore, Eddy (2014) commented that stress affects 32% of all senior level IT workers and 30% of entry-level to mid-level IT workers. Additionally, Thomas and Lankau (2009) posited that undesirable outcomes accompany stress and impacts job productivity and lowers job satisfaction which adversely influencing a person’s well-being, stress, personal anxiety, and energy loss (Chullen, 2014; Garg & Dhar, 2014; Hesselgreaves, & Scholarios, 2014; Jian, 2014). Morris and Venkatech (2010) suggested organizational change, workload, inadequate support, and lack of control in the workplace contributed to job stress. Further, Tork, Hamidi, and Heidary (2011) argued the lack of participation in decision-making resulted in stress that adversely affected the worker’s performance and affects overall performance in the organization. Researchers also found that the well-being of workers increased commitment that led to greater achievement of organizational goals (Chaudhuri & Naskar, 2014; Folami & Bline, 2012; Newton & Teo, 2014; Sadatsafavi, Walewski, & Shepley, 2015). Moreover, Folami, Asare, Kwesikga, and Bline (2014) explained that management’s responsibility is to create an organizational atmosphere that inspires comradery between workers and the organization. Cullen, Edwards, Casper, and Cue (2014) also suggested that when workers enjoyed vigorous support from supervisors, job satisfaction increases, and positive employee attitudes occur. Finally, Tork et al. (2011) argued that lack of decision-making ability resulted in stress that adversely affected worker performance, which influenced overall organizational performance.Concerning stress and LMX, Hesselgreaves and Scholarios (2014) found high-quality LMX produced positive job experience that reduced stress in workers. High-quality LMX increased job strain in senior staff members in five United Kingdom hospitals (Hesselgreaves & Scholarios, 2014). Further, Chullen (2014) suggested negative attitudes of supervisors created perceptions of LMX in workers. Researchers also discovered supervisors are the primary source of worker burnout (Chullen, 2014; Chung, 2014; Peng Schaubroeck, & Li, 2014, 2014). Jian (2014) suggested LMX quality has different relationships with role stressors. The ambiguity within the role of LMX showed a negative relationship between LMX quality and role ambiguity (Jian, 2014). Further, Jian (2014) found workers in decreased levels of LMX quality reported higher levels of role ambiguity, resulting in a higher level of stress and job turnover. Researchers also argued that supervisorial ambivalence created miscommunication, resulting in the increase of stress that decreased work performance (Cullen et al., 2014; Leroy, Palanski, & Simons, 2012). Furthermore, Prottas (2013) found behavioral integrity runs contrary to stress. Lawrence and Kacmar (2012) explained that LMX members enjoy less job stress as communication and information increased between them. According to Thomas and Lankau (2009), high-quality LMX supervisory and nonsupervisory mentors act as positive resources to reduce stress in workers through decreasing emotional exhaustion. Finally, Thomas and Landau (2009) also suggested nonsupervisory mentors produce a positive work-related conduit to improve social support and reduce stress in workers. Figure 1, contains some of the antecedents to stress, effects of stress, and undesirable outcomes that result.
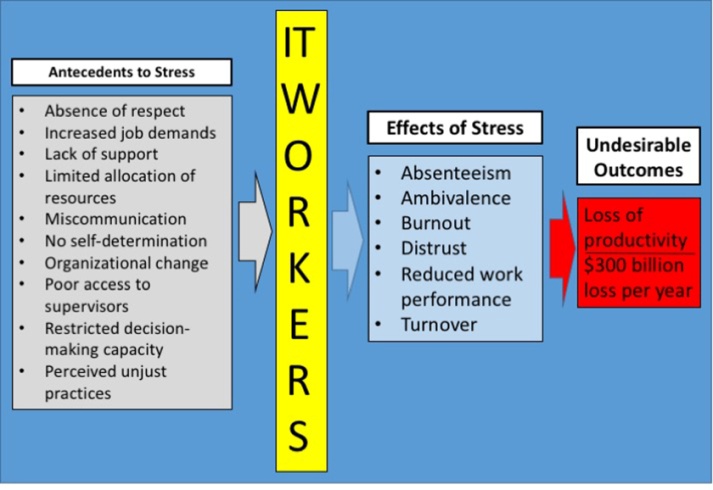 | Figure 1. Stress produces undesirable outcome that create loss of productivity. Antecedent behaviors directly influence the stress |
4. Methodology
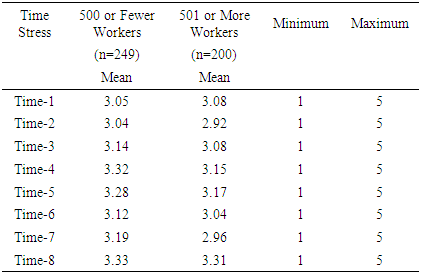
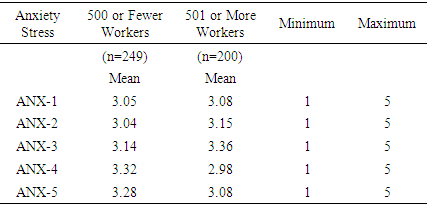
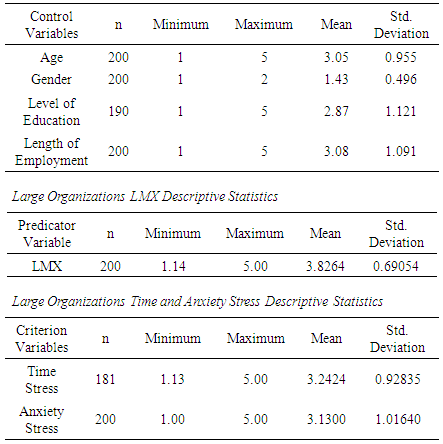
- A quantitative research methodology was the best choice to answer the research questions and test the hypotheses. Several recent studies regarding LMX included quantitative methodologies (Chullen, 2014; Geertshuis, Morrison, & Cooper-Thomas, 2015; Lawrence & Kacmar, 2012; Loi, Ngo, & Zhang, 2011; Martinaityte & Sacramento, 2013). Further, Leedy and Ormond (2010) explained that quantitative correlation design offers a non-obtrusive approach to identify significant relationships between variables (LMX and stress). Using descriptive and inferential statistics in quantitative research, an investigator relies on numerical data that facilitates the reliable interpretation of data (Leedy & Ormond, 2010). Due to numerical data, removal of a certain level of research bias occurs and data interpretation becomes more reliable (Cooper & Schindler, 2011; Leedy & Ormond, 2010).In the collection of data, we employed the LMX-7 and the job stress survey instruments. Grohmann and Kauffeld (2013) argued that a quantitative survey-based research approach is the most appropriate and cost-effective way to administer the survey to a large population. Due to the impossibility of direct behavioral observation of this large population, a 28-item survey instrument measured attitudes and behaviors of a sample population. Further, Grohmann and Kauffeld (2013) explained that conducting interviews and observing participant’s behavior are unrealistic and prohibitive. A correlational design was the most effective design for this study since it offered a non-obtrusive approach to identify significant relationships between variables (Leedy & Ormond, 2010). Employment of a descriptive correlational methodology enabled examination of a possible relationship between LMX leadership and stress among IT workers. The collected numerical data employing a survey of IT workers contained their opinions of LMX and attitudes toward stress. The data also included their personal characteristics of age, gender, level of education, and length of employment. The population was 84,000 IT workers in the Western United States with a sample population of 449 subjects. Further, to facilitated measurement of the control variables and rule out alternative explanations, the acquisition of the following data occurred: • Number of IT workers from IT organizations with 500 or fewer workers in the Western region of the United States was 249.• Number of IT workers from IT organizations with 501 or more workers in the Western region of the United States was 200.• Ages of the subjects were as follows: less than 21 years, 21-30 years, 31-40 years, 41-50 years, or 51 or older. • Gender—female or male • Level of education of the participant: high school (or equivalent), some college, associate’s degree, bachelor’s degree, master’s degree, doctoral degree, or other • Length of employment: less than one year, 1-5 years, 6-10 years, or 10-15 years, or 16 years or more. No attempt to control or manipulate the variables occurred. However, this research design allowed for the use of correlation statistics to describe and measure the degree of relationship between the two variables of LMX and stress (Leedy & Ormond, 2011). The two dimensions of stress measured were time stress (lack of time) and anxiety stress.The following research questions and hypotheses were at the center of the research.R1: What correlation, if any, exists between LMX quality and stress among workers within IT organizations in the Western region of the United States with 500 or fewer workers?H1: A correlation exists between LMX quality and stress among workers in IT organizations in the Western region of the United States with 500 or fewer workers.H0: A correlation does not exist between LMX quality and stress among workers in IT organizations in the Western region of the United States with 500 or fewer workers.R2: What correlation, if any, exists between LMX quality and stress among workers within IT organizations in the Western region of the United States with 501 or more workers?H2: A correlation exists between LMX quality and stress among workers within IT organizations in the Western region of the United States with 501 or more workers. H0: A correlation does not exist between LMX quality and stress among workers within IT organizations in the Western region of the United States with 501 or more workers. The control variables were age, gender, level of education, and length of employment. Large IT organizations with 501 or more workers and IT SMEs of 500 of fewer workers were also control variables. LMX was the predicator or independent variable, and stress was the criterion or dependent variable (Figure 2). The control variables were age, gender, level of education, and length of employment. Large IT organizations with 501 or more workers and IT SMEs of 500 or fewer workers were also control variables.The foundation of LMX theory is social exchange theory (SET), which includes a focus on the subjectivity of individual action, which affects the quality of relationships (Peng, Schaubroeck, & Li, 2014). As the quality of LMX relationships increases, employee organizational identity improves and turnover decreases (Harris et al., 2014; Stark & Jeffries, 2011). If LMX quality is high, workers view their jobs positively (Stark & Jeffries, 2011).
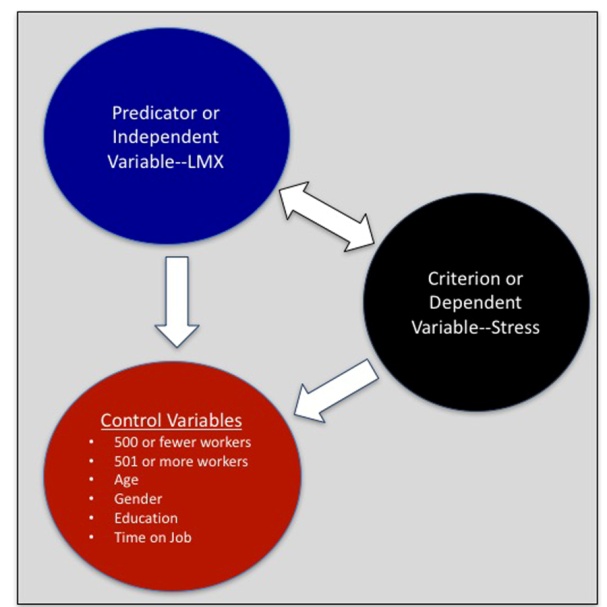 | Figure 2. Predicator, Control Variables, and Criterion Diagram pictures the interaction of the various variables in the research that were at the center of the research problem, research questions, and hypotheses |
5. Population and Sample Selection
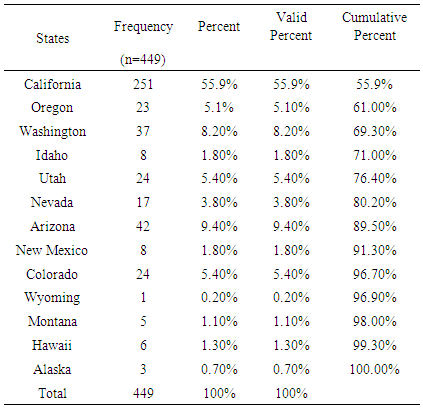
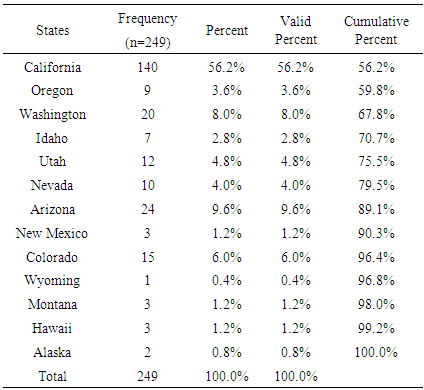
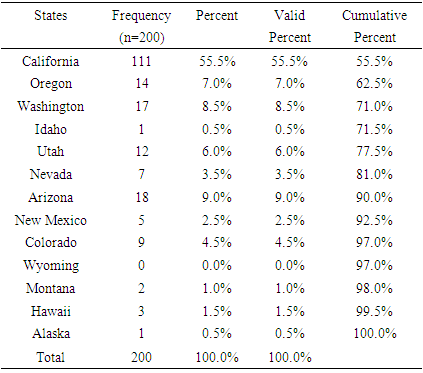
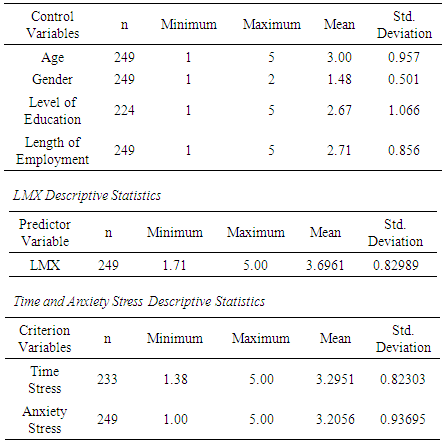
- The targeted audience was IT workers (N=84,000) from the Western region of the U.S. The sample population reached (n=449). A significant advantage of using a simple random sampling is that it allowed us to use statistical methods to analyze sample results. The Western region of the U.S. consisted of California, Oregon, Washington, Idaho, Utah, Nevada, Arizona, New Mexico, Colorado, Wyoming, Montana, Hawaii, and Alaska. In the 2012 U.S. Census, there were 3,136,025 million IT workers in the U.S. (Caruso, 2015). Roughly 861,800 U.S. workers are in IT SMEs with 500 or fewer workers. Nearly, 2,650,953 people were in IT organizations with 500 workers or more (Caruso, 2015). The Bureau of Labor Statistics (2014) reported 83,660 workers were in IT organizations within the Western region of the U.S. Therefore, the estimated target population size for this research was (N=84,000).It was determined that the original sample size was (n=383) and later grew to (n=449) after data collection. The confidence level was 95%, and the margin of error was 5%. The data collection included distribution of a self-administered internet-based LMX-7 and Parker and DeCotiis (1983) job stress survey. Workers of SMEs with 500 or fewer workers and workers in large IT organizations with 501 or more workers within the Western region of the U.S. received the survey. The data measured the existence of LMX quality and stress in IT workers. The survey comprised of LMX-7, job stress scale instruments, and demographic queries. To ensure anonymity, subjects received emails asking for their participation. Each participant received an email clarifying the study’s purpose and participation instructions. We invited qualified subjects to respond to the survey and continued to invite subjects until the sample size reached (n=449). This distribution of an internet-based survey allowed a greater access to the large target population (N=84,000). Parker and DeCotiis’s (1983) 13-item job stress scale measured anxiety stress and time stress in IT workers. Employing these 13 indicators, allowed us to examine stress using two dimensions. One dimension of the scale was time stress where a worker felt under constant pressure to produce; and the second dimension was the feelings of anxiety at work (Fields, 2002, p.132). According to Baba, Jamal, & Tourigny. (1998), the Parker and DeCotiis (1983), scale examined overall job stress, and the scale has good psychometric properties. The survey also facilitated demographic challenges by measurement of the following control variables: • Number of IT workers from IT organizations with 500 or fewer workers in the Western region of the U.S. was 249.• Number of IT workers from IT organizations with 501 or more workers in the Western region of the U.S. was 200.• Age of the participant is as follows: less than 21 years, 21-30 years, 31-40 years, 41-50 years, or 51 or older. • Gender—female or male. • Level of education of the participant: high school (or equivalent), some college, associate’s degree, bachelor’s degree, master’s degree, doctoral degree, or other. • Length of employment: less than one year, 1-5 years, 6-10 years, or 10-15 years, or 16 years or more. In the informational section of the survey, the respondents listed the State in which they worked. According to Cooper and Schindler (2011), internal validity exists when an instrument measures the research variables. In contrast, external validity exists when data is generalizable across time, people, and setting (Cooper & Schindler, 2011). The validity of this research focused on how well the survey instrument performed in measuring the variables in the study (Cozby & Bates, 2014). Graen and Uhl-Bien (1995) suggested that LMX-7 is the most appropriate and recommended measure of LMX. Researchers also concluded LMX-7 is more concise than previous instruments (Graen & Uhl-Bien, 1995). Scandura, Graen, and Novak, (1986) had significant interaction while measuring LMX p < .05, and the standard deviation was 2.58.The 13-item job-induced stress scale developed by Parker and DeCotiis (1983) measured stress levels in IT workers. The statistical information from Parker and DeCotiis (1983) initial research had standard deviations of .682 for time stress and .649 for anxiety stress. According to Baba et al. (1998), the Parker and DeCotiis (1983) scale examines overall job stress, having good psychometric properties. These 13-stress indicators measured stress employing two dimensions. The first dimension was time stress, which measures employee’s reactions under constant pressure (Fields, 2002). The second dimension is the feelings of job anxiety (Fields, 2002). Reliability is the degree to which instrument yields a consistent result, yet reliability is insufficient for validity (Cooper & Schindler 2011). Cronbach’s alpha is not a statistical test. However, it is a coefficient of reliability and consistency (Falk & Savalei, 2011). The scaling of the Cronbach’s alpha is from 0 to 1.0. Falk and Savalei (2011) noted that a 0.70 or greater Cronbach’s alpha suggests instrument reliability. Furthermore, Cronbach’s alpha measures the internal consistency of the Likert-scale formatted instrument.The LMX-7 instrument is the most often used survey in LMX research and reportedly has the highest reliability (Joseph, Newman, & Sin, 2011; Lawrence & Kacmar, 2012; Setley, Dion, & Miller, 2013). The reliability of any correlation study has two different sectors —internal consistency and external consistency (Neuman, 2003). The internal consistency examines how consistent the data collection was (Hesse-Biber & Leavy, 2005; MacKenzie, Podsakoff, Podaskoff, 2011). On the other hand, using external consistency, the researcher verifies the new data discovered and compare the findings within current research (Hesse-Biber & Leavy, 2005; Neuman, 2003). In previous studies, Cronbach’s alpha for LMX-7 was α = 0.89 to 0.90 (Lawrence & Kacmar, 2012). Further, Cronbach’s alpha for LMX-7 in the research of Graen and Unl-bien (1995) was consistently α = .80 to .90. Moreover, in a study conducted by Scandura et al., 1986, Cronbach’s alpha for LMX-7 was α =.86. On the other hand, Cronbach’s alpha for time and anxiety stress was α =.86 and .74 in Parker & Decotiis (1983) research. In other research, Cronbach’s alpha for the Parker and DeCotiis (1983) job stress instrument was 0.86 to 0.91 (Shabir, Abrar, Baig, & Javed, 2014; Wu & Shih, 2010). However, in this study, the LMX-7 instrument for IT SMEs was α = .78, and in large IT organizations, Cronbach’s alpha was α = .82 for LMX-7. In contrast, Cronbach’s alpha for time stress in IT SMEs was α =.90. However, in large IT organizations, Cronbach’s alpha was α = .92 for time stress. Further, Cronbach’s alpha for anxiety stress in IT SMEs was α =.87 compared to large IT organizations that was α = .88 for anxiety stress. All alpha scores suggested the LMX-7 and the Parker and DeCotiis (1983) job stress scale were reliable. The numerical and percentage breakdown of 449 workers who participated in the survey comprised two groups of IT workers. The first group of 249 workers (55.5%) was from IT SMEs. The second group of 200 workers (44.5%) came from large IT organizations.Subjects came from the States of California, Oregon, Washington, Idaho, Utah, Nevada, Arizona, New Mexico, Colorado, Wyoming, Montana, Hawaii, and Alaska. Table 1 contains the total number of subjects who participated. In Table 1, California had the highest respondent rate of 251 subjects or 55.9% of the total respondents (n=449). In contrast, Wyoming had the lowest respondent rate of one or 0.2% of (n=449).
|
|
|
|
|
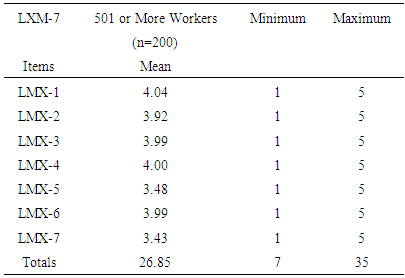
6. Results
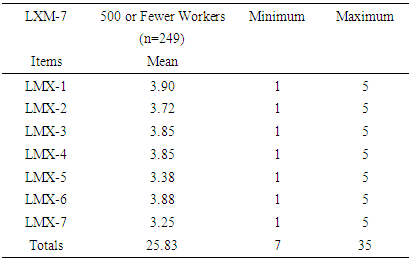
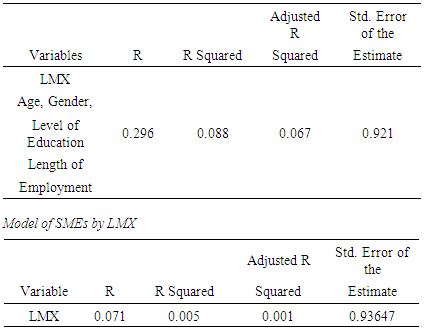
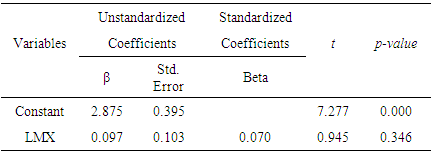
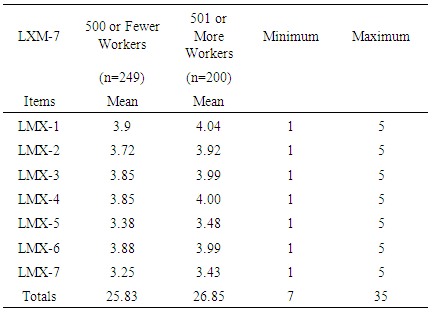
- R1: What correlation, if any, exists between LMX quality and stress among workers within IT organizations in the Western region of the U.S. with 500 or fewer workers?This research question guided the study in IT workers from SMEs. As a result, we employed LMX-7 instrument to measure the strength and quality of LMX relationships between the leader (supervisors) and the follower (subordinate). There were 249 IT workers from SMEs who participated. Table 6 contains the total LMX mean score of 25.83 for IT workers in SMEs with 500 or fewer workers. According to Graen and Uhl-Bien (1995), this mean score represents a high-quality LMX relationship.
|
|
|
|
|
|
|
|
|
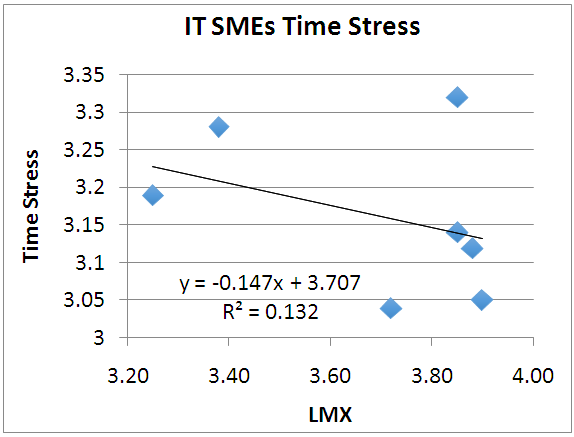 | Figure 3. Nonlinear relationship between LMX and Time Stress in SMEs suggests no linear correlation |
|
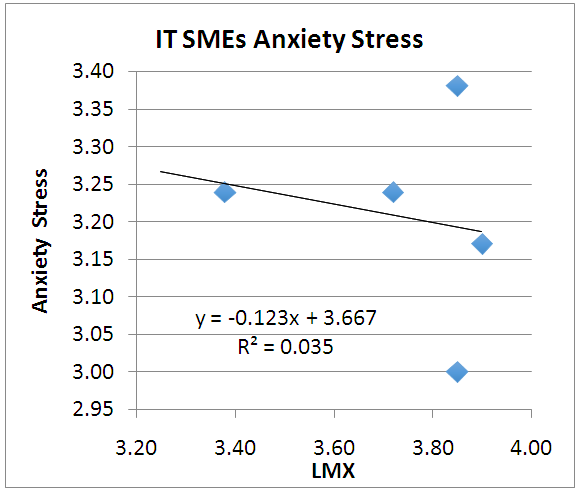 | Figure 4. The data indicated a non-linear relationship in SMEs between LMX and anxiety stress |
|
|
|
|
|
|
|
|
|
|
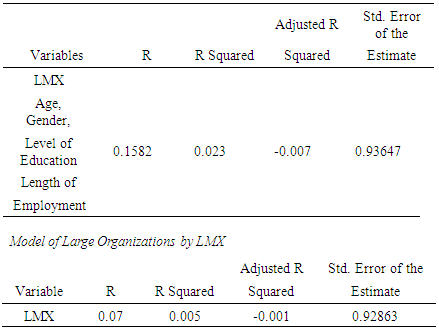
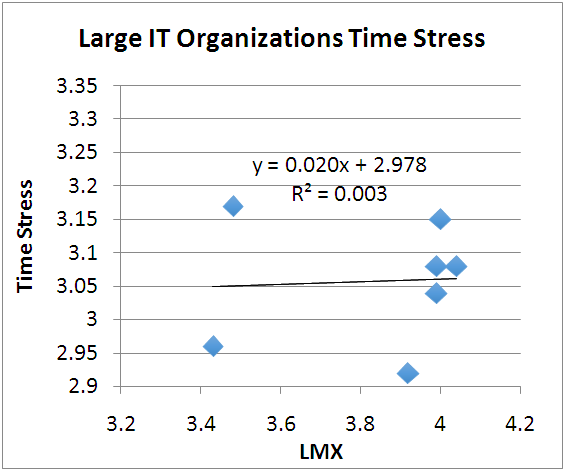 | Figure 5. The data indicated a nonlinear relationship between LMX and Time Stress |
|
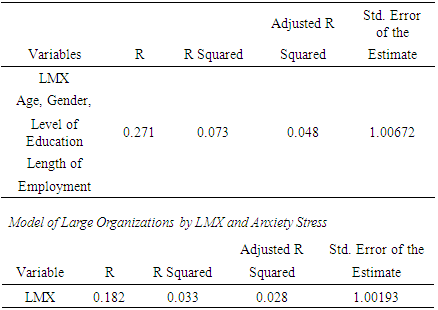
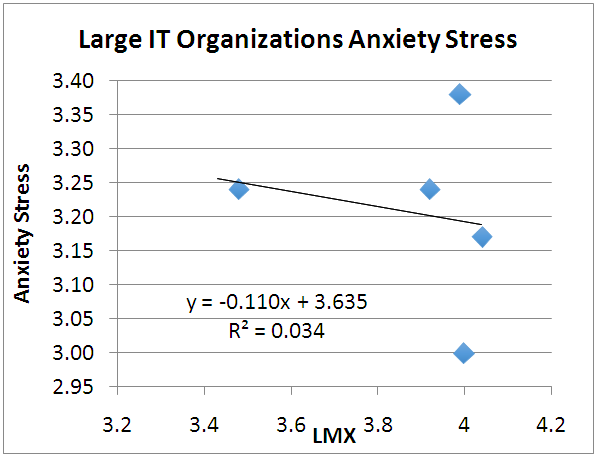 | Figure 6. There was no linear relationship in large IT organizations between LMX and anxiety stress |
|
|
 | Figure 7. LMX-7 Survey Results Comparison Graph illustrates the mean score per LMX item. As demonstrated in the survey, workers in larger IT organizations on an average scored higher in LMX quality than their counterparts in SMEs |
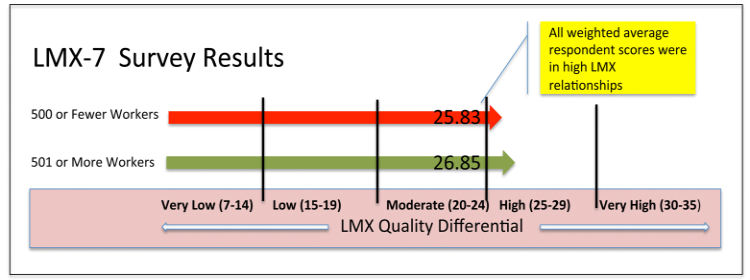 | Figure 8. LMX-7 Survey Results depicts both IT SMEs of 500 of fewer workers and large IT organizations with 501 or more workers enjoyed high LMX relationships. Further, large IT organizations scored slightly higher in the LMX index than did IT SMEs with 500 of fewer workers. We created this graph |
|
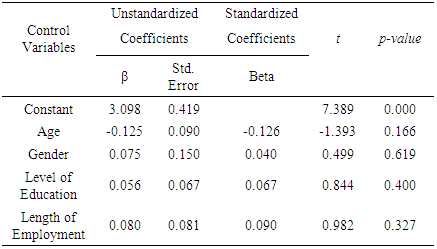
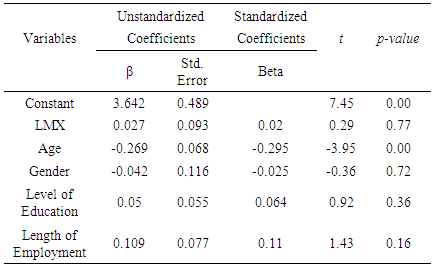
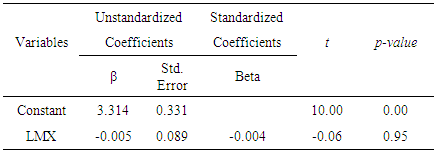
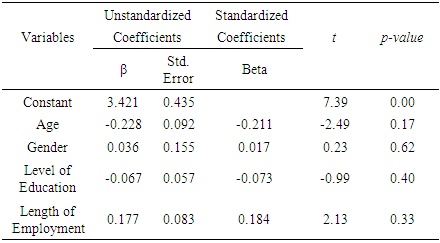
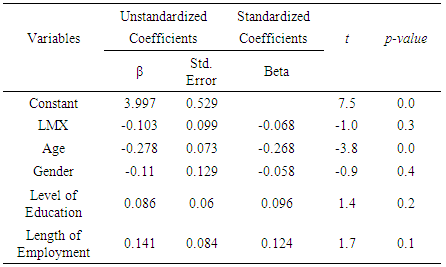
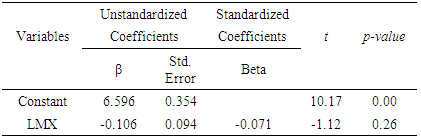
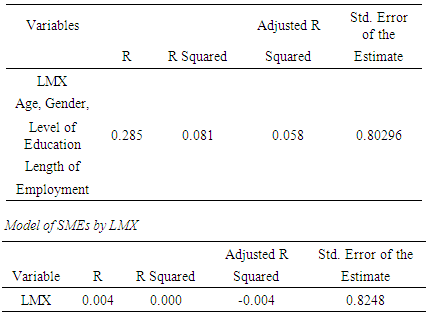
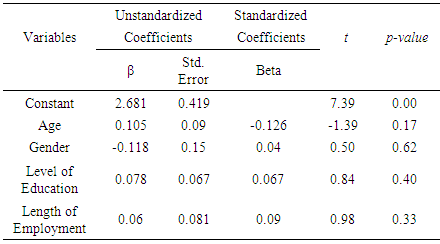
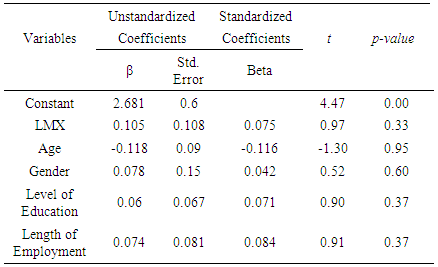
7. Summary
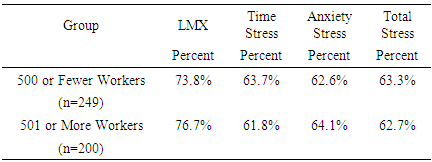
- In the Western region of the U.S., 63% of all IT workers identified with job stress. Time stress negatively affected 63.7% of IT workers in SMEs with 500 or fewer workers compared to 61.8% of IT workers from large IT organizations of 501 or more workers. Further, anxiety stress negatively influenced IT workers from SMEs (64.1%) more than IT workers (62.6%) of large IT organizations. Further, in large IT organizations of 501 or more workers, 76.7% of all surveyed subjects viewed their workplace relationships as high-quality LMX. In contrast, in IT SMEs with 500 or fewer workers, 73.8% of all subjects viewed their IT organizations as having high-quality LMX. The slightly higher LMX quality in large IT organizations might contribute to slightly lower stress levels than in SMEs that had lower LMX quality and higher stress levels in their IT workers. However, there was no correlation found between LMX quality and stress (time and anxiety) among IT workers within SMEs. Therefore, acceptance of the null hypothesis (H0) that declared that a correlation does not exist between LMX quality and stress in SMEs with 500 or fewer workers occurred. Moreover, the control variables of age, gender, level of education, and length of employment were not significant in predicting a correlation with the predictor (LMX) and criterion (stress) variables. In fact, there was also no correlations between these control variables and LMX and stress in IT SMEs.Likewise, there was no correlation between (time) stress and LMX among IT workers in large organizations. Therefore, acceptance of the null hypothesis (H0) suggesting no correlation exists between LMX quality and (time) stress in workers of large IT organizations resulted. In contrast, there was a correlation between (anxiety) stress and LMX in large IT organizations. Thus, acceptance of the alternative hypothesis that a correlation exists between LMX and (anxiety) stress (H2) resulted. Further, the control variables of age, gender, level of education, and length of employment had no correlation and were not significant factors that impacted independent variable (LMX) and the dependent variable (stress) in large IT organizations.In conclusion, there was no correlation between LMX quality and stress among IT workers in SMEs with 500 or fewer workers within the Western region of the U.S. Further, there was also no correlation between LMX quality and (time) stress among IT workers in large organizations of 501 or more workers in the Western region of the U.S. On the other hand, there was a correlation between LMX and (anxiety) stress in large IT organizations with 501 or more workers. Therefore, there was no evidence to reject the null hypothesis that there was no relationship between LMX and (time) stress. In contract, the acceptance of alternative hypothesis that stated that was a relationship between LMX and (anxiety) stress resulted.