Carsten Schäfer
Department of Business Administration and Management, University of Economics, Prague, 130 67,Czech Republic
Correspondence to: Carsten Schäfer, Department of Business Administration and Management, University of Economics, Prague, 130 67,Czech Republic.
| Email: |  |
Copyright © 2012 Scientific & Academic Publishing. All Rights Reserved.
Abstract
This research-paper examines how the beliefs of individuals influence their individual performance. In this context beliefs are subjective doctrines, or rather subjective opinions held by one or more individuals. These doctrines and opinions areclassified as either positive or negative. To measure the deviation of performance of individuals with differentbeliefs, a classroom experiment was conducted. The major finding was a highly significantly improved qualitative performance of 44 %, among individuals with positive beliefs. The findings of the paper imply several approaches for organizational management and psychological/behavioural economics.
Keywords:
Performance, Beliefs, Field-Study, Influence, Suggestion, Behavioural Economics, Economic Psychology
Cite this paper: Carsten Schäfer, How Individual Beliefs Impact Individual Performance, Human Resource Management Research, Vol. 3 No. 3, 2013, pp. 71-81. doi: 10.5923/j.hrmr.20130303.02.
1. Introduction
It’s all about beliefs. What does this statement mean? What are beliefs? What are the advantages or disadvantages of beliefs? These questions will all be answered in this paper. These situations are well known: we are faced with an important task that needs to be completed. It might simply be a shortlasting task such as an employment assessmentor an entrance examination. Or it could just as well be the solution to a problem within one’s (own) company that is essential for personal progress. A convincing performance has to be delivered in front ofa smaller or larger crowd. Instructors know this problem just as well as musicians, actors, freelancers, employees, professional athletes or managers do. The task may be part of a much greater sphere as well, such as a medium-term or long-term goal in life. Still, who or what determines individual performance in respective tasks or for personal goals or goals set by others? Why do results differ between people with supposedly the same skills? Why do some people achieve their goals effortlessly, while others have to struggle to reach them or even never achieve their goals? The answer to all these questions lies mostly within oneself. This saying is one of these beliefs. Beliefs are an individual’s doctrines, subjective opinions and solidly anchored convictions about her- or himself. These doctrinesand subjective opinions either negatively or positively influence actions, progress and performance. This idea applies to companies in regards to their quality management, just as much as to every individual personally. In contemporary economics and psychology, the subject of beliefs and performance has notbeen studied deeply yet.[1]discussed motivation and evaluations as ways to improveperformance in their article, ‟Effects of goal difficulty, goal setting-method and expected external evaluation on intrinsic motivation.” The subject of extrinsic and intrinsic monetary motivation was examined by[2]and[3] in their articles “Extrinsic and intrinsic motivation” and “Pay enough or don’t pay at all.”[4] discussed selective perceptions of individually preferred information, or rather, preferential reception of information that supports individual preferences in connection with cognitive dissonance. All these factors are largely exogenous. This article on the other hand will discuss endogenous factors (endogenous regarding the individual). These endogenous factors, known as beliefs, have not been extensively researched to date. The individual should not be affected by exogenous influences such as incentives or selective perception, but rather by their inner self. To achieve this, it is nevertheless necessary to initially suggest beliefs exogenously before they become part of the individual’s credo and therefore, an endogenous factor. The experiment explained below fills this gap. The extent to which subjective beliefs influence the performance of each individual will be researched. Each person is responsible for his or her own success, be it a top manager, a staff member or the company as a whole. It will become clear which factors shouldto be focused on more in order to activate the existing potential.
2. Theoretical Principles
2.1. Terminology
The following terms used in this articles and their definitions will be elaboratedon at the end of the text: beliefs in the framework of this article are subjective doctrines, or rather subjective opinions held by one or more individuals. Evaluation is the appraisal or evaluation of a performance. Evaluation can appraise a performance either ordinally or nominally. According to[5], confidence means the trust an individual has in her or hisown performance. Overconfidence describes an excessive, unjustified trust that an individual shows in her or his own performance. The individual overrates her- /himself. Low-powered incentives, or rather low-powered rewards are (in this experiment) rewards in the form of evaluation or feedback. The evaluation or feedback should be positive if possible. A low-powered reward differentiates itself from a monetary reward mostly by itscharacter.[2]discussed the term ‟low-powered reward.”[6]in their article Large Stakes and Big Mistakes introduced the term “choking under pressure” regarding rewards. This describes the situation where an individual starts to think a lot about the task. The reward entices them to complete the task particularly well but as a result, they cannot concentrate optimally during the time period in which the given task is to be completed.
2.2. Current Research Results
Recent research results in economics and psychology willbe examined below. The text will focus on findings in the fields of motivation, evaluation and confidence, or overconfidence (self-assessments or self-over assessments). As previously mentioned, no findings in the field of beliefs are known to the author to have been published. [1]discussed evaluation, the degree of difficulty of a task and intrinsic motivation in their article, ‟Effects of goal difficulty, goal setting-method and expected external evaluation on intrinsic motivation” . They assumed that there is a connection between evaluation and intrinsic motivation, or rather between the degree of difficulty of a task (in this article, it would correspond with positive or negative beliefs) and intrinsic motivation. An experiment was conducted where the subjects were required to assemble helicopter models. No relationship between evaluation and intrinsic motivation or degree of difficulty of a task and intrinsic motivation was found. Nevertheless,[1] determined that the performance was very high for difficult tasks, or for tasks which are difficult to complete. [2], in their article“Intrinsic and Extrinsic Motivation,” considered evaluation to bea low-powered reward or low-powered incentive (see terminology). An individual is basically interested in (if possible, positive) information about her-/himself. Evaluation as a reward therefore differs significantly from a monetary reward, which is not considered to be a low-powered reward.[2]drew upon the article ‟Intrinsic Motivation” (1975) by Deci. Unlike[1],[2] found that intrinsic motivation is positively influenced by evaluation or feedback. They justify this with the fact that an individual is more interested in receiving positive than negative information about her-/himself. In the context of rewards,[2] also found that under certain conditions, an individual may find a task with a high reward less attractive. The individual connects the high reward with a difficult task, which implies more effort for the individual. It can be deduced, therefore, that individuals generally avoid strenuous efforts. The authors postulate that rewards can provide a short-term incentive, but diminish motivation for the future. In their article,[2] also address the individual abilities of the individual. When an individual feels unsure about her/his own abilities, intrinsic motivation sinks with the increasing degree of the reward. This means the higher the reward is, the lower the individual’s intrinsic motivation is in this situation. Furthermore[1]agree with[7] when they found that a reward couldinspire an individual to complete a task solely for the reward. The task consequently tends to be exploited and lost its original meaning.[6]introduced the term “choking under pressure” regarding rewards in their article “Large Stakes and Big Mistakes,” which describes how a task can prompt an individual to think too much about thattask. The reward prods the individual to complete the task particularly well, but then, (s)hecan no longer concentrate optimally during the time period in which the task is to be completed. The individual begins to ask, ‟What will happen if I get a bad evaluation? What will they think of me?” As previously described, the individual wants to avoid negative information about her-/himself, or in this case, receive the large monetary award. This phenomenon of the exploitation of an assignment is what the authors call “choking under pressure.”[1]found that performancesof difficult tasks dropped significantly.[7]as well as[2] described how rewards that are too high can lead an individual to complete the task solely for the reward. The task is hence also exploited. In connection to the size of the reward,[3] nevertheless found in their article ‟Pay enough or don’t pay at all” that a too low monetary reward lowers the performance also. It therefore seems to be quite important that the optimal size of the reward is carefully considered. The reward should neither exploit the task ([6],[7],[2]), nor should it lower performance. A non-monetary reward in the form of feedback or evaluation (low-powered reward) seems to be appropriate in this situation ([2]).[5]looked at individuals’ self-assessments in their article ‟The Trouble with Overconfidence.” They found that on average, individuals rated their achievements too high for easier tasks. Furthermore,[5] found that on average, individuals rated their achievements too low for more difficult tasks. The tasks definedby[5] as simpleor difficult correlate with positive or negative beliefsin this paper.
2.3. Objectives of this Study
As already noted in Section 2.1, the effects of subjective beliefs on performance have not yet been studied in any detail, neither in the fields of (social) psychology nor in economics. The goal of this study is to provide a point of entry for research of in to thesecircumstances and to reveal possible effects. The theoretical principles described abovewill be used to compile variables and formulate hypotheses and secondary hypotheses. The main hypothesis states:Subjective beliefs influence individual’s performance.This means that positive subjective beliefs of an individual can positively influence their individual performance. For this purpose, a lecture hall experimentwas conducted. The test subjects were split into four groups and each person was given a task to be completed on paper.Additionally, this article will respond to secondary hypotheses regarding the collected variables. These variables are aligned with the publications presented in Section 2.1. The presented secondary hypotheses are as follows:•Evaluation and beliefs influence intrinsic motivation.•The average performance in a treatment with evaluation turns out worse in general.•Individuals assess their performance too high (low) compared to the average for easy tasks (difficult tasks).The variables examined within the framework of the experiment are gender, overconfidence and intrinsic motivation.
3. Experiment
3.1. Design of the Experiments
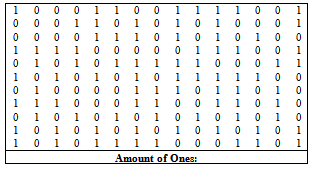
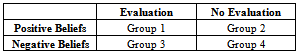
The following experiment will investigate the influence of positive beliefs (the test subject believes that the given task is particularly easy) and negative beliefs (the test subject believes that the given task is particularly difficult) on performance. The task to be completed is to determine the correct amount of ones inseveral tables with different amounts of zeroes and ones. All test subjects were given the identical assignment, although the cover sheets for the work sheets were prepared in four different versions. The test subjects were each given five minutes time to complete the task. A maximum of twenty tables could be completed.The test subjects were divided into four groups (see table 2 also):•Group 1: Positive beliefs, evaluation: the test subjects were given a worksheet that convinced them that the given tasks were easy and that there would be a random evaluation or feedback at the end. •Group 2: Positive beliefs, no evaluation: the test subjects were given a worksheet that convinced them that the given tasks were easy and that there would be no random evaluation or feedback at the end. No information regarding a possible evaluationwas provided. •Group 3: Negative beliefs, evaluation: the test subjects were given a worksheet that convinced them that the given tasks were difficult and that there would be a random evaluation or feedback at the end. •Group 4: Negative beliefs, no evaluation: the test subjects were given a worksheet that convinced them that the given tasks were difficult and that there would be no random evaluation or feedback at the end. No information regarding a possible evaluationwas provided.The following table is an example of the tables that were used within the framework of the experiment:Table 1. Example of table used in experiment[8]
 |
| |
|
The arrangement for the experiment is shown in the following table:Table 2. Arrangement for the Experiment
 |
| |
|
The influence that the results from the literature described in Section 2.1 had on the design of the experiment will be described in the following text.Evaluation was chosen as an incentive within the framework of the experiment, since it can be considered a ‟low-powered-incentive” ([9],[2]). The evaluation served as an incentive to participate in the experiment. This is not in conflict with the results of[1], who found in their article ‟Effects of goal difficulty, goal setting-method and expected external evaluation on intrinsic motivation” that evaluation does not have any effect on intrinsic motivation. In the present study, however, evaluation was intended to serve only as an incentive. This incentive pre-exists as the individual is interested in receiving (hopefully positive) information about her-/himself([9],[2]). Evaluation is therefore to be understood as the provider of extrinsic motivation. The time component is irrelevant in the following experiment, as the given task may only be completed once. The finding that the reward can provide a short-term incentive, but diminish motivation in the future ([2]) is irrelevant here. The test subjects for this experiment were given information about their individual abilities before the beginning of the experiment. They received the information as positive or negative beliefs. One half of the test subjects therefore believed that the task was very difficult, while the other half believe that the given task wasvery simple. This gave the test subjects information about their individual abilities regarding the tasks. The negative correlation between intrinsic motivation and the size of the reward for existing insecurity of the individuals regarding their own abilities described by[2] should have had no effect in this case.[2]as well as[7] also found that a reward can induce an individual to complete a task solely for the reward. To ensure that the test subjects stayed focused on the task during the experiment, no monetary or other kinds of rewards were offered. The ‟low-powered reward” as described by[2] was used instead.[6]introduced the term ‟choking under pressure.” ‟Choking under pressure” occurs when an individual thinks too much about the task to be completed. The individual wishes to complete the task successfully because of the reward. In this experiment, the test subjects in the treatments with evaluation were able to ask the following questions: ‟What will happen if I am evaluated badly? What will people think of me?”. The individual wants to avoid negative information about her- or himself. This may cause the ‟choking under pressure” as described by[6]. If ‟choking under pressure” does occur, it had to be accepted, as there was no way to avoid it in this experiment. According to[3], performance is diminished if the monetary reward is too low. For this reason, a non-monetary reward was chosen for this experiment.
3.2. Summary
Evaluation in this experiment (in groups one and three) was intended to strengthen the commitmentin the experiment. The evaluations or feedback were implemented as a ‟low-powered reward” ([9],[2]). The ‟low-powered reward” kept the individuals focused on the task. The task was thus not exploited ([6]). Evaluation and feedback were used as an external incentive. In order to limit choking under pressure, only evaluation was as an incentive in groups one and three. In groups two and four, however, no evaluation was communicated to prevent possible choking under pressure. In this manner, the influence of beliefs on the performance in the described arrangement can be optimally determined.
3.3. Compiled Variables
Within the framework of the experiment, the following variables were compiled based on the results described in Section 2.1: 1.Gender (exogenous variable) 2.Overconfidence (endogenous variable)3.Intrinsic motivation (endogenous variable)
3.4. Task within the framework of the experiment
The tasks shown in this experimentrequire a combination of diligence, quantitative as well as qualitative abilities and intuition. However, diligence as well as quantitative and qualitative abilities areprimary, as the influence of subjective beliefs on performance is intended to be as undistorted as possible. The results are not intended to be influenced by different individual mathematical and or other abilities. Nevertheless, a pure diligence task in connection with suggested beliefs would not becompletely valid. The task most suited for approaching the above mentioned delineations seemed to be the one described in Section 3.1. The task used within the framework of the experiment consisted of determining the number of ones from 20 tables with differentamounts of zeroes and ones.
4. Hypotheses
4.1. Hypothesis A
Hypothesis A is the main hypothesis and was the actual goal of the experiment. Because of results described in literature and the supposition of the influence of qualitative beliefs on performance, the following results of the experiment regarding performance are assumed:Performance group 1 >performance group 2 Performance group 3 >performance group 4This result tends to refute the explanations of[1] and implies that negative beliefs (the test subject believes that the given task is especially difficult) have a negative influence on performance. Accordingly, positive beliefs (the test subject believes that the given task is especially easy) should have a positive influence on the individual and the collective performance. The relationship regarding performance between groups 3 and 4 is unclear. Clarificationconcerning how much the evaluation influenced the performance within the given arrangement, or rather, how much choking under pressure ([6]) occurred is necessary in this case. This question will be considered in hypothesis C. Hypothesis A is:Subjective beliefs influence individual´s performance. The performance of group 1 is higher than the performance of group 2. In addition, the performance of group 3 is higher than the performance of group 4.
4.2. Hypothesis B
Hypothesis B is a secondary hypothesis based on the compiled variables. According to[1], evaluation and the degree of difficulty of a given task (in this experiment, positive or negative beliefs) have no influence on intrinsic motivation. Within the framework of this experiment, it needs to be clarified whether evaluation and beliefs have an influence on intrinsic motivation. For the time being, it was assumed that this is the case within the framework of hypothesis B. hypothesis B is as follows: Evaluation and beliefs influence intrinsic motivation.
4.3. Hypothesis C
Hypothesis C is also a secondary hypothesis based on the compiled variables. Evaluation was an external incentive in the form of low-powered rewards ([9],[2]). There is the possibility, however, that they nevertheless elicited the above-cited choking under pressure ([6]). Hypothesis C assumes that the average performance in the treatment with evaluation is generally poorer. Hypothesis C states: The average performance in the treatment with evaluation is generally poorer.
4.4. Hypothesis D
[5]postulated that for easy tasks (here positive beliefs), individuals overrate their abilities in comparison to their average performance. At the same time, for difficult tasks, individuals underrate their abilities in comparison to their average abilities. Hypothesis D is based on this finding. Hypothesis D will be verified based on the compiled variable overconfidence. Hypothesis D states: Individuals assess their abilities too high (low) for easy tasks (difficult tasks) in comparison to their average abilities.
5. Analysis
5.1. Data record and empirical analysis
206 people participated in the experiment. The group distribution within the room during the experiment is shown in the following image.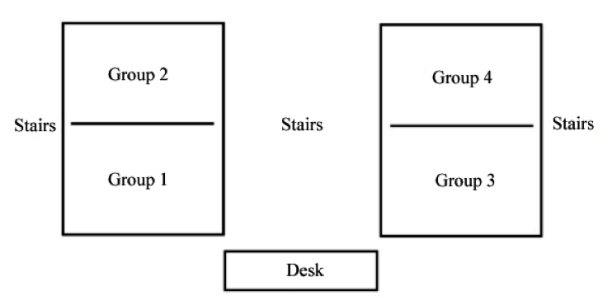 | Figure 1. Group distribution within the room during the experiment |
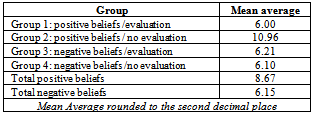
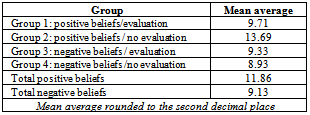
The test subject distribution among groups one through four was as follows: Group 1: 42 participantsGroup 2: 49 participantsGroup 3: 57 participantsGroup 4: 58 participants45% percent of the participants were male and 55% were female.The following analysis refers to the tables that were completed correctly by every test subject, henceforth to be called performance. This variable appears to be the most meaningful one, as the number of completed, but not necessarily correctly completed, tables by every test subject is more susceptible to distortion. A test subject could, for example, have randomly entered their results and in that way, completed twenty tables. Analyses were nevertheless carried out indifferent places for the ‟completed, but not necessarily correctly completed tables” variable as well, henceforth called quantity. This allowed a differentiation between quality, or rather, performance, and quantity. Analyses of the quotients of performance and quantity showed no statistically useful results. The following results were shown on average (average performance):Table 3. Average Performance, sorted by groups and beliefs
 |
| |
|
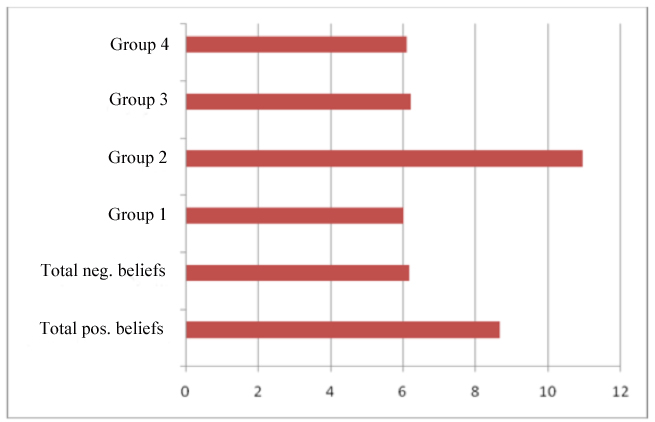 | Figure 2. Distribution of performance, sorted by groups and beliefs |
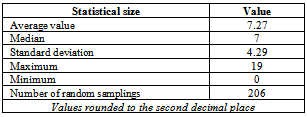
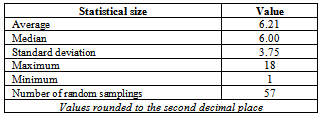
It is clear that in the positive beliefs treatment yielded a better average performance than the negative beliefs treatment. The difference is 2.46 correctly completed tables. This indicates an improved performance of 29.07% compared to the treatment of negative beliefs. The difference is even greater when the evaluation criterion during the assessment is considered further. No notable difference was recognized between groups one, three and four. Group two was not evaluated and held positive beliefs. This group achieved an average performance of 10.96 correctly completed tables. Compared to group four, which was also not evaluated but held negative beliefs, the performance improved by 44.34%. Choking under pressure ([6]) is strongly suspected to have occurred in connection with the evaluation in the conducted experiment. The dreaded evaluation may have exploited the task and hence, negatively influenced the performance. Positive beliefs resulted in a performance improvement of 44.34%.The average performance of all groups was 7.27 correctly completed tables. The median was seven correctly completed tables. There were a minimum of 0 and a maximum of 19 correctly completed tables. The standard deviation was 4.49 (Table 4).Table 4. Average Performance of All Test Subjects
 |
| |
|
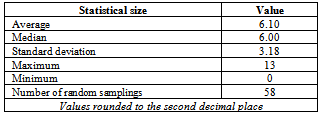
The additional analyses regarding the performance of groups one through four showed the following results: Table 5. Average performance group one
 |
| |
|
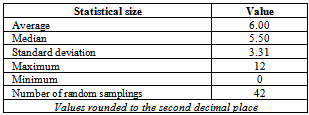
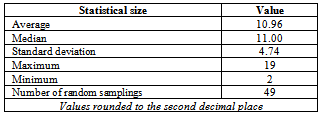
Table 6. Average performance group two
 |
| |
|
Table 7. Average performance group three
 |
| |
|
Table 8. Average performance group four
 |
| |
|
Descriptive analyses of the average quantity, as described above (‟completed tables” as opposed to ‟correctly completed tables”), are as follows: Table 9. Average quantity, sorted according to groups and beliefs
 |
| |
|
Performance abilities between the treatments of positive beliefs and negative beliefs also differed for the quantity variable. The difference consists of 2.73 completed tables, which translates into a quantitative difference in performance of 23.02%. If the results are differentiated according to the evaluation criterion (treatment of no evaluation), the quantitative difference in performance is 4.76 completed tables. This translates into a performance increaseof 34.77%. Hence, positive beliefs seem to affect the qualitative field more strongly than the quantitative field. The performance improved by 44.34%. Quantity and performance generally seemed to correlate positively (p < 0.01 according to Pearson): Test subjects that processed many table also completed many tables correctly.
5.2. Inductive Analysis
5.2.1. Hypothesis A
Median TestHypothesis A will first be examined on the basis of a median test. The median test is a nonparametric statistical method for comparing several location parameters. The test will determine whether two or more independent groups distinguish themselves in terms of their central tendencies. The median test describes the probability that two or more independent groups (that do not necessarily have the same composition) come from populations with the same medians. The null hypothesis states that the groups were made up of populations with the same median ([10]).It was shown that the difference in performance among the specific groups is highly significant (Table 10).Table 10. Median Test - Hypothesis A – Performance
 |
| |
|
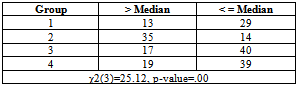
The median test shows a significant difference between Groups one through four (χ2(3)=25.12, p=.00). This means that at least one of the four groups must distinguish itself significantly in its performance from the other groups. Thirteen observations were above the median in groupone, while 29 were under the median. In grouptwo, 35 observations were above the median, and 14 were under it. In groups three and four 17 and 19 observations were below the median, respectively, and 40 and 39 observations above the median, respectively. 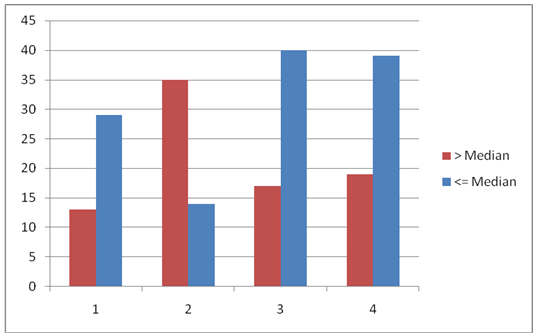 | Figure 3. Median test |
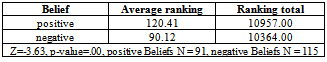
Based on the median tests, it was found that the groups differ significantly in their location parameter. The manner in which the groups differ can be determined using an empirical analysis (Section 5.1). The following figure displays the results of the median test graphically:Mann-Whitney U TestThe Mann-Whitney U Test determines whether two independent random samplings come from the same population ([10]). A comparison between two random samplings can be made regarding the location parameter of a dependent variable (Performance).Table 11. Mann-Whitney U Test – Hypothesis A - Performance
 |
| |
|
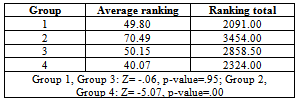
The Mann-Whitney U Test also shows a significant difference between groups one through four regarding performance (Z=-3.63, p-value=.00).The Mann-Whitney U Test, broken down by evaluation criteria, also shows that beliefs have a significant influence on performance. It is also evident that performance is influenced by evaluation.Table 12. Mann-Whitney U Test - Hypothesis A – Performance according to Evaluation
 |
| |
|
In groups one and four, those with no evaluation, there is a significant difference in performance (Z= -5.07, p-value=.00).Groups one and three, those with an evaluation, did not show a significant difference in performance Z= -.06, p-value= .95). The results from section 5.1 were therefore confirmed. Inductive analyses of the average quantity as described above, (‟completed table”, not ‟correctly completed table”) are as follows:Table 13. Mann-Whitney U Test – Hypothesis A - Quantity
 |
| |
|
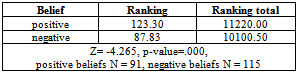
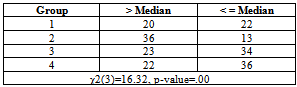
The Mann-Whitney-U Test regarding quantity also shows a highly significant difference between the positive and negative beliefs treatments (Z= -4.27, p-value=.00). The median test regarding quantity demonstrated a significant difference between groups one through four (χ2(3)=16.32, p=.00; see Table 14).Table 14. Median Test - Hypothesis A - Quantity
 |
| |
|
ANOVA – UnivariateAnalysis of varianceIn order to show the two-factor test set-up (see section 3.1) and to determine more closely the observed reciprocity in the median test and the U test, a two factorialunivariate analysis of variance (ANOVA) was conducted. The ANOVA examines the influence of one or more independent variables on a dependent variable ([11]). Multiple averages for a dependent variable were examined and main effects (beliefs, evaluations), as well as interaction effects (Belief x Evaluation) were considered. Table 15. ANOVA – Hypothesis A - Performance
 |
| |
|
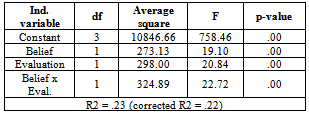
It is clearly recognizable that the averages in groups one and three differ significantly (p-value = .00). The interaction effect of beliefs and evaluation (‟Beliefs x Evaluation” variable) is also highly significant (p-value = .00). Also according to ANOVA, at least one average in groups one through four must differ significantly from the other averages. The following imageillustrats this: 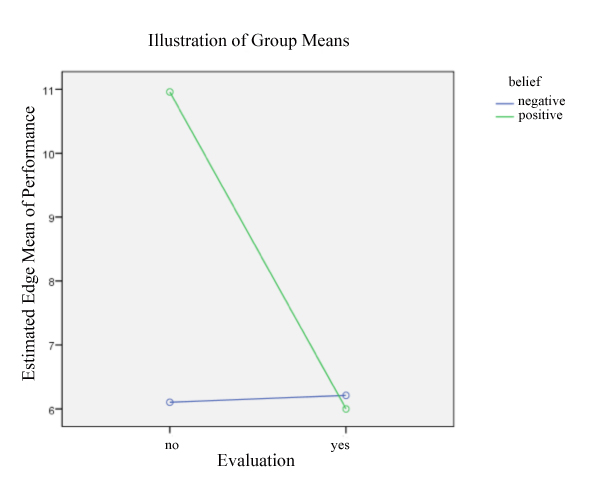 | Figure 4. Univariate Analysis of Variance–ANOVA- independent variable: Performance |
The imageabove clearly shows that group 2 achieved the highest performance (positive beliefs, no evaluation). The following is an ANOVA regarding the average quantity, as described above:Table 16. ANOVA – Hypothesis A - Quantity
 |
| |
|
Regarding quantity, it is clearly recognizable that the averages in groups one and three differ significantly as well (p-value = .00). The interaction effect of beliefs and evaluation (‟Beliefs x Evaluation” variable) is also highly significant (p-value = .00).
5.2.2. Hypothesis B
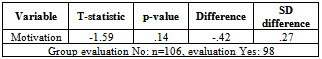
Hypothesis B was tested for independent random samplings with a t-test. The t-test tested the averages of two random samplings for significant differences ([11]).Table 17. T-Test - Hypothesis B – for all groups
 |
| |
|
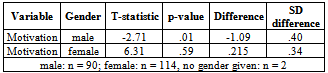
No significant influence of evaluation on intrinsic motivation could be determined. The results of[1] were therefore confirmed in this experiment (T= -1.59, p= .14). Hypothesis B could not be confirmed regarding the evaluation. The arrangement where no evaluation was mentioned had a higher average motivation value than the arrangement where evaluations were mentioned (averages = 3.59 to 3.53). Nevertheless this difference is not significant.When a t-test sorted by gender of the test subjects is conducted, however, a significant influence of evaluation on motivation is seen (p-value = .01). Table 18. T-Test – Hypothesis B – sorted by gender
 |
| |
|
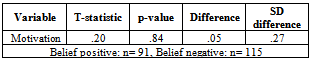
Male test subjects seemed to be influenced by evaluation regarding their motivation. This finding in the experiment was not observed among women. When testing the influence of beliefs on intrinsic motivation, the following results were found: Table 19. T-Test - Hypothesis B – for all groups
 |
| |
|
There is no significant influence of beliefs on motivation (p-value = .84). Regarding beliefs hypothesis B could not be confirmedeither. Calculations that included the gender factor did not reveal significant results (male: p-value = .66, female: p-value = .81).
5.2.3. Hypothesis C
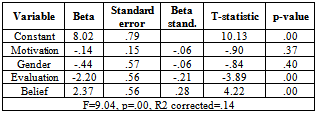
As already described in section 4.2.1, evaluation influenced average performance rather negatively. To examine this fact further, a linear regression analysis that includes all other collected independent variables was conducted here.Unlike the correlation calculation that simply determines the strength of the relationship between two variables, regression analyses serve to reveal the type of relationship. In the process, the value of a dependent variable is then to be predicted precisely, based on several independent variables ([11]). The linear regression equation for this experiment is as follows: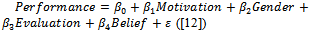 The achieved performance in turn forms the dependent variable. Intrinsic motivation, gender, evaluation and belief incorporate the independent variables. Beta 0 through beta 4 represent the influence of the respective independent variables on the dependent variable. Beta ranges between zero and one. Epsilon represents the existing error term. The result of the linear regression analysis was as follows:
 Table 20. Linear Regression Analysis– Hypothesis C - Performance
 |
| |
|
As shown in the table above, the variables evaluation and belief have a highly significant influence on the dependent variableperformance (p-value= .00). This finding corresponds with the previously found results and effects. Intrinsic motivation (p-value = .37) and the gender of the test subject (p-value = .40) do not influence the performance strongly or significantly.A strongly significant influence of (positive) beliefs on the achieved performance can be identified. According to the regression analysis conducted here, test subjects with positive beliefs correctly complete 2.37tables moreon average than test subjects with negative beliefs (β = 2.37). In hypothesis A a highly significant influence of beliefs on performance wasalready found. The findings of this experiment regarding evaluation were confirmed here. Test subjects who were to be evaluated correctly completed 2.20 tables less on average (β = 2.20, once again according to the regression analysis conducted here). Hypothesis C is therefore confirmed. Nevertheless, the here underlying moderate model adjustment (R2 = .15, R2 corrected=.14) must be considered when interpreting these results. Figure 5 graphically shows the regression model and its errors of estimation.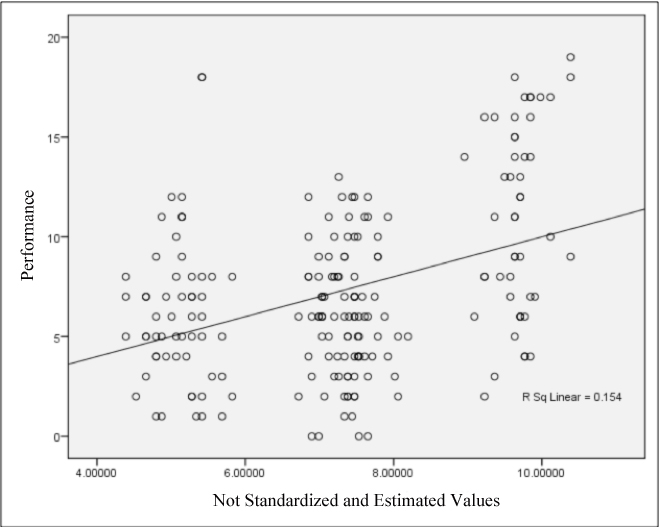 | Figure 5. Scatter Diagram of the Linear Regression Analysis–Performance |
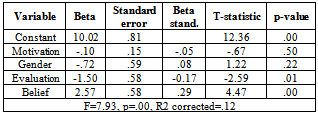
The following is a linear regression analysis using the dependent variable quantity, as described above (‟completed tables”, not ‟correctly completed tables”):Table 21. Linear Regression Analysis – Hypothesis C - Quantity
 |
| |
|
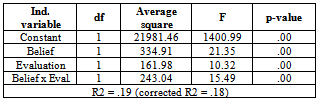
As shown in Table 21, not only was the performance influenced significantly, but the quantity of the variables evaluation (p-value = .01) and belief (p-value = .00) and the constant variables of the models, were as well. The intrinsic motivation (p-value = .50) and the gender of the test subjects (p-value = .22) did not significantly influence the performance. Also in regards to quantity, a highlysignificant influence of beliefs on the dependent variable‟completed tables” was noted. Test subjects with positive beliefs completed 2.57 more tables on average in this regression analysis than the test subjects with negative beliefs (β = 2.57).The results regarding the evaluation concur with the results of the dependent variable performance: evaluated test subjects completed 1.50 fewer tables (β=1.50)on average.However, regarding the quantity, the underlying moderate model adjustment R2must be considered (R2 = .14, R2 corrected= .12).
5.2.4. Hypothesis D
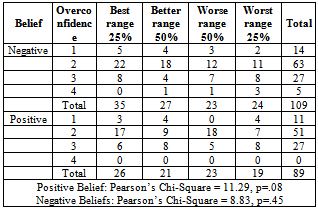
Hypothesis D was tested using the following cross-classified table:Table 22. Cross-Classified Table – Overconfidence x Performance Categories
 |
| |
|
The above-presented cross-classified table is to be interpreted in the following manner:In the field of positive beliefs, eleven test subjects ranked their abilities to be within the top25%. In fact the abilities of three of the eleven test subjects were assessed correctly. 51 test subjects ranked their abilities to be in the better 50%. Only 17 of these 51 people actually performed in the way they had ranked themselves. In the field of positive beliefs, none of the test subjects ranked themselves to be in the worst 25%. This distribution leads to the premonition that the ‟overconfidence”[5] phenomenon did in fact arise here. Individuals with simple tasks or positive beliefs seemed to rank their abilities too wellin relation to the average. However, the chi-squared test showed a level of significance of only .08 (p-value= .08) in the field of positive beliefs. The hypothesis is therefore significant to a level of p= .10 only. The field of negative beliefs shows a different picture. Estimations of the performance levels compared to the average performance are generally worse than those in the area of positive beliefs. Five test subjects rated their abilities in the worst area. 14 ranked themselves in the upper half of all test subjects. The chi-squared test confirmed this finding. A level of significance of only .45 (p-value = .45) was reached. The finding is thus not significant.Hypothesis D stated that individuals ranked their own abilities in easy tasks or with positive beliefs too well compared to the average. Individuals rank their own abilities in difficult tasks or with negative beliefs too low compared to the average ([5]). This hypothesis was only partially confirmed in the experiment performed here.
6. Conclusions
This study examined to what extent subjective opinions, known as beliefs, significantly influence individual´s performance. The paper starts with the thoughtthat beliefs have the power to influence everyone. This thoughtis in turn an opinion, a belief. The intent was to look at this opinion more closely. If this opinion could be confirmed, it would be important for all circumstances. In economics, these results could be particularly useful for business coaching, but also for positively influencing the abilities of all individuals within an organization. For this reason, an experiment with a total of 206 participants was conducted. The task was to determine the correct amountof ones in 20 tables consisting of differing amounts of ones and zeroes. The performance was rated based on the number of correctly completed tables. The quantity, meaning the number of completed tables (not ‟correctly completed tables”), was also considered. Preliminary review of the data had already determined that the performance of people in the group with positive beliefs differed greatly from the performance of the people in the group with negative beliefs. Several statistical tests (t-Test, Mann-Whitney U Test, Median Test, ANOVA, Regression Analysis) revealed that these differences in performance are highly significant (p-value =.00). A difference in abilities regarding performance of approximately 45% was determined. The difference in performance regarding quantity (‟completed tables”, not ‟correctly completed tables”, see above) was approximately 35%. Positive beliefs therefore had a stronger influence on performance than on quantity. However, these differences arose in the setting of ‟No Evaluation” and in the ‟Evaluation” setting, the difference was less clear. Beliefs therefore influence individual abilities very strongly. This influence is highly significant. This finding conflicts with the findings of[1], who found that when the test subjects were given difficult tasks, the performance was especially high. The fact that the time allowed for the shown beliefs to affect the test subjects was very short mustto be considered here. Only one single sentence was given: “This task is very difficult to complete” or “This task is very easy to complete”. What kind of results would have occurred if therehad been even more time to consider this thought? What increase in ability could be observed over a longer period of time – a year, ten years, an entire lifetime? What would a person with positive beliefs have achieved by the end of their life, and what would a person with negative beliefs have achieved? An intellectual challenge or the quality of a solution to a task does not depend necessarily and solely on the individual´s professional abilities. It depends much more strongly and thoroughly on the individual´s mental abilities. For now, it is therefore important to beaware of one’s own mental abilities and internalize one´s own positive beliefs, as these directly affectthe thoughts and mental models of the individual. Mental models and beliefs furthermore directlyaffect the actions of the individual, as individualsactaccording to their opinions and value beliefs. The more deeply an individual is convinced of a belief, the stronger his/heractionsare influenced by it. This experiment used persuasion to simulate an individual’s belief. Long-term, however, it is not persuasion, but rather the endogenous beliefs of the individual that are important. Unlike beliefs, evaluation seemed to influence a performance negatively in this experiment. Not only was the performance influenced negatively here, but the effect of the belief was also undermined. Evaluation seemed not to actas an ability-strengthening element in this experiment. As shown, an individual should not let her-/himselfbe distracted from the task by evaluation, but should rather focus on her/his positive beliefs. In this way, the ‟choking under pressure” phenomenon ([6]) can be avoided. Choking under pressure occurred in this experiment and made it clear that evaluation (in this experiment) negatively influences performance. The findings of[6], where an evaluation was found to have no influence on intrinsic motivation, were confirmed in this experiment. The difficulty of the task (positive beliefs versus negative beliefs) did not influence intrinsic motivation in this experiment either. This also corresponds with the results of[1], published in their essay entitled ‟Effects of goal difficulty, goal setting-method and expected external evaluation on intrinsic motivation.” In both cases (group 1 and group 3), the fact that intrinsic motivation was provided through self-assessment by the test subjects themselves mustto be considered. The results are less significant than the results regarding performance (Hypothesis A).In the context ofthe economy and the positive influence of performance on an organization and on the individual within an organization, the given results imply that it is usefulto integrate the belief factor into coaching sessions. Coaching should not merely feature elements such as evaluation and monetary incentives without consideration of inner persuasions. Coaching sessions should rather consider endogenous factors (beliefs) as well. A coaching session based on beliefs can, in its entirety, be used in an organization. The results described here are valid for top management as well as for all other hierarchy levels within an organization. An understanding of mental models and beliefs can also help to significantly improve performance. It is important that the individual is “programmed for success.” That does not mean manipulating the individualunder any circumstances. Rather, the point is to show the individual how to use their beliefs in a purposeful manner. In this experiment, the suggestion of positive or negative beliefs served solely to simulate the doctrines or the beliefs of the individual. An individual’s positive beliefs ultimately lead to an effective and efficient (better) prevailing mood within an organization. It is important to show the individual how (s)he can use their positive beliefs effectively. The following five steps can therefore form the basis for a coaching session:1. Identify desirable outcomes, define goals. 2. Develop beliefs that support achieving these goals. 3. Act according to the formed beliefs and so, act in a targeted manner.4. Iterative observation of the beliefs to determine whether they are optimally focused on the desired goals. 5. Observe and if necessary, adjust own beliefs ([13], [14]).If an individual wants to achieve a certain goal, he or she should create a “mindset,” which represents the desired results of her/his individual actions. A belief is nothing more than a set or suggested thought pattern that the individual assumes is reality. Therefore, when the individual assumes that ‟this task is difficult”, the belief leads to the corresponding result. This interpretation forms the behaviour of the individual. Whether new assets or new customers are to be gained, or simply leaving the office at 5p. m., the individual’s beliefs influence her/hisbehaviour. The result is that the individual’s beliefs form his/herresults. Henry Ford described this in his famous quote, “If you think you can do a thing or can’t do a thing, you’re right.” An individual will not investmuch energy for a goal that (s)hethink is unattainable, which means that the (s)he will not achieve that goal. Simply honing one’s skills does not suffice. It is important to train beliefs to support the efforts of many large companies that are based on behaviour-based training and monetary incentives. Positive beliefs, as shown here, can lead to better results. Most dictionaries describe a doctrine as the belief that certain things are true. Therefore, it is important that individual beliefs reflect and support the desired performance. Beliefs and mental models are subtle, but powerful. They are subtle because the individual is usually not aware of their effect. They are powerful because they determine where the individual’s attention, and therefore their actions, is focused. Mental models and beliefs are also strict and conservative because they trigger an individual to see what they have always seen: the same needs, opportunities and results. This explains why an individual sees what her/his beliefs allow her/him to see; they are only able to do what their beliefs allow her/him to do. How should an individual comport her-/himself? What activities allow an individual to develop her-/himself? What output should be achieved and what standards determine effectiveness? Since the mental models condition the well-tested way of thinking and course of action of an individual or a collective, an organization must reconsider, review and analyse their beliefs. Which beliefs hinder an organization and which beliefsare the cornerstone of the organization can be determined ([13],[14]).Beliefs areconspicuous in readings or in comparisons ofbiographies of successful figures as well: they direct the necessary positive beliefs and are prepared to act accordingly. These people identify with their tasks. Their beliefs are after all anchored within their performance. Psychologists call this total concentration and the “absorption in an activity in a relaxed manner” a state of flow ([15]). It is not enough to start off from a binary thought pattern (positive versus negative beliefs), as was shown in the described experiment. Rather, it is much more important to develop an holistic thought pattern or a belief system. Optimally, this belief system is oriented toward individual goals. It is of considerable economic value to continue the research in beliefs. More complex models need to be developed to enablemore detailed research into the consequences of beliefs. On this basis, it would be possible to use beliefs more comprehensively and more practically.
References
| [1] | Oldham, Greg R.; Porac, Joseph F.; Shalley, Christina E. (1987). “Effects of goal difficulty, goal setting-method and expected external evaluation on intrinsic motivation.” Academy of Management Journal 30 (1987) 3: 553-563. |
| [2] | Benabou, Roland; Tirole, Jean (2003) “Intrinsic and Extrinsic Motivation.” The Review of Economic Studies 70 (2003) 3: 489-520. |
| [3] | Gneezy, U.; Rustichini, A. (2000). “Pay enough or don’t pay at all.” The Quarterly Journal of Economics 115 (2000) 3: 791-810. |
| [4] | Hart, W.;Eagly, A. H.; Lindberg, M.J.; Albarracin, D.; Brechan, I.; Merrill, L. (2009): Feeling Validated Versus Being Correct: A Meta-Analysis of Selective Exposure to Information. Psychological Bulletin 135 (2009) 4: 555-588 www.apa.org. |
| [5] | Moore, D.A.; Healy, J.P. (2008): The Trouble with Overconfidence. Psychological Review 115 (2008) 2: 502-517. |
| [6] | Ariely, D.; Gneezy, U.; Loewenstein, G.; Mazar, N. (2009). “Large Stakes and Big Mistakes.” The Review of Economic Studies (2009) 70: 451-469. |
| [7] | Condry, J.; Chambers. J. (1978). “Intrinsic Motivation and the process of learning.” In: Lepper, M.; Greene, D.: The hidden costs of reward: New perspectives on the psychology of human motivation. New York: John Wiley: 61-84. |
| [8] | Abeler, J.; Falk, A.; Götte, L.; Huffman, D.; (2009): Reference Points and Effort Provision. IZA Discussion Paper No. 3939 (2009) www.ssrn.com. |
| [9] | Deci, E.L. (1975). Intrinsic Motivation. New York: Plenum. |
| [10] | Siegel, Sidney (1987): Nichtparametrische statistische Methoden. Frankfurt am Main: Eschborn. |
| [11] | Bühl, Achim (2008): SPSS 16 – Einführung in die moderne Datenanalyse. München: Pearson Studium. |
| [12] | Hassler, U.; Nautz, D; (2004/2005): Statistik I und II – Vorlesungsunterlagen. Johann-Wolfgang-Goethe Universität Frankfurt am Main. |
| [13] | Lodie, Bob (2006): It’s all about Beliefs http://www.smallbusinessbrief.com/articles/inspiration/003753.html |
| [14] | Cerminaro, Anthony (2006): ‟Whether you think you can or can’t, you’re right” – Henry Fordhttp://www.allbusiness.com/legal/contracts-agreements/3874550-1.html |
| [15] | Csikszentmihalyi, M. (2008): Flow: The Psychology of Optimal Experience. New York: Harper Perennial Modern Classics. |
 Abstract
 Reference
 Full-Text PDF
 Full-text HTML