-
Paper Information
- Next Paper
- Paper Submission
-
Journal Information
- About This Journal
- Editorial Board
- Current Issue
- Archive
- Author Guidelines
- Contact Us
Human Resource Management Research
2012; 2(4): 38-45
doi: 10.5923/j.hrmr.20120204.01
Knowledge Asset Risk Management Framework
 Abstract
 Reference
 Full-Text PDF
 Full-Text HTML
Vladimir Riecicky 1, Andreas Spichiger 2
1Corporate Development, K-at-R Management Consulting GmbH, Bern, 3013, Switzerland
2Business School, Bern University of Applied Sciences, Bern, 3014, Switzerland
Correspondence to: Vladimir Riecicky , Corporate Development, K-at-R Management Consulting GmbH, Bern, 3013, Switzerland.
| Email: |  |
Copyright © 2012 Scientific & Academic Publishing. All Rights Reserved.
Knowledge, once recognized as a dominating driver of competitive advantage, needs major management attention. Given the intangible flavor of the asset, a well-defined management approach is key to sustainable results at low cost. This paper introduces a knowledge asset risk management framework designed to serve this purpose. The framework includes guidance for a streamlined process based on a comprehensive conceptual foundation and special visualization and data validation means. The visualization tools make the data analysis approachable to a broad audience and serve as the common language along the knowledge risk management. The research is based on several implementation cases presented within this paper.
Keywords: Knowledge Risk Management, Knowledge Measurement, Knowledge Asset, Tacit Knowledge
Cite this paper: Vladimir Riecicky , Andreas Spichiger , "Knowledge Asset Risk Management Framework", Human Resource Management Research, Vol. 2 No. 4, 2012, pp. 38-45. doi: 10.5923/j.hrmr.20120204.01.
Article Outline
1. Introduction
- The supply side of the business today is characterized by a strongly competitive environment. Due to the globalization trends, every player has an access to nearly any production resource. The winners turn the production resources into the smartest products and services. They utilize one special production resource especially well – the knowledge. Knowledge acquisition and retention turns out to be the dominating driver of the competitive advantage today. Consequently, knowledge drain becomes ever more one of the top-risks in the executive agenda.The general objective of this paper is to provide a risk-driven approach to the management of knowledge assets. The specific objectives include the respective conceptual foundation and the related management process. The main questions addressed in this paper are:▪ Which process shall a knowledge management follow?▪ What are the main elements for the measuring knowledge assets?▪ How can bias in the measurement be identified/ maybe eliminated or reduced during the whole process?▪ What are relevant visualizations of the assessment that support the stakeholders in all phases of the process?▪ What are examples of good implementations of the presented framework?This paper builds on the concept introduced in[1]. This case study provides an overview and genesis of the approach. However, it focuses only on the implementation case, rather than providing deeper insights into the framework itself. In the next sections, the framework is explained in detail. First, the process of knowledge risk management is explained, followed by the conceptual foundation of the framework. Finally, several implementation cases are described, followed by future research opportunities.
2. Process
- The process presented next is designed to guide a proper use of the framework. It consists of two building blocks: initiation followed by a continuous risk management cycle.
2.1. Initiation
- This phase declares the overall goal of the initiative and the respective tailoring of the framework. Different goals for managing the knowledge assets influence the granularity and the relevant knowledge in the scope. A few examples follow.The goal of reducing the headcount of contractors working for the company limits the scope of the analysis to a small number of people. The aim is to assess the knowledge assets that must not be lost due the outplacement of the contractors including the investment required to avoid this knowledge drain.A reorganization of a service support function along ITIL within a company focuses on the special set of knowledge assets required within the new organization. The intended staffing of the service support function will delimit the knowledge of the new organization. Consequently, the aim is to identify the knowledge to be transferred including the expected cost. Based on that, the risk and the cost of the intended change can be considered and appropriate actions taken. The situation is a very different in the case a company wants to expand into a new region. First, the knowledge needed to run the operations in the new region has to be identified. The aim is to estimate the cost of training the work force available in the labor market of the region. The estimates will be used to (re-)assess the decision on expansion in the sense of the cost-benefit analysis.
2.2. Risk Management Cycle
- The next step after the initiation is launching a continuous risk management cycle. This management cycle is designed according to the Deming cycle[2], later referred as the PDCA cycle. The PDCA cycle is entered at the check step.The aim of the Check step is the setup of the knowledge map focused on the goals identified within the initiation. Along with this, the relevant knowledge is scoped and the relevant parties are defined. The Check step is strongly limited to the measurement of the knowledge assets using the knowledge map from the previous step.The Act step is very important for the success of the management action. Stakeholder-oriented visualizations of the knowledge assets give a strong support for the identification and implementation of the concrete measures to deal with the actual knowledge risks. In fact, the framework follows a risk-driven approach to knowledge management ([3] to[12]). The visualization focuses on the relevant aspects, depending on the goals of the initiative.Next, the result is translated into concrete actions that are allocated to the respective resources and deadlines. This is done within the Plan step, ending up with an action plan which will be finally executed as part of the Do step. After the execution is finished, the cycle continues with the Check step, by updating the knowledge map.
3. Conceptual Foundation
- This chapter provides a conceptual overview of the framework. The respective model is designed using the Unified Modeling LanguageTM[13]. The abstraction level used discloses only the key framework concepts. Each of the concepts is named, and its semantics briefly described including the relationships to the other concepts. Figure 1 provides an overview.Knowledge Store represents a human resource, who is supposed to possess (store) some fraction of the business relevant knowledge. Each Knowledge Store is assigned a Risk Class. This property reflects the probability of losing the person as an employee, taking into account all the possible drivers, such as the labor market, or simply the age.Knowledge Unit represents a type of knowledge, as opposed to a knowledge asset, represented by a Knowledge Record. Note that knowledge turns into an asset only when recorded within a human brain. Only then it can be translated into tangible actions yielding a business value. Each Knowledge Unit is assigned a Target Profile, which describes a skill set taken into account when estimating the Replacement Effort. A Target Profile can have two alternative meanings. It either reflects a supply-perspective or a demand-perspective. In the supply-perspective a Target Profile specifies the skill set currently available in the labor market. In the demand-perspective the skill set matches the optimal skill set independently from the labor market supply. Note that both of the perspectives follow completely different goals. The quantification under a supply- perspective is the right way to estimate the risk taken by a company due to possible employee turnover. The quantification under a demand-perspective is the right choice in the following business scenario. There is decision to take upon the expansion into a new geographical region. Given the cost of the expansion attributable to knowledge acquisition (equals the knowledge quantification result) is fixed, the labor market must necessarily offer the skill set matching the Target Profile. In case the labor market does not fit the criteria, the expansion needs to be re-assessed.
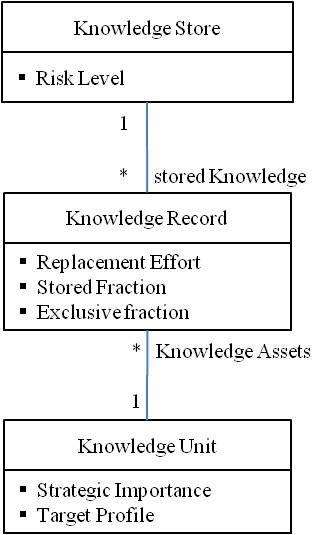 | Figure 1. Conceptual foundation |
4. Knowledge Asset Quantification
- Recalling[1], the real challenge is getting the replacement effort estimates right. That means estimates without bias caused through gaming (cheating the system) or plain misunderstandings along the estimation process. The other possible source of an estimation bias is a subjective perspective taken: not every employee shares the same level of willingness and/or ability to pass his/her knowledge on somebody else. The method presented next is the way to keep the bias limited at low cost.The method is designed around a voting principle. The knowledge bearers are separately asked two questions concerning the given knowledge unit:▪ How much of the knowledge (expressed as a fraction of the knowledge unit) do you possess?▪ How much effort do you need to pass your knowledge to a person matching the given target profile?Once the data is collected, the voting can be evaluated. A possible example of such a voting follows. Three knowledge stores (Bob, Patty, and Kathie) are interviewed separately concerning the knowledge units “Surfing basics” and “The right surf board”. The answers are given in Table 1.
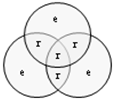 | Figure 2. Knowledge redundancy level |
| |||||||||||||||||||||||||||
5. Why Visualizations?
- For the sake of relevant changes of the initiative, it is worthwhile to identify good visualizations of the risks concerning the knowledge assets. The visualizations support the whole PDCA cycle, improving the level of common understanding among the stakeholders involved. The stakeholders can make direct links to their own contexts, and the incidences of the past are easily to identify in the visualizations. The visualization for a certain stakeholder considers his/her authority and competences for implementing further measures.For the persons concerned, the presentation has to be authentic, representing the knowledge of those persons concerned in an adequate way. The visualization of the past is comparable with their perception of the changes in reality. The visualization of the changes must also be appropriate compared to the visualization of the current state.For the principal and the agent, a good representation of the current and the future situation must be found.The manager of a knowledge management project is mostly interested in the visualization of the measures implemented and their impacts on the current situation. For future measures, the project manager’s interest is in visualizing the risks addressed by the measures and what their impacts will be in terms of the future shape of the knowledge assets.Good visualizations support the change process. A certain presentation can be suitable for a specific step during the change process, but not for the other steps. All stakeholders should be open to identify adequate visualizations required during the change.As the framework is supposed to be implemented as an ongoing process, one single visualization common to all stakeholders is a must, in order to implement the change successfully. This common visualization is introduced next.
6. Coral Reef Visualization
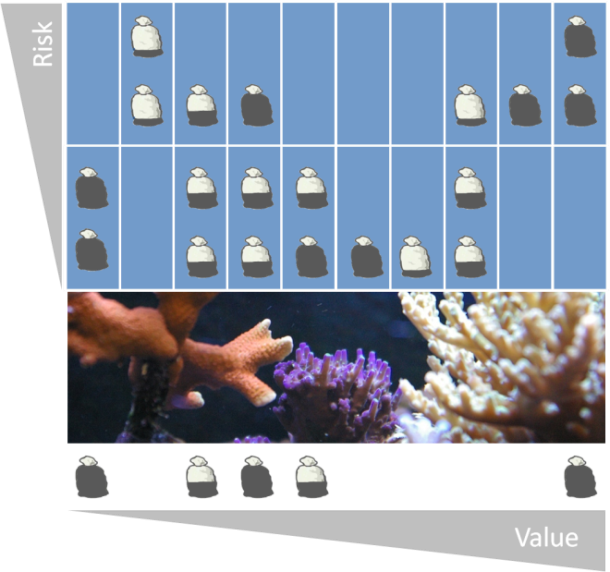 | Figure 3. Knowledge map example |
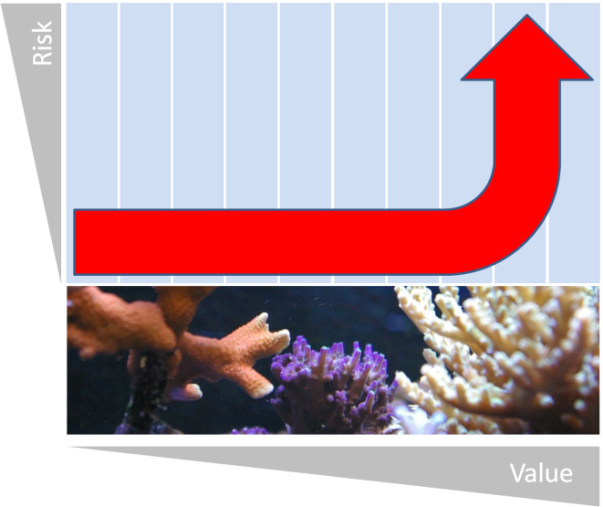 | Figure 4. Current |
7. Implementation Cases
- The purpose of this section is to describe the known framework implementation cases pointing to the key insights gained by practitioners.
7.1. Software Engineering Department
- The case within this chapter is a follow-up to the one described in[1]. In the meantime, knowledge risk management has become an important part of daily management practice of the department. The following plot shows, how the knowledge assets have evolved in shape.As can be seen in Figure 5, the Internal Redundancy Level improved, even though not rapidly. This can be explained by the fact that the improvements cannot be made at the same pace when the knowledge assets approach the optimal shape.
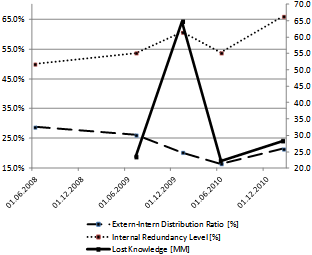 | Figure 5. Comparative view of knowledge map |
7.2. Reorganization
- The context of this implementation case is a reorganization of the whole IT department of PostFinance. The purpose of the reorganization was to separate the functions of software development from software maintenance. The newly created software maintenance team employs around 40 professionals and is supposed to completely cover the entire software maintenance for all the applications developed by the IT department. The number of applications totals 120, and the yearly maintenance budget is around CHF 120m. The challenging part of the reorganization is the rapid acquisition of the required knowledge by the software maintenance team from the colleagues from within the development departments (who used to maintain the applications in the past).As part of the initiation phase the goal of the framework utilization was an identification of knowledge gaps within the target software maintenance function and setup of the action plan to tackle the respective risk.In response to the risk identified, the reorganization was postponed. The coral reef visualization played a major role in articulating the risk. Decision makers from line management favored the visualization, due to its expressive power and rapidly adopted the “language of corals”. The data collection was done in two steps. The first step aimed at Stored Fraction. After the first step was finished, further data collection (Replacement Effort and Exclusive Fraction) was done, but only for a limited number of Knowledge Units. The Knowledge Units in scope were only the ones at risk, due to the Stored Fraction. This is the way the project decided to go in order to gain more efficiency processing high data volumes (500 Knowledge Units) in a very limited time frame (2 weeks).The main obstacles were experienced during the search for the right architecture of the knowledge unit inventory. It took several iterations to get it right. The key was understanding the essence of the knowledge subject first, then the partitioning of the respective knowledge assets into the Knowledge Units succeeded.
8. Conclusions and Future Research
- The research supported by the empirical experience underlines the importance of the initiation phase as a major success driver of any risk management initiative based on the framework.Similarly, finding the right visualizations appears to be a major issue, when it comes to stakeholder management. The coral analogy serves exactly this purpose, and it serves it very well.The introduced bias identification means clearly improve the data reliability making the bias visible at literally no additional cost.Since the framework is relatively new compared to other similar approaches, there are many research opportunities there. This chapter points to several of those in the form of research questions:▪ What is the optimal knowledge redundancy level within an organization in terms of cost/benefit?▪ Which of the business performance indicators (market share, net income, share price, etc) correlates the best with the knowledge risk position of a company?▪ What are the typical currents within an organization of a given corporate culture, and how can they be identified and managed? ▪ What are the maturity levels of Knowledge Risk Management and how do they relate to the known models, such as KMMM®?
References
| [1] | V.Riecicky (2011): “Case Study: Replacement Cost Based Approach to Risk Management of Knowledge Assets” |
| [2] | Deming, W. Edwards (1986). Out of the Crisis. MIT Center for Advanced Engineering Study. ISBN 0-911379-01-0. |
| [3] | Peter Massingham, (2010) "Knowledge risk management: a framework", Journal of Knowledge Management, Vol. 14 Iss: 3, pp.464 – 485 |
| [4] | Aljafari, R., Sarnikar, S. (2010): "A Risk Assessment Framework for Inter-Organizational Knowledge Sharing" Sprouts: Working Papers on Information Systems, 10 (29). |
| [5] | James Arrow (2008): “Knowledge-Based Proactive Project Risk Management”, AACE INTERNATIONAL TRANSACTIONS |
| [6] | Mostafa Jafari, Jalal Rezaeenour, Mohammad Mahdavi Mazdeh, Atefe Hooshmandi, (2011): "Development and evaluation of a knowledge risk management model for project-based organizations: A multi-stage study", Management Decision, Vol. 49 Iss: 3, pp.309 - 329 |
| [7] | Samer Alhawari, Louay Karadsheh, Amine Nehari Talet, Ebrahim Mansour (2012) " Knowledge-Based Risk Management framework for Information Technology project", International Journal of Information Management, Volume 32, Issue 1, February 2012, Pages 50-65 |
| [8] | Eduardo Rodriguez, Ph.D. John S. Edwards (2008): “Before and After Modeling: Risk Knowledge Management is Required”, ERM Symposium 2008 Casualty Actuarial Society – PRMIA. Schaumberg, IL: Society of Actuaries |
| [9] | G Haltiwanger, R E Landaeta, C A Pinto, A Tolk (2010): “Understanding the relationship between Risk Management and Knowledge Management: A literature review and extension”, International Journal of Knowledge Management Studies |
| [10] | Edwards, J. S. (2009): “Business processes and knowledge management.”, M. Khosrow-Pour (Ed.), Encyclopedia of Information Science and Technology (Second ed., Vol. I, pp. 471-476). Hershey, PA: IGI Global. |
| [11] | Mäenpää, Irinja; Voutilainen, Raimo (2012): “Insurances for human capital risk management in SMEs”, VINE, Volume 42, Number 1, 2012 , pp. 52-66(15) Emerald Group Publishing Limited |
| [12] | Eduardo Rodriguez PhD Candidate Aston Business School, Export Development Canada EDC Ottawa Canada (2009): “Knowledge Management and Enterprise Risk Management Implementation in Financial Services”, |
| [13] | Object Management Group: “Unified Modeling LanguageTM “ |
| [14] | Xu Ye, Zhang Hui (2010): “Literature Review on Enterprise Tacit Knowledge Management”, International Conference on EBusiness and EGovernment |
| [15] | Gopesh Anand, Peter T. Ward, Mohan V. Tatikonda (2010): “Role of explicit and tacitknowledge in Six Sigma projects: An empirical examination of differential project success”, Journal of Operations Management, Volume 28, Issue 4, July 2010, Pages 303–315 |
| [16] | J. Scott Holste, Dail Fields (2010) "Trust and tacit knowledge sharing and use", Journal of Knowledge Management, Vol. 14 Iss: 1, pp.128 – 140 |
| [17] | Brickley, J. / Smith, C. / Zimmerman, J. (William E. Simon Graduate School of Business Administration, University of Rochester 2009): “Managerial Economics and Organizational Architecture” |
| [18] | Carayannis, Elias G. (2008): “Knowledge-Driven Creative Destruction, or Leveraging Knowledge for Competitive Advantage: Strategic Knowledge Arbitrage and Serendipity as Real Options Drivers Triggered by Co-Opetition, Co-Evolution and Co-Specialization”, IP Publishing Ltd., Industry and Higher Education, v22 n6 p343-353 |
| [19] | Rafael Andreu, Joan Baiget, Agustı´ Canals (2008): “Firm-Specific Knowledge and Competitiv Advantage: Evidence and KM Practices”, John Wiley & Sons, Ltd. |
| [20] | Heli C. Wang, Jinyu He, Joseph T. Mahoney (2009): “Firm-specific knowledge resources and competitive advantage: The roles of economic- and relationship-based employee governance mechanisms”, Strat. Mgmt. J., 30: 1265–1285 |