E. C. Merem 1, Y. A. Twumasi 2, J. Wesley 1, D. Olagbegi 1, M. Crisler 1, C. Romorno 1, M. Alsarari 1, P. Isokpehi 1, M. Alrefai 1, S. Ochai 3, E. Nwagboso 4, S. Fageir 5, S. Leggett 6
1Department of Urban and Regional Planning, Jackson State University, 101 Capitol Center, Jackson, MS, USA
2Department of Urban Forestry and Natural Resources, Southern University, Baton Rouge, LA, USA
3African Development Bank, AfDB, 101 BP 1387 Avenue Joseph Anoma, Abidjan, AB 1, Ivory Coast
4Department of Political Science, Jackson State University, 1400 John R. Lynch Street, Jackson, MS, USA
5Department of Criminal Justice and Sociology, Jackson State University, 1400 John R. Lynch Street, Jackson, MS, USA
6Department of Behavioral and Environmental Health, Jackson State University, 350 Woodrow Wilson, Jackson, MS, USA
Correspondence to: E. C. Merem , Department of Urban and Regional Planning, Jackson State University, 101 Capitol Center, Jackson, MS, USA.
| Email: |  |
Copyright © 2021 The Author(s). Published by Scientific & Academic Publishing.
This work is licensed under the Creative Commons Attribution International License (CC BY).
http://creativecommons.org/licenses/by/4.0/

Abstract
The West African region as an emerging frontier in untapped natural resource market is now at the receiving end of illegal shipment of unwanted Electronic waste (E-waste) to vulnerable populations in different countries. Like many areas in the global south, West Africa finds itself in an unwanted place as the preferred graveyard for dumping these items. Besides, many view the trade in second hand electronic items as fiscal gold mine with greater potentials to improve the welfare of citizens in West Africa. This comes under the guise of trading in used shipments from Europe and the US for the purposes of creating new jobs in the West African region, despite the unlawful nature. Given the overall public health risks to those drawn to the sector in lieu of life-threatening exposure to ailments and ecosystem degradation. The receiving nations like Nigeria, Ivory coast, and Ghana have not only endured widespread risks to their water sources in areas adjacent to dump sites. But, over the past years, E-waste operations have grown to troubling proportions in the region as the abandoned components littered in local landfills undercut the aesthetic beauty of cities. With people unaware of the hazards, scavengers, haulers, and technicians regularly exposed to doses of E-waste contaminants face serious health problems. Just as the exposures to E-waste chemicals trigger the hospitalization of victims across West Africa, little has been done to assess the frequency of the problems and the ecological impacts using mix scale techniques. For that, this enquiry will fill that void by assessing the state of E-wastes and the risks in the West African region with emphasis on the issues, trends, impacts, factors, and efforts using secondary data connected to Geographic Information Systems (GIS) and descriptive statistics to track the patterns. The results show increases in the volume of E-waste dumping in the region over the years with impacts on the ecosystem coupled with public health risks. The GIS mapping of the trends pinpointed spatial dispersion of risks and stressors across different clusters of areas in the zone with the problems linked to factors ranging from socio-economic variables, policy, and physical forces. For remedy, the paper proffered various solutions such as effective laws, regular monitoring, sectoral reforms, public enlightenment program and the design of a regional E-waste information system.
Keywords:
E-waste, GIS, West Africa, Health Risks, Factors, Contaminants, Waste volume, Impacts
Cite this paper: E. C. Merem , Y. A. Twumasi , J. Wesley , D. Olagbegi , M. Crisler , C. Romorno , M. Alsarari , P. Isokpehi , M. Alrefai , S. Ochai , E. Nwagboso , S. Fageir , S. Leggett , Analyzing the Environmental Risks from Electronic Waste Dumping in the West African Region, Journal of Health Science, Vol. 11 No. 1, 2021, pp. 1-16. doi: 10.5923/j.health.20211101.01.
1. Introduction
Building on global environmental justice debate, the disproportionate sharing of ecological burdens and the unsolicited dumping of toxic wastes unknown to the recipients in poor nations with potentials to inflict harm under false pretences is inhumane and moral evil [1,2]. Over the past several years, an unknown volume of used electronics illegally shipped from developed to 3rd world nations ended up in places lacking the capacity to reject imports or to handle these materials appropriately [3,4,5,6,7]. Knowing that without proper standards and enforcement, such unauthorized practices may result in public environmental health concerns. There are now concerns about the risks from unsafe handling of used E-waste, in developing nations as it results in harm to human health and the environment. In the case of West Africa, communities face recurrent open-air burning and dangerous routines of acid baths often used to recover valuable materials from electronic components. This exposes workers to harmful substances together with problems of toxic materials leaching into the ecosystem. Since these techniques can endanger people due to high levels of toxins such as lead, mercury, cadmium, and arsenic with permanent health effects, including cancers, miscarriages, neurological damage, and low Intelligence Quotient (IQ). The insidious danger of these liabilities applies to big cities from Nigeria to Ghana where victims impacted by E-waste graveyards battle the risks [8-16]. Accordingly, the West African region as an emerging frontier is now at the receiving end of illegal shipments of unwanted E-waste to vulnerable populations and sites in different nations. Like many areas in the global south, West Africa finds itself in an unwilling place as the preferred graveyard for the dumping of these items. To that effect, the UK contributed 1.5 million tonnes of waste compared to the staggering 11.6 Mt from the EU last year. Those figures dwarfed the 1.9 million tonnes produced by Africa and the study area making the region a dumping ground for these unwanted E-waste products. Besides, there are those who view the trade in second hand electronic items and E-waste as a fiscal gold mine with greater potentials to improve the welfare of many people in West Africa. This comes under the guise of trading in used goods shipped from Europe and the US deemed essential in the creation of new jobs in the West African region, despite the unlawful nature of these activities. The tragic nature of the situation is such that some of the appliances often leak toxic elements likely to harm the ecosystem and the desperate scavengers who scrawl through the broken goods hoping to find something worth selling while risking their lives [17-27]. Seeing that Ghana only produced 38,000 tons of E-wastes in 2012, it takes in millions of tons yearly. In the same region, countries like Nigeria also bear the brunt since over 500 containers, each carrying about 500,000 used computers and other electronic items, dock in the nation’s ports monthly from the US, Europe, and Asia. Essentially around 18,300-60,000 MT of used EEE arrive in Lagos in shipping containers annually, originating mainly from Germany, the UK and Belgium, while the US contributes some 20% to the EEE importation [28,29,30]. In as much as, half of used EEE imported to the country are damaged and unusable. It is illegal to import end-of-life EEE, which is basically E-waste. Besides, Nigeria is the 3rd largest generator of E-waste in Africa contributing 12% of the total volume, with 288,000 metric tonnes in 2017. The ubiquitous gravity emanating from the indiscriminate dumping of E-waste has rattled the trio of leading economies made up of Nigeria, Ghana and Ivory coast and their policy makers to levels beyond their control [31,32,33]. Given the overall public health and environmental risks to those drawn to the sector [34]. The receiving nations have not only endured widespread risks to their water sources in areas adjacent to E-waste dump sites in Nigeria, Ivory coast, and Ghana [35]. But, over the past years, E-waste operations have grown to troubling proportions in the region as abandoned components littered in local landfills undercut the aesthetic beauty of cities [36]. With people unaware of the hazards, scavengers, haulers, and technicians regularly exposed to doses of E-waste contaminants face serious health problems [37]. Knowing that public exposures to E-waste chemicals trigger the hospitalization of victims across West Africa, little has been done to assess the frequency of the problems and the ecological impacts using mix scale techniques. This is happening in a setting where the movement of used electronics to Africa is unlawful, however the peddlers manipulate existing gaps in policy, by falsely tagging the objects as recyclable because it is cheaper to reprocess therein than in the nations of provenience [35,38]. Consequently, the regional profile of the tragedy in West Africa is essential, in that it helps ensure a common approach in confronting the issues among the nations in the zone. Seeing these voids, this enquiry assesses the state of and risks from E-waste trade in the West African region using secondary data connected to mix-scale methods of GIS Geographic Information Systems (GIS) and descriptive statistics to track the patterns with emphasis on the issues, trends, impacts, factors, and efforts [39]. The paper is organized into five parts. Part 1 and 2 encompasses the introduction, methods, and materials. While sections 3 and 4 highlight the results and discussions. Section 5 presents the conclusion. In terms of aims, of the 5, the first two objectives of the research are to examine the issues in E-waste flow, together with the tracking of the patterns and status of the trade in West Africa. The remaining 3 objectives center around the assessment of temporal and spatial dimensions of E-waste indicators, identification of factors responsible for the proliferation coupled with the creation of a decision support tool for policy making.
2. Methods and Materials
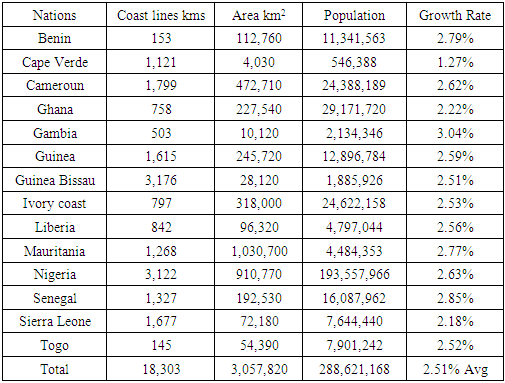
The study area, West Africa situated in the Sub-Saharan Africa region consists of mostly 14-17 member countries of the ECOWAS (Fig 1). The countries range from Cape Verde, Gambia, Ghana, Liberia, Mali to Nigeria. With a population of more than 259-359 million, the region accounts for just about one-third of sub-Saharan Africa’s entire population (Table 1). For that, the region occupies a land area measuring about 5,112,903 km2 under a diverse ecosystem where dominant conditions vary from desert to tropical rainforests [40]. The West African region’s hydrology dominated by the River Niger which drains most of the area with other outlets and creeks and watersheds are now threatened from the menace of E-waste pollution runoffs. Just as the landscape, and climate are varied, so are the challenges to overcome the appeal of the zone as global electronic graveyard for E-waste in the face of economic deprivation luring ordinary folks to the trade. Notwithstanding the fiscal benefits trumpeted by E-waste trade proponents amidst unsubstantiated claims of advancing the public good of many in West Africa. The nefarious practices of deliberate mislabelling of E-waste items to evade detection across the region’s ports comes at the expense of environmental and public welfare of cities in West Africa as some of these nations face clusters of areas impacted by water and air quality declines [38]. In these places, communities have suffered the unwanted discomfort of E-waste shipments from Europe and the US where proponents see the trade as job sources in West Africa. Yet, the unlawful nature of these activities and risks threatens community wellbeing and the ecosystem. Aside from the disturbing images showing West-Africa's vast electronic graveyards with millions of tonnes of discarded appliances from all over the world littered around. The nations of Benin, Ivory Coast, Ghana, Liberia, and Nigeria generate only around 1 million tons of domestic E-waste yearly as well [28].Table 1. Population and The Size of Study Area
 |
| |
|
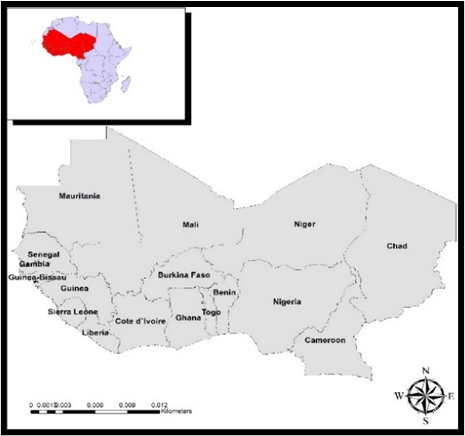 | Figure 1. The Study Area West Africa |
Considering the contradictions embedded in the movement of E-waste, in the EU, the Waste Electronic and Electrical Equipment (WEEE) guidelines in the zone control how E-waste ought to be handled and managed, and likewise limit shipment destinations. The export of such items is prohibited to nations outside of the OECD in the global South for the purposes of reprocessing. In that way, those materials go through rigorous assessment to gauge compliance with the operational benchmarks deemed necessary to limit any form of exposure to damage while on transit. From the repeated inflow, there are notable unease regarding the unlawful dumping of E-wastes in the study area. Seeing how problems of soaring E-waste dumping suffocate nations in the west African region. The United Nations Environment Program (UNEP) and other multilateral and national agencies in West Africa promulgated guidelines to safeguard community welfare and economic dependence in reused electronics as efforts to stem the tide but to no avail [31,35,24,41]. Added to that, the nuisance posed by the colossal mountains of E-waste to the physical beauty of west African cities strips away the beauty of communities essential in the daily attractions of towns to their citizens. In such a setting, the sights of obsolete laptops and tattered old fridges displayed across cities in the zone and markets are now so remarkably appalling that they have accelerated a surge in the flow of EEE wastes and fractured electronics items into the area with ease. At the same time, customer orders have grown extensively globally, creating a colossal electric trash and graveyard spanning through many nations in the region. In the process, during the past years Africa remains the destination of discarded electronics trade made possible by illicit export. To that effect, it is not surprising that in Ghana where, close to 70% of imported electronics are classified as second hand, one third of those items lack operational capacity. That is why televisual depiction of major cities of West Africa often show dump sites with teenagers scavenging around and shedding copper from abandoned cables. Being a combination of various metals and substances made up of toxic heavy chemicals from mercury to silver. The constant burning of E-wastes to retrieve copper in the process lives in their wake the emissions and concentration of dioxins and furans in the ecology of major African cities. These risks must be analyzed [28].
2.1. Methods Used
The research uses a mix scale approach involving descriptive statistics and secondary data connected to GIS to assess the state of and risks from E-waste trade and the emerging issues in the West African region. The spatial information for the enquiry were obtained from various entities including the Lagos Waste Management Authority, Silicon Valley Toxics coalition, EIT Digital, Toxics Links India, digital globe, and the Economic Commission of West African States (ECOWAS) and the African Union and the International Telecommunication Union (ITU). While more sources of geographic info are Beijing Institute of Technology (BIT) and the Basel Convention Secretariat. Other sources of spatial data originated through the Basel Action Network (BAN), United Nations University, Green Peace, the United Nations Environment Programme (UNEP) and The International Labour Organization, the University of Northampton, and the CIA World Fact Book. Additionally, the International Union For the Conversation of Nature (IUCN), the European Union (EU) and Organization for Economic Co-operation and Development (OECD), WEEE Africa Forum, Afrik 21, the United Nations Economic Commission For Africa (ECA), and African Development Bank also provided other information required in the study. Principally, much of the info related to E-waste indices like E-waste export, per capita e-waste distribution, per capita E-waste generation, waste flow, and the sources and destinations of the trade from the West to global South indispensable in the execution of the enquiry in the region and different countries were obtained from WEEE Africa Forum, the United States Environmental Protection Agency (EPA), Forbes Statista, the World Counts, International E-waste Management Network, US EPA office of International Affairs and the Environmental Justice Atlas.In the same vein, as access to other relevant data came through the World Bank, UN Environment, United Nations Industrial Development Organization (UNIDO), United Nations Institute for Training and Research (UNITAR); and the Secretariat of the Stockholm convention proved crucial. The other organizations like World Business Council for Sustainable Development (WBCSD), the World Health Organization (WHO) and the World Economic Forum and the Secretariat of the Environment Management Group (EMG), and the Bureau of National Statistics and the ITU and Oko Institut E.V, the European Parliament and the Council on Waste Electrical and Electronic Equipment and the International Solid Wastes Association offered insights on the extra secondary data on the numbers, quantities, trends, gains and declines in E-waste indicators and the other groupings that bolstered supporting info which were instrumental in the overall data analysis and provision of relevant indices. Given that the boundaries stayed unchanged, the regional and national, state, county and federal geographic identifier codes of the countries were used to geo-code the info contained in the data sets. This information was processed and analyzed with basic descriptive statistics, and GIS with attention paid to the temporal-spatial trends at the national and regional levels within the West African region in Sub Saharan Africa. The relevant procedures consist of two stages listed below.
2.2. Stage 1: Identification of Variables, Data Gathering and Study Design
The opening phase in this enquiry began with the identification of variables required to appraise the scope of E-waste trade, shipments, generations, and trends at the regional and national levels from 2009 to 2016. The initial variables include socio-economic and environmental and E-waste data made up of population, E-waste destination, known sources, suspected destination, E-waste generation, E-waste export, export volume of EE-waste, sea borne imports of TVs and monitors and jobs from E-waste. This was followed by number of countries where a quarter of electronic waste ends up and countries where domestic consumption accounted for 85% of E-waste. The others consist of volume of E-waste put on market, imports of EEE waste, E-waste generated kg per inhabitant and the samples of E-waste in circulation in the region. Added to that are the penetration rate of selected EEE (in installed units per capita) and the categories, EEE in use, population, E-waste accumulation, the audit of imported and used E-waste and the population yearly change. Significant among the data are the remaining ones like the size in km2, yearly change, global distribution and rankings of E-waste destinations and uses and the samples of E-waste in circulation in the region. The others encompass percent of imported E-waste, percent of E-waste used, percent of E-waste in use, percent of E-waste generated and the averages of generated E-waste.
2.3. Stage 2: Step 2: Data Analysis and GIS Mapping
In the second stage, descriptive statistics and spatial analysis were employed to transform the original socio-economic, environmental indicators and E-waste data into relative measures (percentages, ratios, and rates). This process generated the parameters for showing, the scope of E-waste generation, E-waste export volume, sea borne imports of TVs and monitors and jobs from E-waste countries where domestic consumption accounted for 85% of E-Waste. The data analytical stage also provided the contours essential in the processing of info on global distribution and rankings of E-waste destinations and uses, the samples of E-waste in circulation in the region, percent of imported E-waste, percent of E-waste used, percent of E-waste in use, percent of E-waste generated, the averages of generated E-waste, across the study area among the individual nations via measurement and comparisons over the years. Since the spatial units of analysis consist of various nations, cities, shorelines, and counties and the boundary and locations where the dumping and generation and export of E-waste thrived. This approach allows the detection of change and the extent of concentration, the activities, and inherent risks. The tables highlight the actual frequency and impacts, accumulation, and shipment of E-wastes and the trends as well as the ecological, health and, economic liabilities. The remaining steps involve spatial analysis and output (maps-tables-text) covering the study period, using Arc GIS 10.4 and SPSS 20.0. With spatial units of analysis covered in the 14-17 nations (Figure 1), the study area map indicates boundary limits of the units and their geographic locations. The outputs for each nation in the region were not only mapped and compared across time, but the geographic data for the units which covered boundaries, also includes ecological data of land cover files and paper and digital maps from 2009-2016. This process helped show the spatial evolution of location of various levels of production, export, shipments, usage, and the trends, the ensuing socio-economic, environmental and health impacts, ecological degradation as well as changes in other variables and factors driving the dumping of E-waste, production and usage and the impacts in the study area.
3. The Results
This segment of the enquiry focuses on temporal and spatial analysis of the E-waste crisis in the study area. There is an initial focus on the analysis of distribution, ranking and global dimensions, imports, and production in the study area using descriptive statistics. The other parts assess the environmental impacts of the activities within multiple sites across two of the nations in the zone based on a set of human, ecological and health indicators. This is followed by the remaining portions of the section comprising of GIS mappings, and the identification of the factors behind the dumping of E-waste into West African cities and the efforts of agencies in the region.
3.1. Distribution, Destinations and Ranking 2012-2015
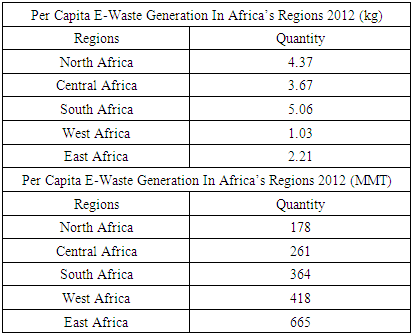
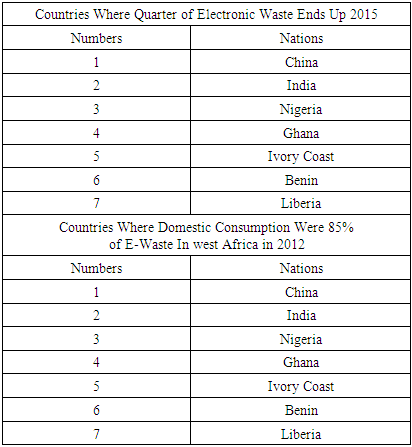
Considering the distribution of the waste measurement indicators in place over the years, the attraction of the study area as the preferred dump site for E-waste remains so troubling that it now defies every known international convention and logic on the transboundary movement of illegal trash at the regional and national levels in Africa. When compared to population size and the economies respectively, five West African nations led by Nigeria rank behind India and China as the final destinations and producers of E-Waste. In terms of regional comparisons with other areas in the continent of Africa in 2012, West Africa’s per capita E-Waste production of 1.03 kg – 418 MMT, even though it lags some of the zones under the two measurement scales, the volumes generated and those in circulation can still lead to unintended consequences on the sensitive ecosystems of the continent (Table 2). In the process, the key countries in the zone, most notably Nigeria, Ghana, Ivory Coast, Benin, Liberia are not only among places in the world where 40 percent of E-waste ends up, but their domestic consumption represent 85 percent of the waste as well. Since this was the case in 2015 and 2012, in putting that into context, it means that over 71 percent of the traded wastes ended up in the study area. This really puts those five countries in West Africa at the receiving end of the burdens from the emergent footprints (Table 3). Being mostly on the coastal lower South area in the zone, the heavy pile ups in 2011 from the indiscriminate dumping of wastes in the leading economies is forcing policy makers and the international community to rethink and scramble for mitigation measures (Table 4). Table 2. Regional Distribution of Per Capita E-Waste Generation In Africa 2012
 |
| |
|
Table 3. Global Distribution/ Rankings of E-Waste Destinations and Uses 2012- 2015
 |
| |
|
3.1.1. E-Waste Imports in 5 Leading Nations 2009-2010
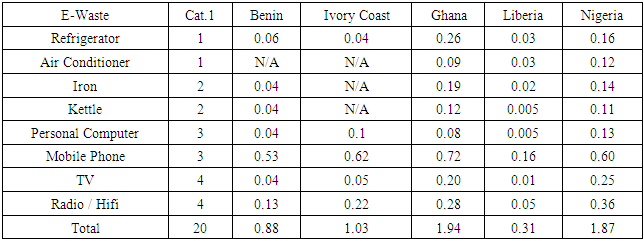
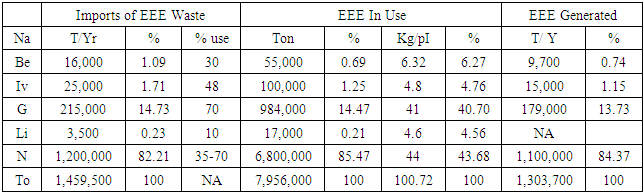
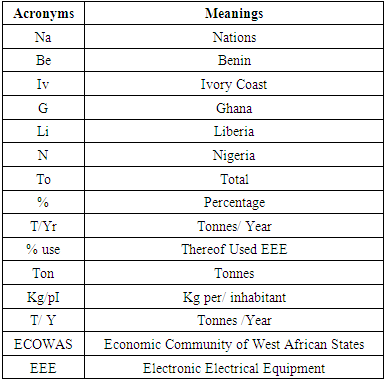
The volume of Electrical and Electronic E-waste in circulation under multiple categories among the countries in the zone involves the imported ones and those already in use on a yearly basis between 2009-2010 (Table 5). Out of the overall tallies in the millions of tons in the number of E-wastes under transactions in the three categories of imported items, the materials in use and those generated (1,459,500, 7,956,000, 1,303,700) (Table 5). The region averaged 291,900, 1,591,2000, 325,925 tonnes during the period 2012. Turning to the breakdown on the distribution of individual E-waste category beginning with imports among the countries, Nigeria and Ghana took in the largest volumes of waste estimated at 1,200,000 tonnes to 215,000 which represents 82.21% and 14.73% as well. Further along those lines, a trio of other nations in the region Benin, Ivory Coast and Liberia on the fringe of the scale accounted for meagre volumes (16,000,25,000,3,500) at combined percentage level of only 3.03% (Table 5). This was far below the 96.94% for Ghana and Nigeria in similar periods. The same thing goes for the proportions of EEE therein, of which both Ghana and Nigeria exhibited further dominance under those parameters. See Appendix 2 for more on the acronyms.Table 4. The Samples of E-Waste In Circulation In The Region: The Penetration rate of selected EEE (in installed units per capita) 2011
 |
| |
|
Table 5. The Audit of E-Waste Import and Use In West Africa 2009 -2010
 |
| |
|
Looking at the tabular info, note that the size of EEE waste that are further in use also reveals a similar trend in which Nigeria and Ghana the principal users outpaced their neighbors in the zone in every statistical category. This covers the corresponding volumes of 6,800,000-984,000 tonnes representing 85.47 to14.47% or 99.94% for Nigeria and Ghana as the others (Benin, Ivory Coast and Liberia) used up only 55,000, 100,000 to 17,000 tonnes mostly at much lower proportion of 2.15% (Table 5). Even the mass of used E-waste per citizen and percent in the various countries, still show the huge dominance of Ghana and Nigeria separately with 41-40.70% to 44 to 43.68% in waste usage per inhabitant and percentage points together with combined proportions of 84.38% ahead of the others. Of great importance in all these is the size of generated E-waste in which Nigeria and Ghana again accounted for 1,100,000 to 179,000 million tons at the rates of 84.37%-13.73% in 2009 through 2010.
3.1.2. E-Waste Generation in West Africa 2015 -2016
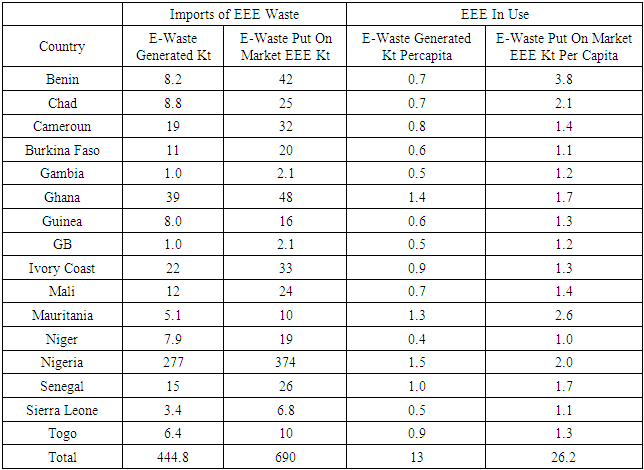
The other dimensions to the E-waste fiasco in the study area reflects the extent and form of generated trends in the 2016 fiscal year as contained in the table. This comprises of E-waste generation, the actual imports, the use level, the volume put into the marketplace, and the respective per capita versions (Table 6). From the information in the table, the study area accounted for a total of 444.8kt - 690 kt and 13kt, and 26.2 kt E- in 2016 respectively under the four E-waste indicators. At the country level, Nigeria’s generated wastes of 277 Kt being the largest volume in 2016 among the countries, represents 61.7% of the regional total. Elsewhere, the other neighboring nations of Ghana and Ivory Coast ended with only 39kt to 22 kt at percentage levels of barely 8.76%-4.94%. As the rest of the nations from Cameroun to Togo remained in the lower digits. On the marketing side of the E-wastes, aside from the regional average of 43.1 kt covering the 16 countries in the area, Nigeria presided over huge volumes of a thriving trade involving a significant chunk of E-waste estimated at 374kt and 54.2% of the ventures. After that, Ghana and Ivory coast followed with marketed E-wastes estimated at 48 to 33kt (Table 6). Accordingly, the activities in these commodities in the lower tier countries (Benin, Chad, Cameroun, Mali, Senegal and Niger and Mauritania) under varying scales (42 kt, 25, 32 kt to24, 26, 19kt, 10 kt) affirmed further penetration of the trade into various parts of the West African region. Table 6. The Volume of E Waste Generated 2016 In West Africa
 |
| |
|
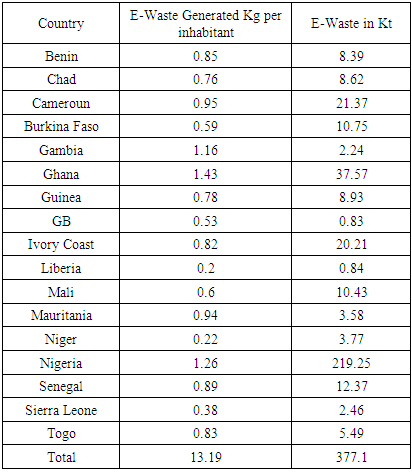
The most chilling thing from the analysis stems from the per capita distribution of generated wastes and those traded in the marketplace. Under these categories of indicators, the fact that a big country like Nigeria posted slightly identical per capita values of 1.5-2.0kt comparable to 1.4 -1.7 and 1.3-2.6 for Ghana and Mauritania still does not seem comforting at all. This raises serious health risks for those exposed to noxious substances within the vicinity of waste generation and the accompanying market transactions. In as much as in the previous year, 2015, the per capita E-waste generated in Ghana, Gambia, and Nigeria at 1.16, 1.43 to 1.26kt respectively surpassed those of every other nation in the region. Of the total 377.1kt in generated E-wastes produced regionwide at an average of 22.1 kt, Nigeria again held the top spot with 219.25 kt which is equivalent to 58.20%. The next group of countries Ghana, Cameroun, and Ivory coast were responsible for just only 37.57, 21.37 to 20.21k. This represents 9.96%, 5.66% to 5,35% of the total generated wastes in West Africa in 2015 (Table 7).Table 7. The Volume of E Waste Generated 2015 In West Africa Spiegel E Flow
 |
| |
|
3.2. Impact Assessment
From the emergent liabilities prompted by the widespread flow and trade in E-waste along the West African region over the years. Communities in big urban centres of the study area particularly Ghana and Nigeria have experienced notable impacts of various levels. This stems from the volume of activities in the respective nations with ecological, physical, and environmental health implications.In the Agbogbloshie market dump site in Accra Ghana, E-waste recyclers, comprising of kids extract copper, aluminum and other metals contained in electronic gears such as computers and televisions. Since these items were illicitly discarded or obtained under legitimate exports as used electronic and electrical equipment (EEE) through sources in the UK, US, and EU. The presence of various toxic substances, neurotoxins, and carcinogens in the scavenged E-wastes constitutes serious dangers. Thus, most of the E-waste scavengers in the Agbogbloshie depot share far greater exposures to respiratory ailment, cognitive defects, compromised immunity, lead poison risks and cancer. Furthermore, the ecological effects of E-waste trade in the area remains overly dreadful from the sight of burning junks accompanied by contaminated metals floating all over the terrain and the adjoining lakes and rivers heavily essential to cattle rearing. Notwithstanding these threats, in 2011, 77% of the E-wastes out of the England and wales ended up in Ghana and Nigeria as well. Further along these lines, at Agbogbloshie market, a whole set of public environmental health indicators most notably blood, urine, and maternal milk of those in the dumpsite together with air and soil quality fall below the conventional thresholds. The breakdown of the environmental health profile indicates that collected and analysed blood samples from E- waste workers at Agbogbloshie dump site revealed elevated quantities of lead. In the same area, traces of iron, lead and antimony have been detected in the E-waste boys’ urine samples. These heavy metals originate from fish and seafood menu based on the eating habits of Agbogbloshie’s inhabitants. Additionally, disturbing amounts of polychlorinated biphenyls (PCB) not only came from the screening of breast milk, but PCBs are highly toxic compounds found in old electrical appliances. The levels found there were 2 -34 times over the permitted global PCB standards. From the order of risk levels therein as captured, available air control station detected a trio of metals (iron, lead, and copper). The breakdown of the distribution from on-the-spot identification and verified inferences drawn from the indicators were about 1.5 milligrams per cubic metre of copper at an allowed threshold of 1.0 mg), as well as 7.8mg/ m³ of iron (threshold: 5.0) and 0.72 mg/ m³ of lead (threshold: 0.15). Similarly, out of 100 soil samples collected in Agbogbloshie, more than half have shown an amount of lead which is over twice as much as the standards allowed by the US EPA. The detected values ranged from a minimum of 135 ppm (parts-per-million) to a maximum of 18.125 ppm. The threshold indicated in the USEPA guidelines is of 400 ppm. In the case of Lagos, Nigeria where 75% of imported E-wastes are obsolete and unserviceable, much of the junk are collected and sent to 3 official dump sites most notably Olusosun dumpsite, Igodun Dumpsite and Ikorodu. Realizing that the E-waste sector poses serious health and environmental risk for both the immediate communities at the dumpsites and the workers tied economically to the trade. Under a current age span of 12-25 years at an area lot size of 63.67 hectares, during 1997-2007, the 3 facilities handled about 27 million tonnes. Among the facilities, Olusosun as the largest of the trio in Lagos state, extends over 41.7 hectares of land and handles 40% of the wastes produced state-wide. Accordingly, the amenity takes in 11,000 metric tonnes of wastes hurled from 300 trucks daily. In that way, the Oluosun landfill received at least 40 million metric tonnes of waste since its inception in November 1992 [42]. In so far as the known impacts cover air pollution and fires, there are also risks of exposure to debris from flood. Similarly, the fact that the loss of landscape, aesthetic degradation, noise, and soil contamination are imminent and quite common in the area. The people around the places where the wastes are being burnt suffer from chest-related diseases because they inhale a lot of noxious substances. As the burning activity releases toxic fumes into the air, the scavengers and residents in the area endure the burden of chocking brought about by contaminated air. In these places, radioactive fumes and fire hazards from the E-wastes are not only devastating for nearby citizens, but when Olusosun site was engulfed in massive fire that raged for weeks, the disaster left in its wake the appearance of blankets of soot and dark clouds over the area in 2018. In the process, the scavengers who built tents therein were forced to flee for their safety. Despite the scale and extent of decreasing water quality, and hydrological stress, the incidence of fire outbreaks has amplified and contributed further to the deterioration of a heavily polluted ecosystem [43]. Furthermore, the ground water near the dump site has been found to be heavily concentrated in high lead levels, above the permitted values for drinking water by Nigeria’s standards organization. Exposure to toxic E-waste substances has been linked to thyroid dysfunction and spontaneous abortions in pregnant women and the long-term results include DNA damage in the area.
3.3. GIS Mapping and Spatial Analysis
The GIS analysis covers the visual presentation of spatial patterns showcasing different dimensions indicating the E-waste trade. This includes the geographic scope illustrating the activities, risks, events, and locations at the heart of transboundary phases of transactions germane to the flow in discarded electronic materials at regional, city, national and global scales with relevance to the study area. While the analysis pinpoints the routes involved in the movement of the materials, the clusters of at-risk areas, the set of ecological indicators and economic parameters depicting the global North-South dichotomy of the inequity inherent in the process. From the severity of the problem in the region over the years, the info as underscored by the geo visual analytics in diverse scales embody the bleak conditions of areas facing daily liabilities in E-waste trade in many communities. The ability to trace the environmental risks of these aberrations under a GIS setting as investigative device, represents promise in analyzing the illicit movement of wastes in developing zones including West Africa. Considering the widespread penetration of E-waste materials throughout West Africa. The spatial analysis using Geographic Information Systems (GIS), provides ample opportunity to track the geographic dimensions of the noxious items. The examination revolves around varying scales at the center of the activities in the region over the years. This involves both regional, country and city levels together with the global sources of the trade as it relates to the study area. Based on the spatial distribution along regional lines in the continent of Africa under varying colors of yellow, green, orange, blue, and dark brown and the respective mass of per capita E-wastes in 2012.West Africa on the far left of the map not only accounted for 1.03 kg in per capita E-Waste. With that, the region saw a gradual spread of 40% of global E-waste dumped around a quintet of sites in the nations along the Lower South coast made up of Nigeria, Benin, Ghana, Ivory Coast and Liberia in 2015 (Fig 2-3).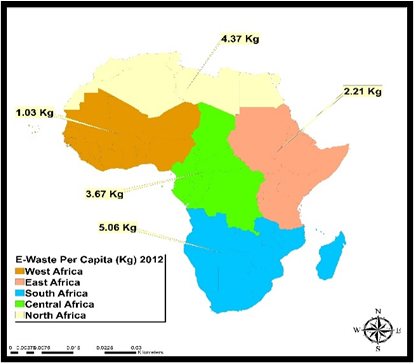 | Figure 2. E-Waste Per Capita Across African Regions, 2012 |
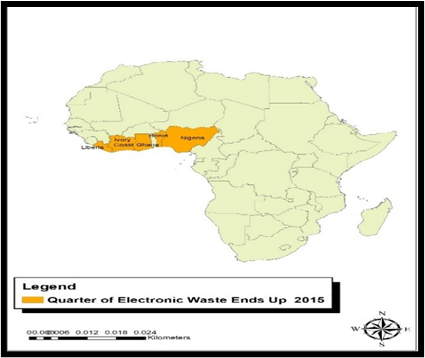 | Figure 3. The Regional Destinations of 40% of Global E-waste, 2015 |
The city and country scale of the E-Waste spread along the region centers on the main epicenters of the trade in the dumpsites at Agbololishe Accra, Ghana and the computer villages and adjoining scrap yards in the Lagos area of Nigeria. Given that the Ghana axis of the of analysis in Accra, involves multiple points in space designated as E-waste areas on the North East and Southern corner of the map near competing land uses such as markets frequented by citizens and nearby settlements (Fig 4). The Agbololishe area also boasts of sites designated for the dumping and burning of generated and imported E-wastes whose residues flow into the network of rivers and Lagoons with direct risks to the marine ecosystem. Of critical importance on the map are the spots deemed as weighing areas, scrap metal yard, dismantling areas and the land fill all located in North West of Agbololishe E-Waste complex close to the Gulf Guinea (Fig 5). In the case of Lagos, the situation is compounded by small geographic size of the metro and the state amidst large population centers and the influx of over half a million people yearly into an area that hosts one of the largest electronic waste graveyards in the world. With such problem at hand, note that of the seven major dump sites in the state, most of them are tightly located near to the mainland end of the city. These consists of the first three referred to as West minister, Alaba and Lawanson followed by the remaining four (Ikeja computer village, Ojota Scrap market, Soluisi and Oluoson dumpsites). With these E-waste dump sites mostly active in the high density South West part of the city, coping with the associated environmental stress takes center stage. This is in lieu of the large concentration of huge E-waste dump sites in the heart of heavily populated residential zones and other land uses close to the Lagoons and waterfronts vulnerable to toxic residues and runoffs from burnt E-wastes in the sites as displayed in the map (Fig 6). Conversely, the dumping of imported wastes into the seven designated sites in the city of Lagos are facilitated by the proximity and access to the major ports, where majority of used items from overseas find their way to the local E-waste sites. With these dumps sites nearby to navigable water ways as shown in the maps, the spatial configurations as visualized reinforce the close connections between imported wastes sources, Lagos ports, and the internal destinations (dumpsites) where they are discharged and the surrounding ecology and human settlements (Fig 6).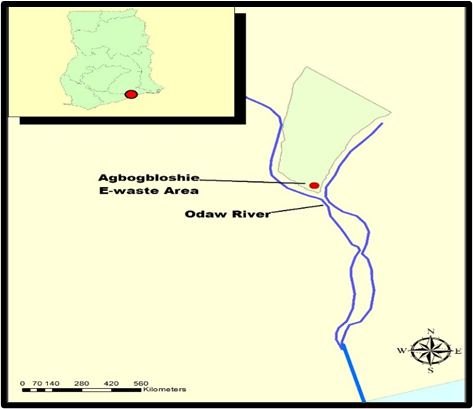 | Figure 4. E –Waste Dump Sites in Agbololishe, Accra |
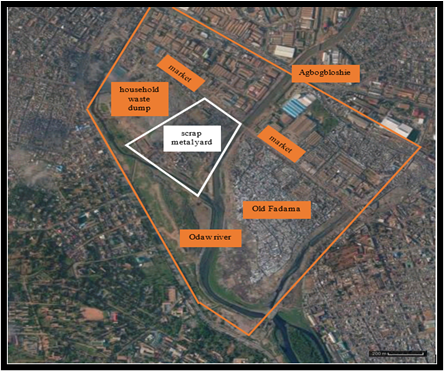 | Figure 5. Agbololishe Dump Sites and Adjoining Land Uses |
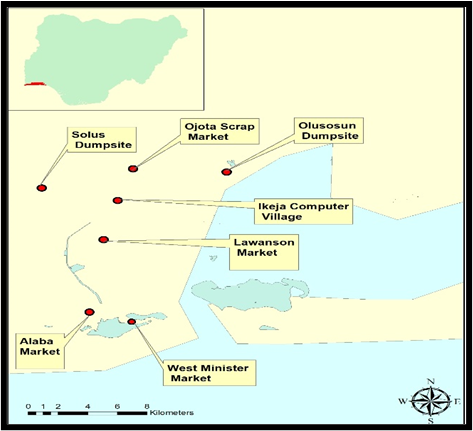 | Figure 6. E-Waste Dumpsites and Proximity to Lagoons, Lagos |
The countries and cities in the study area of West Africa would not be at the receiving end of the dilemma of dealing with unwanted E-waste from elsewhere if not for the global scope of the trade built on notoriety and deceptions directed at the receiving nations of the zone since 2015. Considering the notorious nature of the trade and the fact that the materials involved come from outside the continent of Africa. The geographic network of these illegal transactions transcends multiple points in the globe identified as known source, known and suspected destinations represented in green, yellow, and orange colors across different continents like the Americas, Europe, Australia, Asia, and Africa (Fig 7). From these locations, the E-wastes are laundered clandestinely from sources in the west to the global Southern Hemisphere under distinct guises to the respective destinations until they end up in places in West Africa like Nigeria (Fig 7). For that, the export of the E-Wastes into West Africa from the information on the map highlights the movements from sources in North America and Europe with West European shipments moved to targeted areas in the West African nations of Nigeria, Benin, Ghana, Ivory Coast and Senegal (Fig 8).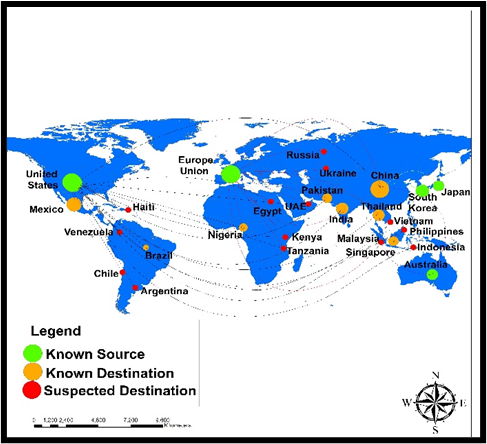 | Figure 7. Global Sources and Destination Routes of E-Waste |
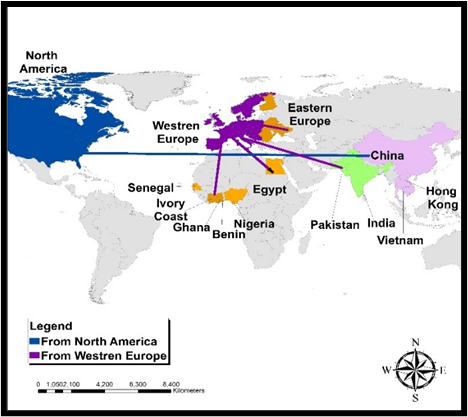 | Figure 8. Global Export of E-Waste and Transit Points |
Notwithstanding, the biased nature of these inhumane transactions, the attractions of the nations and cities in the global south including Nigeria in the West African region, comes partly from the huge disparities in the worldwide distribution of micro economic indicators like GDP (Fig 9). With these nations at the lower end of the economic spectrum, they are pressured at all costs due to their dire situations rooted in poverty, mass deprivations and lack of opportunities to accept wastes (Fig 9). This in turn compels them into accepting the unwanted fate as final destinations which is some form of global environmental injustice (Fig 9). 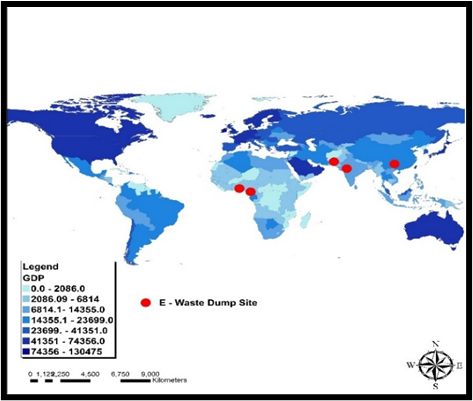 | Figure 9. GDP and E-Waste Dump Sites In the Global South |
3.4. Factors Responsible for E-Waste Trade Activities
Regarding the factors triggering unauthorized dumping of E-waste by foreign sources onto the West African region, they do not occur in isolation. They are associated to some extent with a host of policy, socio-economic and physical-environmental factors. These forces are described fully in the next paragraphs.
3.4.1. Policy Contradictions and Ineffectiveness
Being a major source, the EU regulates how E-wastes should be treated and processed and restricts export destinations. Accordingly, the discarded equipment cannot be shipped to non-OECD (i.e., developing) countries for recycling and recovery but only for reuse. Yet, despite the enactment of these rules and concerns about overseas shipments, many of these wastes still end up as illegal export to the West Africa region. Given that, many nations in Africa, have few laws on E-wastes, the shady trading in used electronics evades local policies and regulatory framework in place. With such lapses, it is no secret that most transactions in 2nd hand electronic waste markets in Lagos, Nigeria, occur in settings where little time is spent on whether the item under display is tested or untested due to policy lapses. Additionally, Nigerian law bars the burning of plastic cables, acid leaching and other common methods to reclaim metals from E-wastes, however, little inclination towards enforcement and a low awareness of the risks involved, means pickers continue to expose themselves to toxins [38,44].
3.4.2. Socio-Economic Forces
Realizing that the escalating global E-waste problem seems driven by rising sales and shortening life cycles of electronic equipment. West Africa’s pace of usage together with consumer demands also contributes to the E-waste problem. Being a region where the demand for new technology across national lines coincides with city tech scene expansion and the issue of E-waste production. Over 22,000- 100,000 people employed in the sector in both Ghana and Nigeria whose dependence on the trade for daily livelihoods drives the surging operations in the respective nations [8,24,33]. With such an array of work force in place, in Ghana, the disposal of discarded electronic waste from industrialized countries has become a booming business. This reliable market for used EEE encourages imports. Also, while 80 million Nigerians live on $2 a day, the circulation of millions of digital gadgets used by 90 million citizens in the country has accelerated consumption habits and the generation of domestic E-waste. More worrying is that Nigeria’s E-waste tops those of other countries given her large population and porous borders. This is compounded by Nigeria’s over 65 million mobile phone subscribers, whose activities contribute to the country’s growing E-waste. Added to that, the harsh economic pains in many nations in the zone creates a dilemma for regulators who are reluctant to ban E-waste out of fear of mass discontent hence the continual trade. Even though E-waste peddlers bypass the legitimate global waste and recycling market, the sector’s estimated yearly worth of $410 billion remains a major attraction [44].
3.4.3. Physical and Environmental Elements
Just as E-waste is comprised of small amounts of valuable metals like high-quality copper, gold, silver, and palladium. There exists a massive scramble for the endless and desperate search for rare earth mineral(s) components in E-wastes. This means that despite being thrown away in the west, junk electronics are raw materials for waste processing firms. Since old computers are literally regarded as a ‘gold mine’: a metric ton of scrap from used computers contains more gold that is of immense value to scavengers [23,24]. Aside from the vast presence of precious metals (gold or copper) as contained in discarded electronics items together with recyclable rare earth metals [44]. In the global south zones like the study area, E-waste is not treated to the same standard as in developed countries and there are often risks. This leads to poor treatment or processing techniques prompting the release of hazardous chemicals that threaten built communities and the environment. Given the maritime nature of the zone and the fact that the location of Lower West African region is characterized by quick proximity to the Gulf Guinea and the Atlantic Ocean. The presence of shared borders through operational airports and seaports provides easy access for the export and movement of E-wastes from Europe, the US and other regions of the world and Africa into final destinations. For, that the physical element of location, ports and the free movement of goods among nations as enshrined in the regional trade agreement under the Economic Community of West African State (ECOWAS) makes the flow of discarded electronics via neighboring nations to the another very possible. This is in turn facilitates the recurrent movement of the items into dump sites in the region.
3.5. Efforts and Initiatives
Seeing the susceptibility of the nations in West Africa to the high risks of environmental pollution and health hazards emanating through coordinated flow of E-waste from foreign sources. Various collaborative measures are being put into place between local, multilateral, and international agencies to mitigate the menace of E-wastes exports into the region.
3.5.1. The Local and Global Measures
Considering how problems of soaring electronic waste, or E-waste dumping, suffocate nations in the west African region. The United Nations Environment Program (UNEP) promulgated guidelines to safeguard both community welfare and economic dependence in reused electronics. More so, The UN Environment Program's Basel Convention followed a similar path with official backings for the financial prospects emanating from E-waste so long as these items undergo appropriate disassembling and reuse. The convention also affirms the obligation of governments of African nations to return E-waste deliveries in their territories directly to places of provenience. Among the countries in the region, Nigeria’s National Environmental Standards and Regulation Agency (NESREA) has put into place various initiatives to confront E-waste problem by imposing numerous regulations and guidelines to check the import of utilized EEE. A case in point is the National Environment Act of 2011, which specifies life sentence for producers and peddlers of toxic waste. In that way, the organization coordinates with Interpol, the United States Environmental Protection Agency, and associated groups to eradicate E-waste shipments.From the issues at stake, the government of Nigeria teamed up jointly with the Global Environmental Facility (GEF) and UN Environment Program (UNEP) to introduce a rounded and re-useable market dedicated to electronic items in the nation. The $15 million (£12 million) effort focuses on an outright elimination of the unlawful management of digital waste within the nation, linking multi stakeholders drawn from state agencies, the industry, and Non-Profit Organizations. With the program intended to advance the reprocessing of serviceable electronic parts, while too creating techniques for the discarding of non-serviceable and noxious waste [45]. There is an emphasis on gathering and processing and removal of over 270 tonnes of E-waste. Elsewhere, under the Switch Africa Green project in Ghana, the UNEP, the Environmental Protection Agency, and Ghana’s National Cleaner Production Centre, executed a plan on electronic waste. In the process, the group designed the Ghana E-waste model which prompted the foundations of the Hazardous and Electronic Waste Control and Management Act (2016). This enabled the authorities in Ghana to organize the structure of a key E-waste reprocessing facility at Agbogbloshie. Additionally, the Pan-African Forum on E-Waste in Nairobi approved a 'Call to Action', that plans 8 urgent sections to expand the ecologically comprehensive administration of E-waste in the continent. These encompasses the action and execution by African nations of global laws like the Basel Convention on the Control of Transboundary Movements of Hazardous Wastes and their Disposal and the Bamako Convention, that prohibits the delivery of toxic junk into Africa, the design of nationwide structures to enhance the picking, reprocessing, transference, packing and removal of E-waste and the cooperation between various organizations including interest groups from the UN to industry and NGOs [46,47,48].
4. Discussion
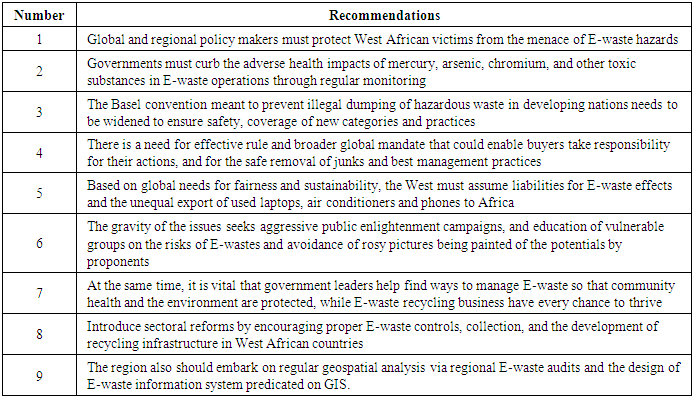
The paper shows that in an era of unprecedented advances in computer software and information technology, the leftovers and discarded items from affluent nations continue to drive the build-up in E-wastes trade in the global South. The study area known for its vast commodity markets, now finds itself at the unsought side as the graveyard of illicit trade in noxious E-waste despite the threats to susceptible citizens. Notwithstanding the common economic argument by proponents of used electronic items who often tout it as fiscal gold mine. Many of the initiatives adopted by multilateral organizations regarding the standards and benchmarks regulating the movement of electronic waste, still have not done enough to stem the tide of the nuisance in the form of environmental risks, community exposures to toxins and the resultant ailments among victims. Considering the unhindered flow across international borders in the zone amidst the hypocrisy in the EU and the OECD nations. The human tragedy of the situation in West Africa especially in Ghana and Nigeria have reached levels where toxic fumes from burning E-wastes are suffocating people and sending young scavengers much early to their graves. Even at that, the sad thing about this ordeal which city residents now detest centers on the nuisance from large presence of gigantic E-waste stockpiles spread across towns in the zone.Realizing the liabilities at stake, the timely assessment of environmental risks from electronic waste dumping in West Africa as worthy research endeavor using secondary data connected to mix scale model of GIS and descriptive statistics as tracking tools affirmed the dominance of Nigeria in all indicators (rankings, production, and imports) compared to the other nations. The regional profile of the calamity not only provided better insights for mitigating the emergent concerns in the affected countries. But the citizens therein have long suffered the unwelcome ordeals of E-waste consignments through Europe and the United states with harmful impacts on the environment. Convinced that the dumping of E-wastes in West Africa constitutes some form of global environmental injustice considering the places of provenience. The fallout located within the larger global and regional structure emanates from a host of socio-economic, policy, demographic, and environmental and physical factors. These forces influence the distribution, usage, production, export of electrical and electronic equipment waste market in West Africa. Realizing that mix scale tools of descriptive statistics and GIS underpinned the existing connections between the factors and the frequency, consumption, and capacity of E-waste flow in the study area. The temporal-spatial display of the volume of waste indices, embody visible geographic forms aimed at indicating the global sources of the transaction at city, national continental, and regional scale. The configuration also denotes the actual activities, routes, and the ecosystem risks posed to the West African region. Being a measure of the temporal E-waste audit germane to the region, they pinpointed such indices as per capita E-waste, international distribution and rankings of eventual destinations and uses coupled with the categories of E-waste in circulation, the audit of imported and used E-waste and the generated waste. Whereas the spatial visualization presented detailed clusters and diffusion patterns of the E-waste parameters such as waste per capita across African regions, regional destinations, waste dump sites and locations, global export of E-Waste and the transit points, GDP, and E-waste dump sites in the global south. The outcome of the enquiry showed increases in the volume of E-waste dumping in the region over the years with impacts on the ecosystem coupled with public health risks. The GIS mapping of the trends identified the spatial dispersion of the risks and ecological stressors across different clusters of areas in the zone with the issues attributed to forces ranging from socio-economic variables, policy, global and legal elements. Awareness of the temporal-spatial concentration of liabilities on a handful of spots in space in that way, will make the recourse to mitigation measures a topmost priority in the region.Having come this far, part of the major takeaways in this work fully resides in the benefits of the research. Surely, the efforts herein provide a feasible approach for auditing E-waste flow from sources in the West to destinations haunted by deprivations in the global south, like West Africa. Accordingly, regional analysis of the situation in West Africa gives the committee of nations opportunities to develop long term plans for unlocking and eradicating the negative E-waste trade practices from rich nations at the center of the debacle. Despite the nefarious ways of laundering E-Wastes to West Africa, the surge in local sources and the impacts as uncovered puts the burden for more action on the governments of respective nations in the ECOWAS region, so that vulnerable citizens are not continuously left worse off amidst an unending catastrophe. For that, the enquiry drove home the point that the pomp and pageantry of distant lifestyles based on rapid innovations and acquisitions of electronic gadgets constitutes a menace to the wellbeing and ecology of West Africans. Consequently, illegal peddling in countless volumes of E-waste to poor nations lacking the capacity to reject them from the rich, symbolizes a moral evil. To remedy the issue, the paper proffered various solutions such as effective laws, regular monitoring, sectoral reforms, public enlightenment programs and the design of a regional E-waste information system. For more see Table 8 in Appendix A.
5. Conclusions
This enquiry assessed the state of E-wastes distribution through trade and illegal dumping of items moved from affluent nations into the West African region known for is diverse ecosystem. The zone is fast becoming a graveyard for discarded electronics with notable outcomes under the following captions. a) Hub and graveyard for imported E-wastes; b) locally generated items becoming substantial; c) impacts evident in the zone; d) the build-up in E-waste triggered by many factors; d) mix-scale method effective.Based on the research findings, the study area of West Africa within a very short span has emerged as a chosen electronic graveyard. As a hub, it is threatened by the unwanted flow of much of the imported E-waste heaped on many big cities across countries in the region. With the EU and the UK amongst western sources responsible for 1.5 MT to 11.6 MT E-wastes deemed higher than West Africa’s total output. The severity of the situation has reached frightening proportions given the loopholes in the receiving nations that allow illegal imports of E-wastes without detection. For that, during the fiscal years 2009-2010, some of the major nations in West Africa particularly (Nigeria, Ghana, Ivory Coast, Benin, and Liberia) at the center of trade, accounted for ¼ of all E-waste imports in the globe. Considering the millions of tons in imported E-wastes that changed hands during operations. The region’s average, and total values of 291,900 to 1,591,2000 MT were quite substantial. Regarding the individual distribution among the nations involved in the trade, Nigeria and Ghana saw the biggest quantities of wastes valued at 1,200,000 tonnes to 215,000 at the rates of 82.21-14.73% of the regional total. The compiling of this info for E-waste audit in the study is extremely vital in the control of transboundary movement of discarded digital materials across different areas of the world given the improper dumping from rich to poor nations in the developing south. Therefore, the enquiry remains timely as a major reference point to guide policy makers and planners charged with tracking and enforcing existing conventions pertaining to the illegal flow of E-wastes into 3rd world nations.Going by the analysis, in addition to the problems posed by foreign induced inflow of E-wastes into the affected nations. The rising level of locally generated E-wastes in West Africa has not really gone unnoticed given the entrenched forms the sector has assumed and the growing dimensions in all the measurable indicators. Aside from the region’s medium levels in per capita E-Waste production in comparison to other sub zones in Africa in 2012. As it stands and together with others in circulation, during that same year, when Ghana produced just about 38,000 Mt of E-wastes, it traded in millions of tons yearly. Further along those lines, in 2017, Nigeria as the 3rd biggest generator of E-waste in Africa accounted for 12% of the overall size estimated at over 280,000 Mt. While the other twist to the debacle stems from the growing penetration rates of 11 E-waste items from refrigerator, mobile phone, TV, and radio in 5 key nations including Nigeria and Benin republic in 2011. Out of the total generated and traded trash on the market in West Africa’s 16 nations in 2016, Nigeria during that period held over 60-50% of the transactions while its neighbors Ghana and Ivory coast, finished in mid and high single digits under both categories. From these audits, in terms of scope and depth, the amount of E-waste generation per inhabitants in 2015 which involved many nations stands as an ample testament to the growing pace of increments over the years in West Africa. Even if Ghana, Gambia, and Nigeria outpaced the rest of the nations, the belief is that such practices create a dilemma for a region already reeling from being heavily dumped on with heaps of electronic trash now contending with locally generated ones. Surely, this compounds the predicament of communities who bear the burden and exposure to the liabilities of E-waste in West Africa. Thus, the timeliness of this study in outlining the various categories of production, adds to other ways of looking at the issue in a way that could be beneficial to managers and proponents of the industry.As plainly indicated, the impacts of E-wastes dumping on West Africa’s ecosystem remains quite evident. With the vast volumes of imported and locally generated E-wastes littered all over the countries amidst a burgeoning sector that is fully entrenched. The interactions between such activities and the ecology of the nations in the West African region have far reaching repercussions on both the built and natural environment considering the scale of environment risks. To that effect, at risk sites like Accra’s Agbogbloshie and Olusosun in Lagos together with other dump sites in some of the core nations (Nigeria and Ghana) at the center of the production and import have had to deal with recurrent air, water and soil pollution, environmental health hazards of premature deaths among scavengers, the burning of toxic fumes, landscape degradation and loss of aesthetic beauty of the built environment. Looking at the physical deterioration that comes with such activities, the nuisance caused by the gigantic piles of E-waste to the physical beauty of west African cities chips aside the inherent charm, splendour and appeal originally attached to the affected towns, which lured people into them. In Lagos where ¾ of imported E-wastes are listed as antiquated and unusable with much that bound to 3 public landfills. Citizens in the nearby areas surrounded by burning wastes encounter bronchial aliments from the breathing of toxic and radioactive fumes. In the case of Agbogbloshie market area of Accra, where juvenile E-waste workers risk their lives collecting heavy metals laced with neurotoxins, and carcinogens amidst serious health consequences. The impacts seem quite shocking, considering the magnitude of scorching wastes and contaminants moving into water sources and rivers used by communities. Also, the toxicity of several key indicators like blood, urine, and maternal milk of people near the dumpsite reached elevated levels. With West Africa viewed as Sub Sahara’s major epicenter for laundered E-wastes under nefarious guises from external sources. In looking at the environmental health liabilities of E-wastes dump sites and the way they affect ordinary people and ecosystem so far. Several interest groups with stakes on the issue can build on this study for directions towards mitigation. Accordingly, the research stands out in raising awareness over the widespread effects of E-waste trade on West Africa’s environment.In Addition to what transpired all these years, a host of policy, socio-economic, global, demographic, physical and environmental elements located within the larger E-waste industry are indispensable in assessing the evolution over the years among nations in West Africa given their part in driving the surge in import, production and impacts in the region. The fact that the EU as major source has established guidelines limiting transboundary flow of E-wastes while ignoring export restrictions into West Africa amounts to double standards. Under those settings and the absence of laws regulating those practices in most countries in Africa. The dubious transactions in E-wastes thrives in the West African region as safe-haven in the face of exploitable irregularities based on loopholes, contradictions, and the infectiveness in international and local policies. Added to that, the rising demand and transactions serving consumer tastes and the entrenched nature of the sector as source of revenues has largely depended on the imports and generation of E-wastes. This was fuelled partly by the rise in the diminishing life cycles of digital possessions in the region. For that, the booming business in which lifestyles of over 100 million subscribers in Nigeria reliant on the influx of millions of digital devices has speeded the generation of local E-waste to levels synonymous with the crisis. Additionally, the accessible location of West African nations by air, sea, and the region’s attribute as a maritime zone where E-waste shipments from other places occur with ease promotes the activities. Finally, the obsession with the market value of rare earth components in most disposable electronic gadgets are difficult to resist, hence the surge in the trade. In having shown the factors fuelling the flow in E-wastes, the enquiry located the convergence of previously coordinated network of state institutions at the centre of thriving transactions in junk electronics unknown to the communities and the extent to which they influence the practices. Furthermore, the use of mix scale methods as investigative device was very efficient and very much on target. Combining descriptive statistics and GIS mapping in the model as working tools brought in fresh thoughts to the assessment of E-waste flow and production. The framework was quite efficient in delineating the study area and categorizing the patterns. This method is very essential to scholars, executives and multilateral agencies tasked with the role of embarking on the geo-spatial appraisal and monitoring of the issues arising and trends involved in transboundary movement of E-waste from the western hemisphere to 3rd world regions like West Africa. Moreover, the spatial mapping involving GIS analysis reveals a noticeable presence and spreading of E-wastes across transboundary sources around the globe from the West to destinations in developing nations particularly in areas within the West African region where import remains on the rise. With the geographic flow manifested through a range of indicators in the form of E-waste per capita across African region, the regional destinations of 40% of global E-waste, dump sites in Accra Ghana and Nigeria and the transit points via many nations, GDP, and E-waste dump sites in the Global south. Spatial visualization of the ventures across time indicates the scale and acceleration of the activities in the West African market and the risks posed to the ecology of the zone. The GIS mapping of the trends pinpointed the spatial dispersion of the risks and stressors within different clusters of areas with the problems attributed to factors ranging from socio-economic variables to global and legal forces. Appropriately, GIS mapping as a planning tool was overly useful in underscoring the concentration of E-waste indices, the pattern of their dispersion and the geographic progression. This epitomizes a key move towards better planning and tracking of activities in current schemes in a manner rarely done before considering the applicable capabilities in containing the risks posed to nations in West Africa. In so doing, the model offers opportunity for highlighting the state of the sector as system for advancing new ideas in E-waste management.
Appendix A
4.1. Recommendations Table 8. Recommendations
 |
| |
|
Appendix B
Acronym
 |
| |
|
References
| [1] | Bullard, R. D. (2008). Dumping In the Dixie: Race, Class, And Environmental Quality. Westview Press. NY: New York. |
| [2] | Yale School of the Environment. (2020 November.) Negotiating Institutional Transformation: International and Comparative Approaches to Justice in Environmental Protection. Yale University, School of the Environment. New Heaven: CT. |
| [3] | Wrona, Nicola. (2014 July). The Seven Countries Where E-Waste Ends Up. Waste Dive. Industry Dive. Online Available: https://www.wastedive.com/news/the-7-countries-where-e-waste-ends-up/290919/. |
| [4] | Breivik, Knut. (2014). Tracking the Global Generation and Exports of e-Waste. Do Existing Estimates Add up?. Environmental Science & Technology. 48: 15: 8735–8743. |
| [5] | American Chemical Society. (2014 July). Geography of Global Electronic Waste ('e-waste') Burden. |
| [6] | Riaz, Ayesha. (2016 October). Developing Countries: Electronic Waste Landfills of America US to the World – “No E-Waste in My Backyard”. Chicago Monitor. 1-5. |
| [7] | Schmidt, Charles. (2006 April). Unfair Trade e-Waste In Africa. Environmental Health Perspectives. 114:4: A232-A235. |
| [8] | Yeung, Peter. (2019 May). The Toxic Effects of Electronic Waste in Accra, Ghana. Bloomberg CityLab. 1-6. |
| [9] | Popoola, Oluseun. (2019 March). Levels of Awareness and Concentrations of Heavy Metals In The Blood of Electronic Waste Scavengers in Nigeria. Journal of health and Pollution 9:21:1-17. |
| [10] | Alabi. O.A. (2020 March). Elevated Serum Pb, Ni, Cd, and Cr Levels and DNA Damage In Exfoliated Buccal Cells of Teenage Scavengers at a Major Electronic Waste Dumpsite in Lagos, Nigeria. Biol Trace Elem Res. 194:1:24-33. |
| [11] | Ford, Tamasin. (2014 November). Ivory Coast Tackling its Toxic Mobile Waste Problem. The BBC. |
| [12] | Adeyi, A.A. (2017 September). Heavy Metals and Polycyclic Aromatic Hydrocarbons in Soil from E-waste Dumpsites in Lagos and Ibadan, Nigeria. Journal of Health Pollution. 7:7:15:71-84. |
| [13] | Fagan, Laureen. (2017 January). E-Waste In Africa: Innovative Solutions To a Pressing Global Problem. Africa Times 1-6. |
| [14] | Huang, J. (2014). E-Waste Disposal Effects On Aquatic Environment Review of Environmental Contamination Toxicology. 229:19-34. |
| [15] | Schluep, Mathias. (2010 November). E-Waste Management In Developing Countries -With a Focus On Africa. Presented at The ITU Symposium On ICTs and The Environment and Climate Change. Cairo: Egypt. |
| [16] | Akbar, Joe. (2015 April). Africa’s Electronic Graveyards Where The West Dumps PCs, Lap Tops and More. Daily Mail Online. 1-29. |
| [17] | Hossain, Sahadat. (2015 December). E-waste: A Challenge for Sustainable Development. Journal of Health and Pollution. 5: 9: 3-11. |
| [18] | Bradley, Laura. (2014 August) E-Waste In Developing Countries Endangers Environment, Locals. Environment. US News and World Report. 1-7. |
| [19] | Asampomg, Emmanuel (2015 October). Health Seeking Behaviors Among Electronic Waste Workers In Ghana. BMC Public Health. 16:15:1065. |
| [20] | Ouabo, RE. (2019 March). Ecological Risk and Human Health Implications of Heavy Metals Contamination of Surface Soil in E-Waste Recycling Sites in Douala, Cameroun. Journal of Health Pollution. 14:9:21:190310. |
| [21] | Chen, Aimin. (2011 April). Developmental Neurotoxicants In E-waste: An Emerging Health Concern. Review Environmental Health Perspectives. 119-431-438. |
| [22] | Vidal, John. (2013). Toxic E-Waste Dumped In Poor Nations, Says United Nations. United Nations University. Tokyo: Japan. 1-4. |
| [23] | Galan, Irene. (2019 June) Nigeria Turns The On Electronic Waste. United Nations Environment Program. NY: New York. pp 1-8. |
| [24] | Cann, Oliver (2019). Nigeria’s 300000 Tone E-Waste Gold Mine Drives New Circular Economy. World Economic Forum. |
| [25] | Biztech Africa. (2012). West Africa Swamped With E-Waste. Biztech Africa Johannesburg, South Africa. |
| [26] | Minter, Adam. (2016 January). The Age of Humans: The Burning Truth Behind an E-Waste Dump In Africs. Science Smithsonian 1-. |
| [27] | Yu, EA. (2017 December). Informal Processing of Electronic Waste at Agbogboloshie, Ghana: Workers Knowledge About Associate Health Hazards and Alternative Livelihoods. Global Health Promotions. 24; 4:90-98 1-2. |
| [28] | Merem, E, C. (2020 February). Assessing the Environmental Risks from Electronic Waste Dumping in the West African Region. Mississippi Political Science Association Annual Conference, Jackson, MS. |
| [29] | Olukoya, Sam. (2008 January). Environment -Nigeria: As E-Waste Dump, Lagos Imperils People. Inter Press Agency. Lagos. 1-2. |
| [30] | Oliver, Christopher. (2012 March). UN Report: Findings On E-Waste Problems In Africa. Journalist’s Resource Harvard Kennedy School of Government. 1-2 A 2011 report by the United Nations. |
| [31] | UNEP (2019a) Turning E-Waste Into Gold: The Untapped Potential of African Landfills 1-6. United Nations Environment Programme. NY: New York. |
| [32] | Ukem, E.O. (2008). Electronic Waste: A Growing Challenge In Nigeria. Global Journal of Pure and Applied Sciences 14:4: 459-462. |
| [33] | Umana, Kubiat. (October 2018). E-Waste In Nigeria: Cases, Implications and Solutions. Research Cyber 1-5. |
| [34] | Akormedi M. (2013 October-Dec). Working Conditions and Environmental Exposures Among Electronic Waste Workers In Ghana. International Journal of Occupational Environmental Health 19:4: 278-86. |
| [35] | UNEP. (2019b August). Dark Skies, Bright future: overcoming Nigeria’s E-waste epidemic. United Nations Environment Programme. NY: New York. |
| [36] | Carney, Liz (2006 December). Nigeria’s Fears E-Waste Toxic Legacy. BBC News .1-4. |
| [37] | Terekova, Tatiana. (2011). E-waste Africa project. Secretariat of The Basel Convention. UNEP/SBC. |
| [38] | United Nations University. (2018 April). Thousands of Tons of E-Waste Is Shipped Illegally to Nigeria inside Used Vehicles. United Nations University, Tokyo: Japan, pp 1-5. |
| [39] | Merem, E.C. (2020). Exploring Cocoa Farm Landuse Trends in The West African Region. International Journal of Agriculture and Forestry. 10:1: 19-39. |
| [40] | Merem, E.C. (2019). Analyzing the Tragedy of Illegal Fishing on the West African Coastal Region. International Journal of Food Science and Nutrition Engineering. 9:1: 1-15. |
| [41] | Iwenwanne, Valentine. (2019 January) Nigeria’s E-Waste Mountain. Resource Magazine. 1-9. |
| [42] | Petricia, Carla. (2017). E-Waste In Lagos Nigeria. EJ Atlas. pp 1-9. |
| [43] | Adesokun, Michael. (2016 September). Soil Pollution By Toxic Metals Near E-Waste Recycling Operations In Ibadan, Nigeria. Journal of Health and Pollution vol 6:11 26-33. |
| [44] | Daily Times. (2019 November). Dumping of E-Waste In Nigeria. 3-6. |
| [45] | Benson, Imogen. (2019 July). $15 M Initiative To Boost E-Waste Recycling In Nigeria, Resource Magazine. 1-7. |
| [46] | Biztech Africa 2018 Africa to Take Action Against E-Waste. From Online Available: https://www.biztechafrica.com/article/africa-take-action-against-e-waste/2301/. |
| [47] | E-Terra Technologies (2017). Electronic Waste Recycling Finally In West Africa. E-Terra Technologies Ltd. Yaba: Lagos Nigeria. Pp1-9. |
| [48] | Lundgren, Karin. (2012). The Global Impact of E-Waste Addressing The Challenge. International Labour Organization. Geneva: SW. |

 Abstract
 Reference
 Full-Text PDF
 Full-text HTML