-
Paper Information
- Paper Submission
-
Journal Information
- About This Journal
- Editorial Board
- Current Issue
- Archive
- Author Guidelines
- Contact Us
Journal of Health Science
p-ISSN: 2166-5966 e-ISSN: 2166-5990
2017; 7(4): 73-83
doi:10.5923/j.health.20170704.02

Obesity Increases Insulin Resistance Frequency and Risk of Cardiovascular Diseases in Middle-Aged Bangladeshi Population of Type 2 Diabetes Mellitus
 Abstract
 Reference
 Full-Text PDF
 Full-text HTML
Md. Shariful Islam 1, Md. Mesbah Uddin 2, Mesbah Uddin Ansary 1, Kazi Saiful Islam 1, Hussain Md. Shahjalal 1
1Department of Biochemistry and Molecular Biology, Jahangirnagar University, Dhaka, Bangladesh
2Ibn Sina D-Lab & Imaging Center, Dhanmondi, Dhaka, Bangladesh
Correspondence to: Hussain Md. Shahjalal , Department of Biochemistry and Molecular Biology, Jahangirnagar University, Dhaka, Bangladesh.
| Email: |  |
Copyright © 2017 Scientific & Academic Publishing. All Rights Reserved.
This work is licensed under the Creative Commons Attribution International License (CC BY).
http://creativecommons.org/licenses/by/4.0/

Middle-aged population is the key working group for the economic development of Bangladesh, overweight or obese of them frequently has type 2 diabetes mellitus. In this study, we assessed the impacts of overweight and obesity on insulin resistance frequency and the extent of cardiovascular disease risk in the middle-aged Bangladeshi population of type 2 diabetes mellitus. A total of 198 (102 male and 96 female) type 2 diabetic patients aged 35-55 years were enrolled irrespectively of their religion and socioeconomic status. All diabetic patients were divided into three groups based on their body mass index: (1) diabetic patients with normal-weight, (2) diabetic patients with overweight, and (3) diabetic patients with obesity. 42 non-diabetic subjects aged 32-50 years having no serious disease were recruited from different parts of Dhaka city as control. Insulin resistance was assessed by fasting serum insulin and the homeostasis model assessment for insulin resistance (HOMA-IR). The extents of cardiovascular disease risk were assessed through estimation of blood pressures and serum lipid profile. We observed that none of the diabetic patients with normal-weight had insulin resistance. In contrast, 6.8% diabetic patients with overweight and 13.7% with obesity had insulin resistance. Our results also showed that diabetic patients with obesity had significantly higher systolic and diastolic blood pressures than those of the non-diabetic subjects or of the diabetic patients with either normal-weight or overweight. The values of serum total-cholesterol, triglycerides (TG), low-density lipoprotein-cholesterol (LDL-C), and high-density lipoprotein-cholesterol (HDL-C) were marginally changed in the diabetic patients with overweight than those of the diabetic patients with normal-weight. In contrast, serum total-cholesterol, TG, and LDL-C levels were significantly higher while HDL-C level remained unchanged in the diabetic patients with obesity than those of the diabetic patients with normal-weight or of the non-diabetic subjects. Results suggest that obesity increases insulin resistance frequency and the risk of cardiovascular diseases in middle-aged Bangladeshi population of type 2 diabetes mellitus.
Keywords: Diabetes, Obesity, Insulin resistance, Cardiovascular disease risk, Blood pressure, Lipid profile
Cite this paper: Md. Shariful Islam , Md. Mesbah Uddin , Mesbah Uddin Ansary , Kazi Saiful Islam , Hussain Md. Shahjalal , Obesity Increases Insulin Resistance Frequency and Risk of Cardiovascular Diseases in Middle-Aged Bangladeshi Population of Type 2 Diabetes Mellitus, Journal of Health Science, Vol. 7 No. 4, 2017, pp. 73-83. doi: 10.5923/j.health.20170704.02.
1. Introduction
- Diabetes mellitus is a leading cause of death and disability worldwide [1, 2]. The global prevalence of diabetes mellitus is rapidly increasing as a result of population ageing, urbanization and associated lifestyle changes [3, 4]. The number of people globally with diabetes mellitus is projected to rise to 439 million by 2030, which represents 7.7% of the total adult population of the world aged 20-79 years [5]. Diabetes mellitus is considered as an independent risk factor for cardiovascular disease which produces severe myocardial and vascular lesions with lethal effect [2, 6]. If untreated for long-term, cardiovascular disease associated with diabetes mellitus becomes a life-threatening complication. Among patients with diabetes mellitus cardiovascular mortality accounts 43.6% of all deaths [7]. Among the two major types of diabetes mellitus, type 2 is the most common form. Insulin is necessary for the body to be able to utilize glucose for production of energy. In type 2 diabetes, either the peripheral tissues are insensitive to insulin (i.e. end organ insulin-resistance) or the pancreas does not produce enough insulin resulting in relative insulin-deficiency in the blood. In both cases, glucose builds up in the blood instead of going into cells, causing the body cells to be starved for energy [8]. In 2010, an estimated 285 million people worldwide had diabetes mellitus, 90% of whom had type 2 diabetes mellitus [3]. The prevalence is increasing in every country, and major economic, social and healthcare impacts will be seen in developing countries, as these countries are home to as much as 80% of people with type 2 diabetes mellitus [9, 10]. Bangladesh is an example of a low-resource country, where the current and the potential for a future rise in the prevalence of diabetes are a very alarming health concern. Unplanned development in the urban areas of Bangladesh has created an environment that limits physical activity. Moreover, sustained economic growth has enabled the middle class to consume higher intakes of food and to choose higher-calorie and fast-food options more frequently [11]. These rapid environmental deterioration and life-style changes are thought to contribute increased risk for cardiovascular diseases associated with type 2 diabetes mellitus among the people of Bangladesh. Obesity is a multi-factorial disease characterized by an excess of body fat. It is thought to confer increased risk for type 2 diabetes through the mechanism of associated insulin resistance [12]. Insulin resistance of skeletal muscle in individuals with type 2 diabetes mellitus is typically more severe than in simple glucose-tolerant obesity. It has been reported that obesity is an important cardiovascular risk factor in type 2 diabetes mellitus [13]. The molecular basis for the link among obesity, diabetes, and cardiovascular disease remains poorly understood. Historically, overweight and obesity were largely problems in high-income countries; however, their prevalence is increasing day by day in many low- and middle-income countries across the world [14]. Bangladesh Demographic and Health Survey (2011) reported a prevalence of 17% overweight or obesity (BMI ≥ 25 kg/m2) in adult Bangladeshi population [15]. The emergence of overweight and obesity in Bangladesh has been recognized as a major public health concern. Several previous studies focused on the prevalence of diabetes mellitus in Bangladesh along with or without assessing the risk of cardiovascular diseases. However, these studies were limited to specific urban or rural regions or to a single sex or had a small sample of patients [3, 11, 16-19]. Moreover, no previous study has been carried out to investigate the extent of cardiovascular disease risk in Bangladeshi type 2 diabetic patients having overweight or obesity. The effect of overweight and obesity on insulin resistance frequency in type 2 diabetic patients also has not been assessed. Middle-aged population is the key working group for the economic development of Bangladesh, overweight or obese of them frequently has type 2 diabetes mellitus. Therefore, the aims of the present study were to assess (1) the effects of overweight and obesity on insulin resistance frequency, and (2) the extent of cardiovascular disease risk in the middle-aged Bangladeshi population of type 2 diabetes mellitus. For these purposes, type 2 diabetic patients were recruited and categorized them into normal-weight, overweight or obese based on their body mass index. The extents of cardiovascular disease risk in either category of type 2 diabetic patients were assessed through measuring of their blood pressures and serum lipid profiles.
2. Subjects and Methods
- SubjectsThis study was conducted from July 2015 to October 2016 at Ibn Sina D-Lab and Imaging Center, Dhanmondi, Dhaka, and in the Department of Biochemistry and Molecular Biology at Jahangirnagar University, Dhaka, Bangladesh. A total of 198 (102 male and 96 female) type 2 diabetic patients aged 35-55 years who came from different parts of Bangladesh to test the status of blood glucose levels were purposively enrolled in the study irrespectively of race, religion and socioeconomic status. 42 non-diabetic subjects aged 32-50 years (22 male and 20 female) having no serious disease were recruited from different parts of Dhaka city as control. Each individual was informed about this study and enrolled only if he/she gave the consent. Type 2 diabetic patients under antihyperlipidemic medications that affect lipoprotein metabolism were excluded in this study. Pregnant women, lactating mother and type 2 diabetic patients with serious comorbid diseases such as stroke, myocardial infarction, liver cirrhosis, major surgery, renal failure were also excluded. Ethical clearance for the study was taken from the concerned Departments of Ibn Sina D-Lab and Imaging Center, Dhanmondi, Dhaka, and Jahangirnagar University, Savar, Dhaka, Bangladesh. Data collectionA questionnaire was given to all study subjects enrolled in the study and collected their relevant demographic, clinical, and medical features such as age, sex, socio-economic status, food habit, working status, smoking habit, history of diabetes, use of medications, history of serious comorbid disease etc.Anthropometric measurementsHeight: Standing height was measured without shoes using an appropriate scale (Detect-Medic, Detect scales INC, USA). Height was recorded to the nearest 5 mm. Weight: The balance was placed on a hard flat surface and checked for zero balance before measurement. Each participant was in the center of the platform wearing light cloths without shoes. Weight was recorded to the nearest 0.1 Kg. Calculation of Body Mass Index (BMI): Body Mass Index (BMI) of each participant was calculated using the following formula and expressed as Kg/m2:
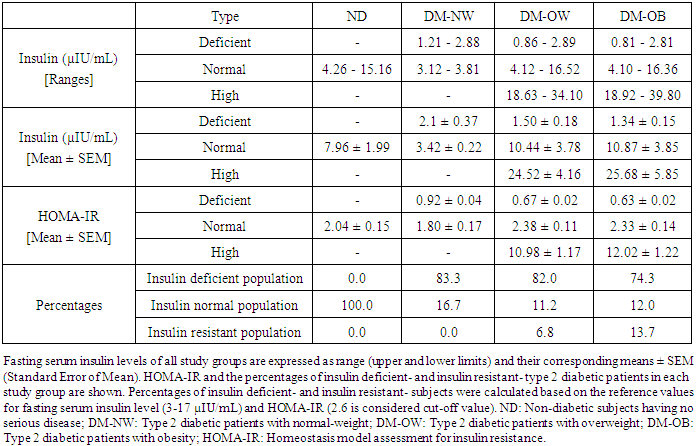
 Grouping of study participantsAll type 2 diabetic patients (n=198; 102 male and 96 female) enrolled in the study were grouped into: 1) normal-weight (n=56), 2) overweight (n=64), and 3) obese (n=78), based on their BMI [20]. Patients with BMI less than 25 Kg/m2 were considered normal-weight, equal or greater than 25 Kg/m2 to less than 30 Kg/m2 were considered overweight, and equal or greater than 30 Kg/m2 were considered obese. Age-matched non-diabetic subjects (n=42) having no serious disease were considered as control.Measurement of blood pressure (BP)Blood pressures [systolic blood pressure (SBP) and diastolic blood pressure (DBP)] were measured using a digital BP analyzer (Omron BP652N 7 Series Wrist Blood Pressure Monitor with Heart Zone Guidance and Irregular Heartbeat Detector). Blood pressure was measured in sitting position, with calf at the level of the heart. After 10 minutes of rest a second reading was taken and average was recorded. Hypertension is common in Bangladeshi population, particularly in diabetic patients. Most of the diabetic patients recruited in this study have taken antihypertensive drugs to control their blood pressures. However, none of the participants agreed to stop taking antihypertensive drugs even for a day, and therefore the impacts of antihypertensive drugs prior to the study could have not been minimized.Blood collection and storageBlood samples were collected from all participants at Ibn Sina D-Lab and Imaging Center. Blood samples after an overnight fast (8-10 hours) were collected between 7.00 am to 11.00 am. Participants were then allowed to drink glucose (75 g in 300 ml of water). They were requested not to take any food and be rested for two hours. After 2 hours of glucose intake the second blood sample was taken from each participant. After collection, blood samples were allowed to clot for 30 minutes at 4°C and serum was separated by centrifugation for 10 min at 1000 ×g (Digital centrifuge, Taiwan). Then serum samples were immediately used for laboratory tests or stored at -20°C until use. Estimation of fasting blood sugar and blood sugar after 2 hours of glucose intake Fasting blood sugar (FBS) and blood sugar after 2 hours of glucose intake (2-GTT) of each subject were estimated by enzymatic colorimetric method in Dimension ExL 200 (Siemens Healthcare Diagnostics Ltd., USA) using commercially available reagent kit (Catalog No.: DF 40, Siemens Healthcare Diagnostics Ltd., USA). Estimation of fasting serum insulin levels and assessment of insulin resistanceInsulin levels in the fasting blood serum of all participants were estimated by ELISA using human insulin ELISA kit purchased from Sigma-Aldrich (Cat # RAB0327). Absorbance for all samples after reaction procedure was taken using ELISA reader (VersaMax ELISA Microplate Reader, Danaher Corporation, USA), and then calculate serum insulin levels. The fasting serum insulin level, 3-17 µIU/mL was considered the reference range, which was preset based on 2.5 to 97.5 percentiles of the dataset obtained from healthy Bangladeshi subjects with normal oral glucose tolerance tests. Insulin resistance was assessed by fasting serum insulin and the homeostasis model assessment for insulin resistance (HOMA-IR). These are simple indirect methods for detection of insulin resistance by using fasting blood samples [21]. The validity and reliability of HOMA-IR has been established previously [21]. HOMA-IR was calculated using the following formula: HOMA-IR = Fasting insulin (mIU/L) x Fasting sugar (mmol/L)/22.5 [22]Estimation of serum lipid profile Serum lipid profile (total-cholesterol, triglycerides, low-density lipoprotein-cholesterol, and high-density lipoprotein-cholesterol) was determined in fasting blood serum of each subject using an automatic bio-analyzer (Dimension ExL 200, Siemens Healthcare Diagnostics Ltd., USA) following established laboratory methods. Estimation of serum total-cholesterol, high-density lipoprotein-cholesterol (HDL-C) and triglycerides: Serum total-cholesterol, high-density lipoprotein-cholesterol (HDL-C) and triglycerides (TG) were measured enzymatically using commercially available reagent kits (Catalog No.: DF 27, DF 48B, and DF 69A, respectively, Siemens Healthcare Diagnostics Ltd., USA). Determination of serum low-density lipoprotein-cholesterol (LDL-C): Serum low-density lipoprotein-cholesterol (LDL-C) level was measured indirectly using the following formula: LDL-C (mg/dL) = TC – [(TG/5) + HDL-C]The factor TG/5 is an estimate of VLDL-C concentration and is based on the average ratio of TG to cholesterol in VLDL. Estimation of serum uric acid levelSerum uric acid level was determined enzymatically using a commercially available uric acid assay kit (Catalog No.: DF 77, Siemens Healthcare Diagnostics Ltd., USA). In brief, uric acid, which absorbs light at 293 nm, is converted to allantoin by uricase. Attantoin is non-absorbing at 293 nm. The change in absorbance at 293 nm due to the disappearance of uric acid is directly proportional to the concentration of uric acid in the serum. Statistical analysesResults were expressed as mean ± SEM (standard error of mean). All data obtained were analyzed by student’s t-test. *P < 0.05 was considered statistically significant. Statistical analyses were performed using Statistical Package for Social Sciences (SPSS) software for Windows version 16 (IBM Corporation, New York, USA).
 3. Results
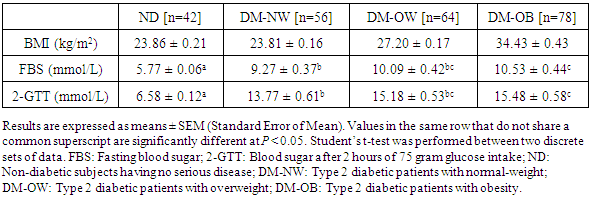
- Socio-economic status, food habit, smoking habit, working status, clinical and medical features of the participantsApproximately half of the non-diabetic subjects and half of the diabetic patients enrolled in the study came from middle class families and the other half from rich families. Most of them had heavy food and few had medium amount of food daily. Large proportion of the male participants was cigarette smoker while all the female participants were non-smoker. Almost all participants informed that they were engaged in light work in their daily life. All of the diabetic participants reported that they were first diagnosed as diabetics after ~30 years of their age and none had any serious comorbid diseases such as stroke, myocardial infarction, liver cirrhosis, major surgery, renal failure etc. All diabetic patients receive oral antidiabetic drugs daily and very few of them receive exogenous insulin. Besides, approximately 92% of the diabetic patients were under routine antihypertensive medications. None of the diabetic patients were under lipid lowering medications; as such patients were excluded in the study to properly assess the extent of cardiovascular disease risk among all three groups of the diabetic patients.Body mass index (BMI) and blood sugar levels of the participantsThe mean body mass index (BMI), fasting blood sugar (FBS) levels and blood sugar after 2 hours of glucose intake (GTT) of the participants are shown in Table 1. Both the fasting blood sugar level and blood sugar after 2 hours of glucose intake in the obese diabetic patients were significantly higher than those of the diabetic patients with normal-weight. However, no significant difference observed when compared the obese diabetic patients with the diabetic patients with overweight.
|
|
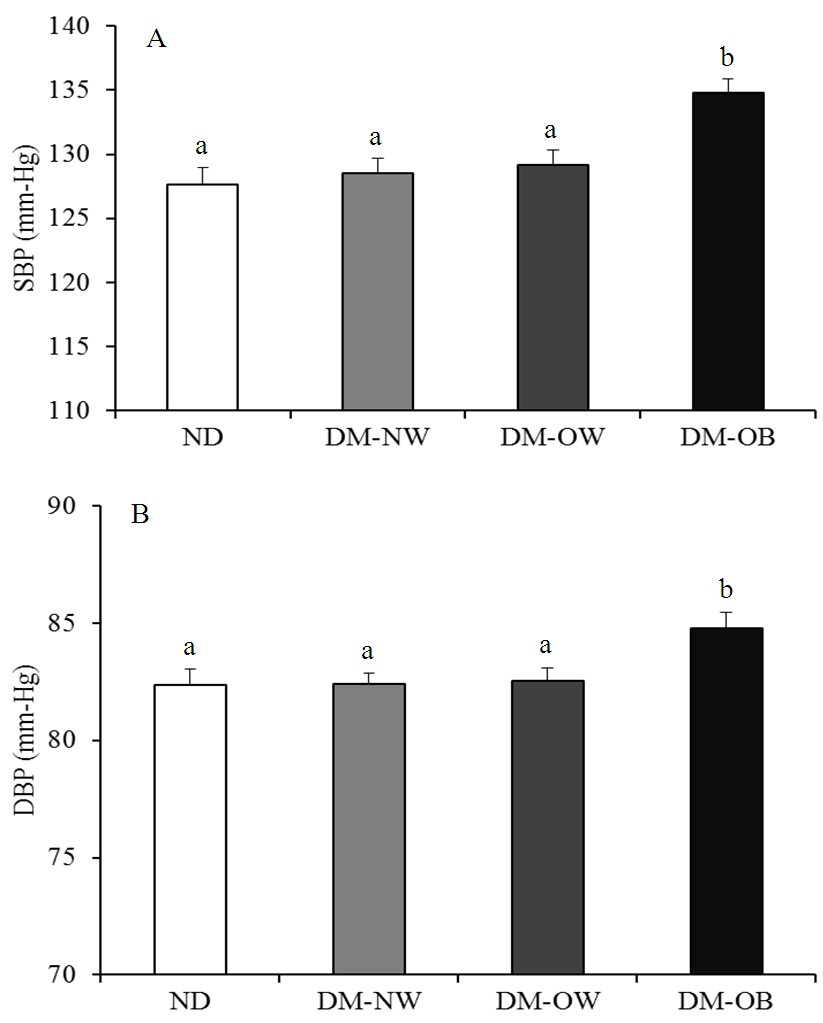 | Figure 1. Concomitance of obesity with systolic blood pressure (SBP) (A) and diastolic blood pressure (DBP) (B) in type 2 diabetic patients. Results are expressed as means ± SEM (Standard Error of Mean). Bars with different alphabets are significantly different at P < 0.05. Student’s t-test was performed between two discrete sets of data. ND: Non-diabetic subjects having no serious disease; DM-NW: Type 2 diabetic patients with normal-weight; DM-OW: Type 2 diabetic patients with overweight; DM-OB: Type 2 diabetic patients with obesity |
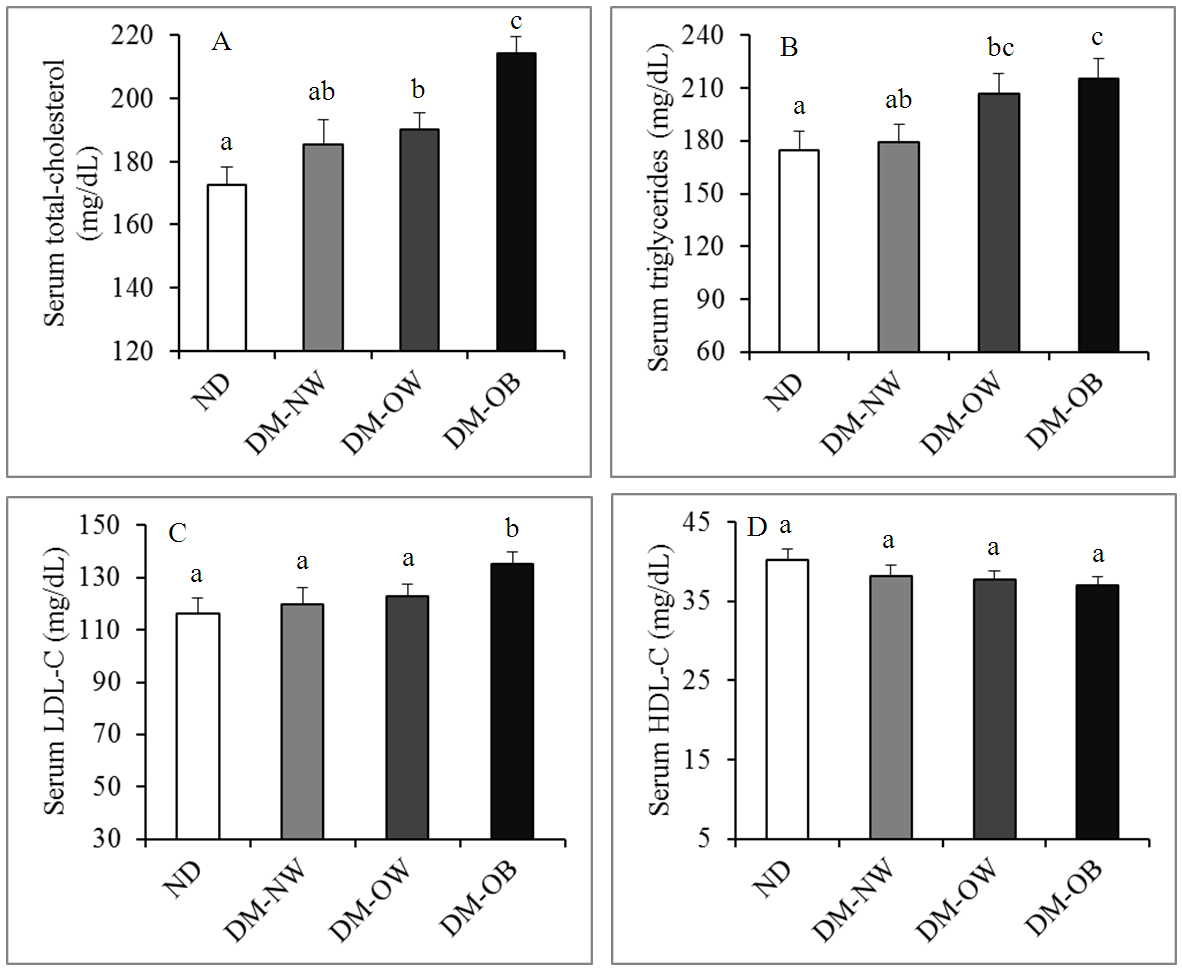 | Figure 2. Serum levels of total-cholesterol (A), triglycerides (B), LDL-C (C) and HDL-C (D) in Bangladeshi type 2 diabetic patients with normal-weight, or with overweight or obesity. Results are expressed as means ± SEM (Standard Error of Mean). Bars that do not share a common alphabet are significantly different at P < 0.05. Student’s t-test was performed between two discrete sets of data. ND: Non-diabetic subjects having no serious disease; DM-NW: Type 2 diabetic patients with normal-weight; DM-OW: Type 2 diabetic patients with overweight; DM-OB: Type 2 diabetic patients with obesity; LDL-C: low density lipoprotein-cholesterol; HDL-C: high density lipoprotein-cholesterol |
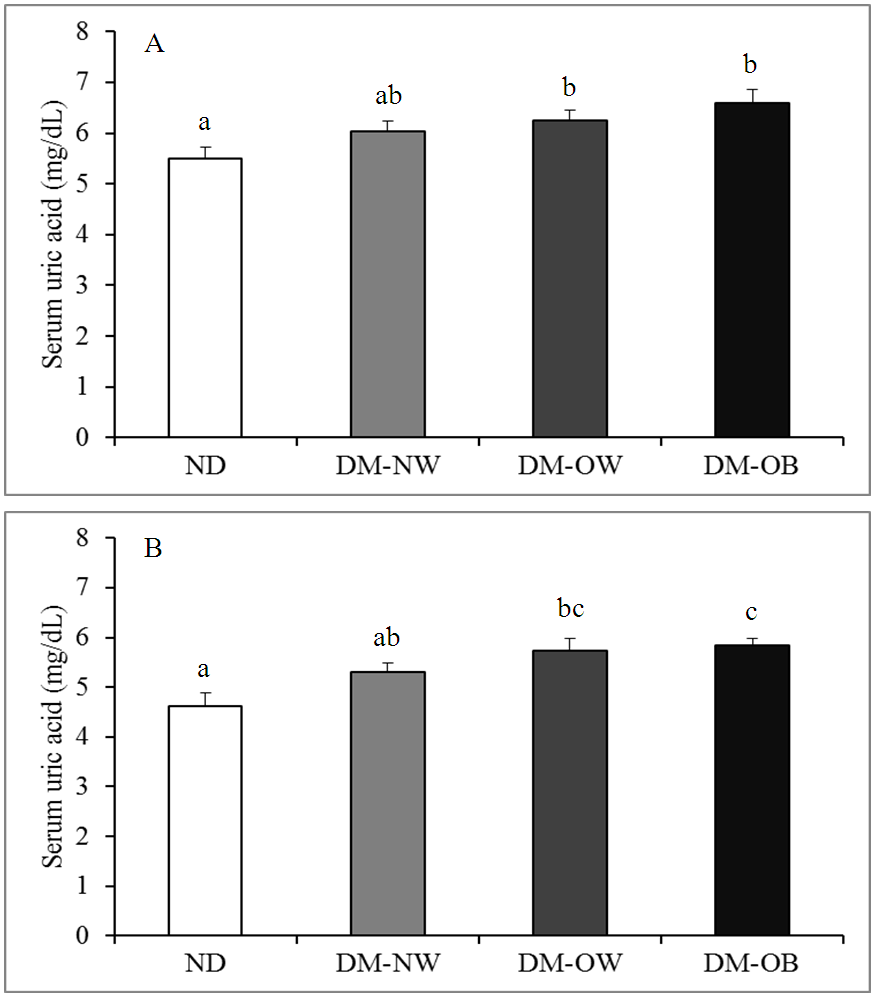 | Figure 3. Effects of overweight and obesity on serum uric acid level in type 2 diabetic male (A) and female (B) patients. Results are expressed as means ± SEM (Standard Error of Mean). Bars that do not share a common alphabet are significantly different at P < 0.05. Student’s t-test was performed between two discrete sets of data. ND: Non-diabetic subjects having no serious disease; DM-NW: Type 2 diabetic patients with normal-weight; DM-OW: Type 2 diabetic patients with overweight; DM-OB: Type 2 diabetic patients with obesity |
4. Discussion
- Type 2 diabetes mellitus has become a major global health threat in recent years, especially in the developed and developing countries. It has been reported that adults with diabetes have a 2-4 times higher risk for heart disease or stroke compared with those without diabetes [23, 24]. Obesity is an established risk factor for the development of type 2 diabetes mellitus [25]. In addition, overweight and obesity are also directly correlated with the outcomes of many noncommunicable diseases (NCDs), such as ischemic heart disease, stroke, hypertensive heart disease, and many others [20, 26, 27]. NCDs are the predominant causes of deaths in Bangladesh [28]. Defects in insulin signaling cascade i.e. peripheral insulin resistance is a fundamental element in the etiology of type 2 diabetes and is quite often associated with obesity [29]. In the present study, we assessed the outcomes of overweight and obesity on peripheral insulin resistance and the extent of cardiovascular disease risk in middle-aged Bangladeshi population of type 2 diabetes mellitus. Non-diabetic healthy subjects and type 2 diabetic patients with no serious disease were recruited in the study based on the findings of their glycemic status. We diagnosed diabetes mellitus as per international recommendation, i.e. if the fasting blood sugar (FBS) value was ≥7.0 mmol/L and 2-h post-challenge blood glucose (2-GTT) was ≥11.1 mmol/L [30]. Our results showed that levels of both fasting blood glucose and 2-h post-challenge blood glucose were significantly higher only in the diabetic patients with obesity than those of the diabetic patients with normal-weight, indicating that obesity might further deteriorate glucose uptake in the peripheral cells from circulating blood and hence the extent of diabetes. To understand whether insulin deficiency and/or insulin resistance is the contributing factor for higher levels of blood glucose in the obese diabetic patients, we estimated serum insulin of all three groups of diabetic patients. Our results showed that large proportions of the Bangladeshi middle-aged diabetic patients with normal-weight, or with overweight or obesity had insulin levels below the normal reference range, which is suggestive of insulin deficiency caused by poor insulin secretion capacity of the pancreatic beta cells. Previous report also suggested that both obesity and diabetes independently affected basal insulin levels and insulin levels in response to glucose [31]. None of the diabetic patients with normal-weight had insulin level above the reference range. In contrast, significant proportions of the diabetic patients with overweight or obesity had insulin levels either above or within the reference range. Insulin levels above the reference range along with high levels of blood sugar are indicative of peripheral insulin resistance in the diabetic patients. This phenomenon of insulin resistance was confirmed by the homeostasis model assessment for insulin resistance (HOMA-IR) [21]. In view of that, Bangladeshi middle-aged diabetic patients with either overweight or obesity had greater insulin resistance frequency when compared with that of the diabetic patients with normal-weight. This is consistent with the fact that the development of obesity is an important factor portending the development of hyperinsulinemia and insulin resistance [12, 32]. Insulin resistance represents a major underlying abnormality driving cardiovascular disease, the major cause of morbidity and mortality in much of the world [33]. Type 2 diabetes mellitus and high blood pressure are strongly linked with each other; high blood pressure can increase the risk of cardiovascular complications [34]. To evaluate whether overweight and obesity might have influence to increase blood pressures and hence the risk of cardiovascular diseases, we measured blood pressures of all three groups of type 2 diabetic patients, as well as, non-diabetic subjects. Our results showed that the levels of both systolic and diastolic blood pressures were slightly higher (127.66 ± 1.33 and 82.34 ± 0.71 mm-Hg, respectively) in the non-diabetic subjects than the internationally accepted limits for adults (90-119 and 60-79 mm-Hg, respectively) [35]. Prehypertension is characterized by systolic blood pressure 120-139 mm-Hg and diastolic blood pressure 80-89 mm-Hg for adults [35]. Therefore, most of the non-diabetic subjects enrolled in the study might have prehypertension and they were unaware of it. Both the systolic and diastolic blood pressures in the diabetic patients with obesity were significantly higher, while marginally but not significantly higher in the diabetic patients with overweight or normal-weight as compared with those of the non-diabetic subjects. This result supports the previous report that blood pressure levels are on an average higher among individuals with diabetes than the individuals without diabetes [34]. Although increased, however, the mean values of both the systolic and diastolic blood pressures in all three groups of the diabetic patients were within the internationally accepted limits for prehypertension [35]. This could be due to the fact that approximately 92% of the diabetic patients enrolled in this study were under treatment of antihypertensive drugs; otherwise blood pressures could have been higher than the limits of prehypertension. When compared among the three groups of diabetic patients, we observed significantly higher systolic and diastolic blood pressures in the obese patients than the patients with either normal-weight or overweight, supporting that visceral obesity is associated with high blood pressure [36, 37]. Thus, obesity might have influence, at least to some extent, to increase blood pressures and hence increases the risk for cardiovascular diseases in Bangladeshi middle-aged type 2 diabetic patients. Then, we estimated serum lipid profile as the parameter of cardiovascular disease risk in type 2 diabetic patients. We observed that serum total-cholesterol level was significantly higher in the diabetic patients with obesity while marginally but not significantly higher in the diabetic patients with overweight when compared them with the diabetic patients of normal-weight. This result indicates that obesity might have influence to increase serum total-cholesterol level in Bangladeshi middle-aged type 2 diabetic patients. The mean serum TG level of the non-diabetic subjects enrolled in the study was 174.72 ± 10.38 mg/dL, which is higher than the internationally accepted reference value of TG for adults (<150 mg/dL) [38, 39]. This could be due to the regional difference of reference value for TG or it is likely that although they were non-diabetic, most of them had hypertriglyceridemia and were unaware of it. Otherwise their serum TG level could have not been higher than the reference value. The serum level of TG in all three groups of the diabetic patients was higher than that of the non-diabetic subjects. TG is increased in type 2 diabetes, most often due to the increased secretion of VLDL particles by the liver rather than to the impaired clearance of VLDL by the reduced amounts of lipoprotein lipase [40, 41]. Our results also showed that type 2 diabetic patients with obesity had significantly higher while the diabetic patients with overweight had higher but not significantly different level of serum TG when compared with that of the diabetic patients with normal-weight. Thus, obesity and to some extent overweight could upsurge the risk of cardiovascular diseases in middle-aged Bangladeshi population of type 2 diabetes mellitus. LDL-C often deposits excess cholesterol in the walls of blood vessels. An elevated level of serum LDL-C promotes atherosclerosis and consequently increases cardiovascular disease risk [42]. Hence, we estimated serum LDL-C level in all three groups of diabetic patients, as well as, in non-diabetic subjects. We observed that serum LDL-C level in the diabetic patients with obesity was significantly higher, while marginally but not significantly higher in the diabetic patients with normal-weight or with overweight when compared with that of the non-diabetic subjects. Our results also showed that only type 2 diabetic patients with obesity had significantly higher serum LDL-C level than that of the diabetic patients with normal-weight, which further confirming that obesity could increase the risk of cardiovascular diseases in type 2 diabetes mellitus. The increased level of serum LDL-C could be due to the decreased clearance of LDL from the circulating blood. However, how obesity deteriorates LDL clearance from the blood in type 2 diabetic patients needs to investigate.We also observed that middle-aged Bangladeshi type 2 diabetic patients with normal-weight or with overweight or obesity had slightly lower level of serum HDL-C as compared with that of the non-diabetic subjects. The lower level of serum HDL-C indicates fewer clearance of cholesterol from the circulating blood into the liver. Low level of HDL-C along with high level of serum LDL-C predispose to premature atherosclerosis [42, 43]. However, there was no significant difference in serum HDL-C level among the three groups of diabetic patients, which indicates that neither overweight nor obesity significantly affects serum HDL-C levels in the diabetic patients. The HDL-C results obtained are somewhat different from the results obtained for serum total-cholesterol, TG and LDL-C; and the exact reason behind this dissimilarity is not clearly understood.There is a positive association between high serum uric acid levels and diabetes mellitus [44-47]. High amounts of uric acid in the blood can lead to gout. Previous studies have also demonstrated a strong relationship between serum uric acid levels and coronary heart disease (CHD), with some studies suggesting that uric acid may be an independent risk factor for cardiovascular diseases [48-51]. Therefore, we also estimated serum uric acid level to investigate whether overweight and obesity in diabetes mellitus could heighten the complication of gout and the risk of cardiovascular diseases. The reference value for serum uric acid is different for male and female [52]. Thus, we separately estimated serum uric acid levels in male and female of all three groups of type 2 diabetic patients. Our results showed that there was marginal but no significant difference in serum uric acid levels among the male type 2 diabetic patients with normal-weight or with overweight or obesity. In contrast, serum uric acid level was significantly higher in the female diabetic patients with obesity when compared with that of the diabetic patients with normal-weight. Thus, obesity could be damaging to deteriorate the complications of gout and also to upsurge cardiovascular disease risk in Bangladeshi middle-aged female population of type 2 diabetes mellitus. However, the reasons behind the divergent effect of obesity on uric acid and hence the complication of gout and cardiovascular risk in male and female diabetic patients remain unclear.
5. Conclusions
- Bangladeshi middle-aged populations of type 2 diabetes mellitus have increased cardiovascular disease risk compared with those without type 2 diabetes mellitus. Obesity and to some extent overweight further worsen their risk for cardiovascular diseases. Thus, coexistence of obesity and diabetes mellitus is a major threat to public health in Bangladesh and the biggest impact is on adults of working age. It is therefore necessary for the government to give emphasis on awareness build up in the people about obesity and its damaging consequences on health either individually or in association with diabetes mellitus.