-
Paper Information
- Previous Paper
- Paper Submission
-
Journal Information
- About This Journal
- Editorial Board
- Current Issue
- Archive
- Author Guidelines
- Contact Us
Journal of Health Science
p-ISSN: 2166-5966 e-ISSN: 2166-5990
2012; 2(6): 57-63
doi: 10.5923/j.health.20120206.02
Lipoprotein (a) and Other Dyslipidemia in Saudi Children with Nephrotic Syndrome (SSNS and SRNS)
 Abstract
 Reference
 Full-Text PDF
 Full-Text HTML
Jameela A. Kari1, Manal Tashkandi2, Amina M. Medhat2, Sawsan O. Khoja2, Kholoud S Ramadan3
1Department of Pediatrics, Faculty of Medicine
2Faculty of Science, King Abdulaziz University, Jeddah, Saudi Arabia
3Ain Shams University
Correspondence to: Kholoud S Ramadan, Ain Shams University.
| Email: |  |
Copyright © 2012 Scientific & Academic Publishing. All Rights Reserved.
Hyperlipidemia is commonly associated with nephrotic syndrome (NS). We have investigated lipoprotein (a) [LP (a)] level and other lipid abnormalities in Saudi children with primary nephrotic syndrome (steroid sensitive and steroid resistant NS). Thirty eight children with primary nephrotic syndrome who were followed up at King Abdulaziz University in Jeddah were recruited for the study on second half of 2009. Their mean age ± SD =8.76± 3.8 years. They were classified into group 1; steroid sensitive nephrotic syndrome (SSNS), group 2; steroid resistant nephrotic syndrome in remission (SRNS®), group 3; SRNS not in remission , and compared them with 27 controls of normal children. Serum creatinine, serum albumin and fasting serum lipids were measured in all patients. In addition urine protein was measured on the same day of blood samples. There was a significant increase in cholesterol, triglyceride and low density lipoprotein (LDL) concentrations in SRNS as compared to controls, SSNS and SRNS®. All groups showed a significant increase in high density lipoprotein (HDL) levels. There was a significant increase in LP (a) level (P < 0.001) in SRNS group and in SSNS group (P< 0.05) compared to control group. However, a non significant increase (p=0.06) was observed in SRNS® group. No significant changes were observed in apoprotein A1 (Apo AI) and Apo B levels between group 1, group 2, group 3 and the control group. In the SRNS group; there was positive correlation between cholesterol and triglyceride, cholesterol and LDL and triglyceride and Apo B. There was negative correlation between cholesterol and albumin, triglyceride and albumin and LDL and albumin. In conclusion, SRNS in children was associated with high LP (a) and dyslipidemia which was not completely normalized in children who achieved remission.
Keywords: Hyperlipidemia, Nephrotic Syndrome, Dyslipidemia, SRNS, Apoprotein A1
Cite this paper: Jameela A. Kari, Manal Tashkandi, Amina M. Medhat, Sawsan O. Khoja, Kholoud S Ramadan, "Lipoprotein (a) and Other Dyslipidemia in Saudi Children with Nephrotic Syndrome (SSNS and SRNS)", Journal of Health Science, Vol. 2 No. 6, 2012, pp. 57-63. doi: 10.5923/j.health.20120206.02.
Article Outline
1. Introduction
- Hyperlipidemia is commonly associated with heavy proteinuria that it has come to be regarded as an integral feature of the nephrotic syndrome (NS) (1). Raised total plasma cholesterol and low density lipoprotein (LDL) concentration is the commonest abnormality seen, but plasma triglyceride and very low density lipoprotein (VLDL) levels may also be elevated, particularly in patient with heavier proteinuria (2). It is believed that hyperlipidemia of NS is multifactorial in origin and that the altered catabolism of LDL may be important in predisposing these subjects to premature atherosclerosis (3).It was reported that most patients with nephrotic syndrome have elevated level of LP (a) concentrations (4). The high levels of LP (a) in nephrotic syndrome could cause glomerular injury as well as increasing the risk for atherosclerosis and thrombotic events associated with thisdisorder (5).The explanation of this observed dyslipidemia is that in NS, there is an increase in the synthesis of both triglyceride and cholesterol. The precise stimulus for enhanced hepatic lipoprotein synthesis in NS is unknown. It may be related directly to hypoalbuminemia, because in both nephrotic patients and rats, albumin infusion normalizes plasma lipid and lipoprotein levels. However, dextran and other oncotically active macromolecules are equally in this regard, which suggests that a decrease in plasma oncotic pressure may be more important trigger to increase lipoprotein production by the liver (6)In this study we compare the level of Lp (a) and other lipids in Saudi children with steroid resistant nephrotic syndrome (SRNS) compared with children with SSNS, SRNS® in remission and control group of normal children.
2. Patients and Methods
2.1. Patients
- All children with primary nephrotic syndrome, who were followed up at paediatric nephrology clinic at King Abdulaziz University Hospital during the second half of 2009, were recruited for this study. Inclusion criteria included a diagnosis of nephrotic syndrome depending on clinical and laboratory criteria (proteinuria +3 or more and low serum albumin < 25g/L) (7) and normal kidney function. Children with congenital nephrotic syndrome or secondary nephrotic syndrome were excluded from the study, as well as children with renal impairment. Thirty eight children fulfilled the criteria, 21 males and 17 females, their ages ranged between 4-16 years old with mean age± SD (8.76 ± 3.8 years). Parents of recruited children signed a consent form to approve the inclusion of their children in the study.Studied children were classified according to their response to prednisolone, serum albumin level and proteinuria into three groups: • Group 1: steroid Sensitive Nephrotic Syndrome (SSNS), 13 children with mean age ± SD= 9.2 ± 3.49 years: defined as responding to prednisolone therapy within four weeks of treatment with negative or trace proteinuria and of serum albumin above 35g/L.• Group 2: Steroid Resistant Nephrotic Syndrome in remission (SRNS®), 11 children with mean age ± SD =10.1± 4.35 years, with SRNS who achieved remission by other immunosuppressive drugs such as cyclophosphamide, cyclosporine or mycophenolate mofetil (MMF). The remission was defined as proteinuria negative or trace and serum albumin above 30g/L.• Group 3: steroid Resistant Nephrotic Syndrome not in remission(SRNS) or , 14 children with mean age ± SD= 7.71 ± 3.91 years: defined as non-responding after four weeks of prednisolone therapy with proteinuria≥+2 and serum albumin < 30g/L. This group did not achieve remission by other immunosuppressive therapy and continued to be in nephrotic status. • Group 4: A control group of normal children was also included in the study consisting of 27 children with matching age (10.1± 3.18 years) p value= 0.34. Consents were also obtained from their parents.Children of group 1 (SSNS) and group 2 (SRNS®), were recruited after being in remission for at least 4 weeks.
2.2. Methods
- A blood sample (3ml) was collected from every child in a plane tube without anti coagulant after an overnight fast of at least 8 hours. Serum was immediately separated by centrifugation at 3500 rpm for 5 minutes at room temperature and kept at -20 º C until used.The serum concentration of cholesterol, triglyceride, HDL, LDL, albumin, creatinine and total proteins were determined by automated enzymatic procedure using dimension instrument (Dimension clinical chemistry analyser, USA). Solid phase capture sandwich enzyme linked immune sorbent assay (ELISA) (AlerCHEK, Inc, USA) was used to determine serum LP (a), serum Apo AI and serum Apo B concentrations.First morning urine sample was also collected from all patients as well as the control group. Proteinuria was measured using urine dipstick. The study was approved by the research ethical committee of the medical college of King Abdulaziz University. Statistical Analysis: Results were expressed as mean + SE. ANOVA test was used to compare between different groups. Regression analysis was used for correlation. P value < 0.05 was considered as significant and<0.01 as highly significant.
3. Results
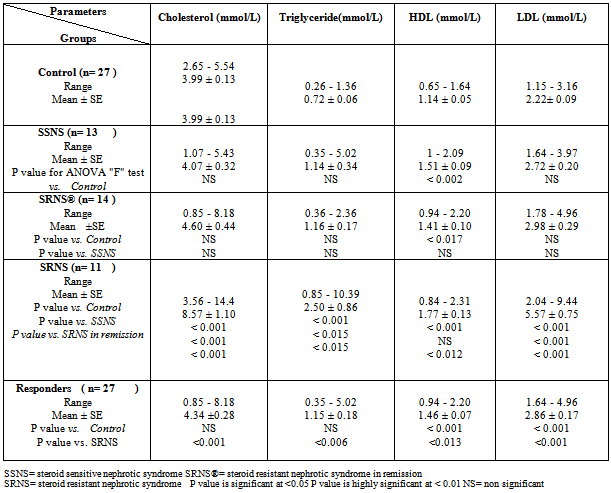
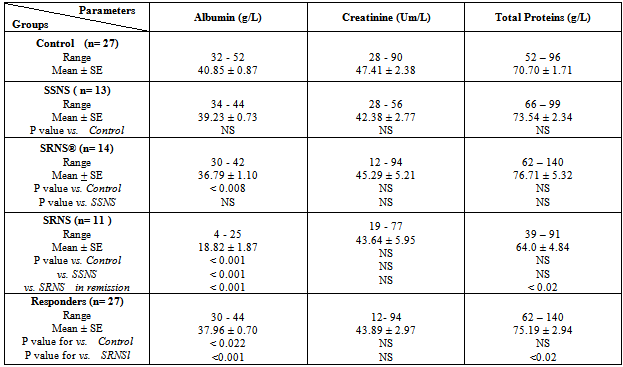
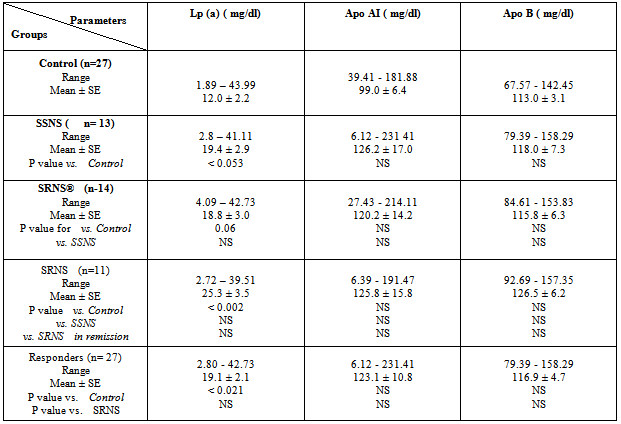
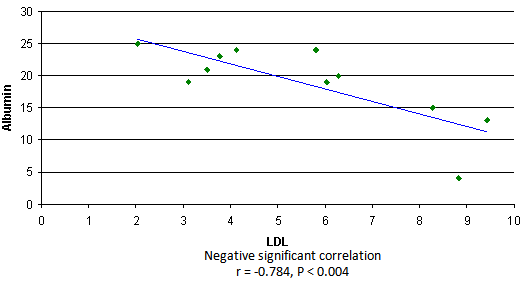
- The results showed a significant increase in cholesterol, triglyceride and LDL concentrations in group3 (SRNS) as compared to control, group1 (SSNS) and group 2 (SRNS®) (table 1). However, non significant changes were detected in SSNS and SRNS®, compared to the control group.All groups showed a significant increase in HDL levels compared with control group. A significant increase (P < 0.012) was also observed in HDL in SRNS compared to SRNS®.We analysed the data as responder group (group 1 and group 2) compared to non-responders (group 3). We found a significant increase in the cholesterol, triglyceride, HDL and LDL in the resistant group compared to the control group and the responders group (table 1). Furthermore, a significant increase was observed in HDL and LDL in the responders group compared to control group whereas the increase in the cholesterol and triglyceride level did not reach a significant level. As it would be expected, there was a highly significant decrease (P < 0.001) in albumin level in SRNS group compared to other groups. Furthermore a significant decrease (P < 0.008) was also observed in SRNS® compared with control group (table 2). Total protein was significantly lower in SRNS compared to SRNS®. We looked at the data as responder group and resistant group, we observed a significant decrease (P <0.001) in serum albumin level in the resistant group as compared to the control and the responder groups. Similarly, there was a significant decrease in albumin level (P <0.022) in responders group compared with control group (table 2).On the other hand, the changes in creatinine and total protein levels were not significant in responders and resistant groups compared to controls (table 2). Renal function was normal in all groups and no significant changes were detected in creatinine levels between different groups compared to control group (table 2). We have observed highly a significant increase in LP (a) level (P < 0.001) in SRNS group and significant increase (P< 0.05) in the SSNS group compared to control group. However, a non significant increase (p=0.06) was observed in LP (a) level in SRNS® compared to control group (table 3). Similarly, when we looked at the level of Lp(a) in the responder group and the resistant group, we found, that responders group had serum Lp(a) level significantly higher than control group (P <0.021), while the resistant group showed a highly significant elevation (P <0.002) as compared to control group. No significant change was noticed in the resistant group compared to responders group (table 3). We found 6 out of 11 patients with SRNS (54.55%) and 2 out of 14 patients with SRNS® who were receiving steroid therapy (14.29%) had Lp (a) levels higher than 30mg/dl. No significant changes were observed in Apo AI and Apo B levels in responder and resistant groups compared to their control group or between group 1, group 2, group 3 and the control group (table 3).As it would be expected, in the control group, there was a positive correlation between cholesterol and LDL (r= 0.85 and P<0.001), and between plasma albumin and total protein(r= 0.84 and P<0.001). We have done multiple regression analysis between different variables in the three groups. In the SSNS; There was negative correlation between cholesterol and total protein (r = -0.74, P < 0.004), positive correlation between LDL and Apo B (r = 0.613, P < 0.026); positive correlation between creatinine and Apo A1 (r= 0.0.60, P=0.029). There was no correlation between LP (a) and any of the variables.In the SRNS®; There was positive correlation between cholesterol and LDL (r=0.765, P<0.001), positive correlation between LDL and Apo B (r = 0.61, P < 0.021) and positive between LP (a) and Apo B (r = 0.613, P < 0.02).In the SRNS ; There was positive correlation between cholesterol and triglyceride (r = 0.686 , P < 0.02), positive correlation between cholesterol and LDL(r = 0.96, P < 0.001), negative correlation between cholesterol and albumin (r=-0.805, P<0.003) (figure 1), negative correlation between triglyceride and albumin (r = -0.858 , P < 0.01) (figure 2), negative correlation between LDL and albumin (r = -0.784 , P<0.004) (figure 3), positive correlation between triglyceride and ApoB (r = 0.672 , P < 0.023) (figure 4) and negative correlation between Lp(a) and creatinine (r=-0.68, p=0.03).
|
|
|
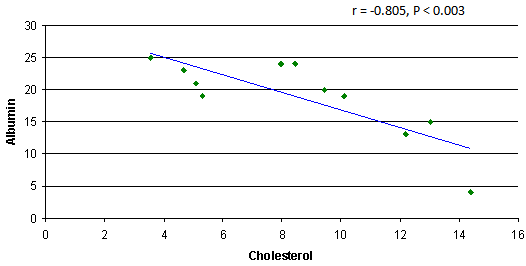 | Figure 1. Negative correlation between cholesterol and albumin in SRNS group |
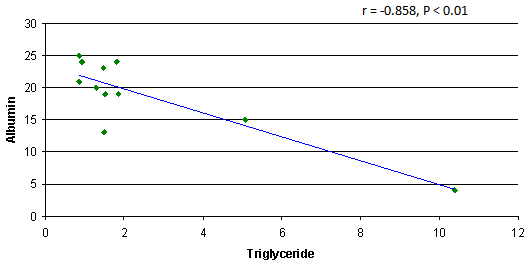 | Figure 2. Negative correlation between triglyceride and albumin in SRNS group |
 | Figure 3. Correlation between triglyceride and ApoB in SRNS group |
4. Discussion
- We found that hyperlipidemia and LP (a) is markedly increased in SRNS and to less extent in children in remission (group 1 and group 2). This finding is similar to previous reports (1 &4). The influence of renal impairment on serum lipids (8) was excluded as all studied children had normal kidney function.The underlying cause of hyperlipidemia in NS was related by previous investigators to proteinuria and altered lipoprotein metabolism. It has been proposed that hypoalbuminemia causes reduced serum oncotic pressure, which in turn stimulates hepatic synthesis of albumin and other liver-derived proteins, including apolipoproteins (9). If the nephrotic syndrome causes increased hepatic protein synthesis, then the elevated LP (a) levels in the NS may results from over production by the liver. Alternatively, the kidney may play a role in the catabolism of LP (a) and therefore the nephrotic syndrome could affect plasma LP (a) levels by affecting the rate of catabolism (4). Similar to previous studies we have observed marked increase in plasma Lp(a) level in patients with SRNS (1&4). However, insignificant change was observed between SRNS group and the other two nephrotic groups who were in remission. Although LP (a) was higher in SRNS (25.3±3.5) compared to the SSNS (19.4±2.9) and SRNS in remission (18.8 ±3.0), this difference did not reach statistical significance. Other studies reported significant increase of LP (a) in SRNS compared to nephrotic children in remission (1&10). The absence of difference in our study could be explained by relatively small number of children studied in our cohort. Our result is in agreement with the notion that controlling nephrotic syndrome by achieving remission improves but does not normalize LP (a) as their mean was lower in group 1 and group 2 than the SRNS group, but it was higher than the control group. Our results were similar to Garnotel et al, who reported higher serum LP (a) levels in response to steroid therapy on frequent relapsing steroid sensitive nephrotics (11). When we analysed the responders as one group (SSNS+ SRNS in remission), SRNS as another group and compared them with the control group. We found again that nephrotics (responders and resistant) had higher LP (a) compared to controls but none significant change was observed between responders and resistant (table 3). Nakahara et al, hypothesized that the Lp(a) lowering effect of steroids may be related to the steroid-induced elevation of serum albumin levels or to decrease of proteinuria (10). The pathogenesis of the increased levels of plasma LP (a) concentration in patients with nephrotic syndrome has not been clarified. The plasma level of LP (a) are under the control of Apo (a) gene to large extent and largely unaffected by age, sex and prandial status. However, the increased hepatic synthesis rate of LP (a) appears to more important than a decreased catabolism of lipoproteins (4). We did not observe a significant correlation between LP (a) and parameters related to the severity of NS, such as serum albumin and total protein. This is similar to few previous reports (12), who reported no correlation between LP (a) and serum albumin level. While others, had reported significant correlation (10). The lack of correlation could be explained by the possibility that the LP (a) is normalized after reaching certain level of albumin in the blood.Joven et al. (13) reported an improvement of LP (a) after achievement of complete remission. However 53% of patients in his study who achieved remission continued to have higher level of LP (a) (>30mg/dl), suggesting a residual effect of nephrosis in the overall lipoprotein transport. Similarly, Garnotel et al. (11) reported high LP (a) levels of over 30mg/dl in 66% of patients in relapse, 44% of patients in remission on steroid therapy and 18% of patients without steroid therapy compared to 16% of controls. Our results are comparable to them, as we found 54.55% of SRNS group and 14.29% of group 2, had LP (a) levels higher than 30mg/dl. Nakahara et al. (10) also reported that 5 of 23 samples (21.7%) of nephrotics receiving steroid therapy and achieved remission had LP (a) levels higher than 30 mg/dl.In the third group (SRNS), we have observed a negative correlation between albumin level and cholesterol levels, triglyceride level and LDL. This is similar to Noto et al, who reported that albumin level was inversely correlated to the increase of cholesterol, triglyceride and LDL in NS (14). We have observed higher level of HDL in nephrotic children (all three groups) compared to controls. SRNS showed a significant elevation of HDL compared to responders or controls (table 1). This is similar to previous reports (1).We did not observe any change in the level of Apo AI in the SRNS group compared to controls. Although the mean of Apo B level was higher in SRNS than the responders or controls (table 3), it was not statistically significance. It was thought that lipoprotein abnormalities in nephrotic syndrome are associated with a consistent increase of plasma Lp(a) that is parallel the increase of Apo B (1 &14). In the second group, the mean concentration of variables including cholesterol, triglyceride, LDL, Apo AI and Apo B were all higher than the control group but it did not reach significant levels. This support the hypothesis of normalization of lipids levels with the remission of the disease (15). In SSNS group all lipid values were normal (cholesterol, triglyceride, LDL, Apo AI, and Apo B). This was observed when patients were in remission as their albumin was normal. This is in agreement with previous studies of normalizing serum lipids with remission of NS (14).The level of LP (a) was significantly higher in SSNS group than control group. This could be considered as independent risk factor for relapse of SSNS with frequently relapsing course (15).
5. Conclusions
- SRNS in children was associated with high LP (a) and dyslipidemia which was not completely normalized in children who achieved remission.