| [1] | F. Bovenga, « Special Issue “Synthetic Aperture Radar (SAR) Techniques and Applications” », Sensors, vol. 20, no 7, mars 2020, doi: 10.3390/s20071851. |
| [2] | N. Yahya, N. S. Kamel, et A. S. Malik, « Subspace-Based Technique for Speckle Noise Reduction in SAR Images », IEEE Trans. Geosci. Remote Sens., vol. 52, no 10, p. 62576271, oct. 2014, doi: 10.1109/TGRS.2013.2295824. |
| [3] | F. Guo, G. Zhang, Q. Zhang, R. Zhao, M. Deng, et K. Xu, « Speckle Suppression by Weighted Euclidean Distance Anisotropic Diffusion », Remote Sens., vol. 10, no 5, Art. no 5, mai 2018, doi: 10.3390/rs10050722. |
| [4] | L. Gemme et S. G. Dellepiane, « An Automatic Data-Driven Method for SAR Image Segmentation in Sea Surface Analysis », IEEE Trans. Geosci. Remote Sens., vol. 56, no 5, p. 26332646, mai 2018, doi: 10.1109/TGRS.2017.2769710. |
| [5] | Y. Yuan, J. Fang, X. Lu, et Y. Feng, « Remote Sensing Image Scene Classification Using Rearranged Local Features », IEEE Trans. Geosci. Remote Sens., vol. 57, no 3, p. 17791792, mars 2019, doi: 10.1109/TGRS.2018.2869101. |
| [6] | E. Shah, P. Jayaprasad, et M. E. James, « Image Fusion of SAR and Optical Images for Identifying Antarctic Ice Features », J. Indian Soc. Remote Sens., vol. 47, no 12, p. 21132127, déc. 2019, doi: 10.1007/s12524-019-01040-3. |
| [7] | Hua Xie, L. E. Pierce, et F. T. Ulaby, « Statistical properties of logarithmically transformed speckle », IEEE Trans. Geosci. Remote Sens., vol. 40, no 3, p. 721727, mars 2002, doi: 10.1109/TGRS.2002.1000333. |
| [8] | X. Li, Y. Hu, X. Gao, D. Tao, et B. Ning, « A multi-frame image super-resolution method », Signal Process., vol. 90, no 2, p. 405414, févr. 2010, doi: 10.1016/j.sigpro.2009.05.028. |
| [9] | L. G. Shapiro et G. C. Stockman, Computer Vision. Upper Saddle River, NJ: Pearson, 2001. |
| [10] | C. Tomasi et R. Manduchi, « Bilateral filtering for gray and color images », in Sixth International Conference on Computer Vision (IEEE Cat. No.98CH36271), janv. 1998, p. 839846, doi: 10.1109/ICCV.1998.710815. |
| [11] | A. Buades, B. Coll, et J.-M. Morel, « A non-local algorithm for image denoising », in 2005 IEEE Computer Society Conference on Computer Vision and Pattern Recognition (CVPR’05), juin 2005, vol. 2, p. 6065 vol. 2, doi: 10.1109/CVPR.2005.38. |
| [12] | Y. Tounsi, M. Kumar, A. Nassim, F. Mendoza-Santoyo, et O. Matoba, « Speckle denoising by variant nonlocal means methods », Appl. Opt., vol. 58, no 26, p. 71107120, sept. 2019, doi: 10.1364/AO.58.007110. |
| [13] | H. Wang, « SAR Image Denoising Based on Dual Tree Complex Wavelet Transform », in Computer Science for Environmental Engineering and EcoInformatics, Berlin, Heidelberg, 2011, p. 430435, doi: 10.1007/978-3-642-22691-5_75. |
| [14] | A. Nassim, Y. Tounsi, et A. Siari, Denoising in digital speckle pattern interferometry by Riesz wavelets. LAP LAMBERT Academic Publishing, 2018. |
| [15] | T. Yassine, S. Ahmed, et N. Abdelkrim, « Speckle noise reduction in digital speckle pattern interferometry using Riesz wavelets transform », in 2017 International Conference on Advanced Technologies for Signal and Image Processing (ATSIP), mai 2017, p. 14, doi: 10.1109/ATSIP.2017.8075565. |
| [16] | A. Misra, B. Kartikeyan, et S. Garg, « Wavelet based SAR data denoising and analysis », in 2014 IEEE International Advance Computing Conference (IACC), févr. 2014, p. 10871092, doi: 10.1109/IAdCC.2014.6779477. |
| [17] | H. Choi et J. Jeong, « Speckle Noise Reduction Technique for SAR Images Using Statistical Characteristics of Speckle Noise and Discrete Wavelet Transform », Remote Sens., vol. 11, no 10, Art. no 10, janv. 2019, doi: 10.3390/rs11101184. |
| [18] | Q. Kemao, « Two-dimensional windowed Fourier transform for fringe pattern analysis: Principles, applications and implementations », Opt. Lasers Eng., vol. 45, no 2, p. 304317, févr. 2007, doi: 10.1016/j.optlaseng.2005.10.012. |
| [19] | H. Fattahi, M. J. V. Zoej, M. R. Mobasheri, M. Dehghani, et M. R. Sahebi, « Windowed Fourier Transform for Noise Reduction of SAR Interferograms », IEEE Geosci. Remote Sens. Lett., vol. 6, no 3, p. 418422, juill. 2009, doi: 10.1109/LGRS.2009.2015338. |
| [20] | C. Yue et W. Jiang, « SAR image denoising in nonsubsampled contourlet transform domain based on maximum a posteriori and non-local constraint », Remote Sens. Lett., vol. 4, no 3, p. 270278, mars 2013, doi: 10.1080/2150704X.2012.723146. |
| [21] | J. M. Mejía Muñoz et al., « SAR Image Denoising Using the Non-Subsampled Contourlet Transform and Morphological Operators », in Advances in Artificial Intelligence, Berlin, Heidelberg, 2010, p. 337347, doi: 10.1007/978-3-642-16761-4_30. |
| [22] | J. Hu, Y. Li, et Y. Jia, « Automatic SAR Image Enhancement Based on Curvelet Transform and Genetic Algorithm », in Intelligent Science and Intelligent Data Engineering, Berlin, Heidelberg, 2012, p. 326333, doi: 10.1007/978-3-642-31919-8_42. |
| [23] | J. R. Sveinsson et J. A. Benediktsson, « Combined wavelet and curvelet denoising of SAR images using TV segmentation », in 2007 IEEE International Geoscience and Remote Sensing Symposium, juill. 2007, p. 503506, doi: 10.1109/IGARSS.2007.4422841. |
| [24] | E. Dalsasso, X. Yang, L. Denis, F. Tupin, et W. Yang, « SAR Image Despeckling by Deep Neural Networks: from a Pre-Trained Model to an End-to-End Training Strategy », Remote Sens., vol. 12, no 16, Art. no 16, janv. 2020, doi: 10.3390/rs12162636. |
| [25] | H. Imad, T. Yassine, B. Mohammed, et N. Abdelkrim, « Batch despeckling of SAR images by a convolutional neural network-based method », in 2020 IEEE International conference of Moroccan Geomatics (Morgeo), mai 2020, p. 16, doi: 10.1109/Morgeo49228.2020.9121890. |
| [26] | M. Rahimi et M. Yazdi, « A new hybrid algorithm for speckle noise reduction of SAR images based on mean-median filter and SRAD method », in 2015 2nd International Conference on Pattern Recognition and Image Analysis (IPRIA), mars 2015, p. 16, doi: 10.1109/PRIA.2015.7161623. |
| [27] | B. Marhaba et M. Zribi, « Reduction of Speckle Noise in SAR Images Using Hybrid Combination of Bootstrap Filtering and DWT », in 2018 International Conference on Computer and Applications (ICCA), août 2018, p. 377382, doi: 10.1109/COMAPP.2018.8460380. |
| [28] | A. Nassim, Y. Tounsi, et A. Siari, Denoising in digital speckle pattern interferometry by Riesz wavelets. LAP LAMBERT Academic Publishing, 2018. |
| [29] | T. Yassine, S. Ahmed, et N. Abdelkrim, « Speckle noise reduction in digital speckle pattern interferometry using Riesz wavelets transform », in 2017 International Conference on Advanced Technologies for Signal and Image Processing (ATSIP), mai 2017, p. 1-4, doi: 10.1109/ATSIP.2017.8075565. |
| [30] | K. Dragomiretskiy et D. Zosso, « Variational Mode Decomposition », IEEE Trans. Signal Process., vol. 62, no 3, p. 531544, févr. 2014, doi: 10.1109/TSP.2013.2288675. |
| [31] | Z. Wu, N. E. Huang, S. R. Long, et C.-K. Peng, « On the trend, detrending, and variability of nonlinear and nonstationary time series », Proc. Natl. Acad. Sci., vol. 104, no 38, p. 1488914894, sept. 2007, doi: 10.1073/pnas.0701020104. |
| [32] | Y. Wang, R. Markert, J. Xiang, et W. Zheng, « Research on variational mode decomposition and its application in detecting rub-impact fault of the rotor system », Mech. Syst. Signal Process., vol. 6061, p. 243-251, août 2015, doi: 10.1016/j.ymssp.2015.02.020. |
| [33] | B. He et Y. Bai, « Signal-noise separation of sensor signal based on variational mode decomposition », in 2016 8th IEEE International Conference on Communication Software and Networks (ICCSN), juin 2016, p. 132-138, doi: 10.1109/ICCSN.2016.7586634. |
| [34] | K. Dragomiretskiy et D. Zosso, « Two-Dimensional Variational Mode Decomposition », in Energy Minimization Methods in Computer Vision and Pattern Recognition, Cham, 2015, p. 197208, doi: 10.1007/978-3-319-14612-6_15. |
| [35] | J. Salmon et Y. Strozecki, « From patches to pixels in Non-Local methods: Weighted-average reprojection », in 2010 IEEE International Conference on Image Processing, sept. 2010, p. 19291932, doi: 10.1109/ICIP.2010.5650780. |
| [36] | V. S. Frost, J. A. Stiles, K. S. Shanmugan, et J. C. Holtzman, « A Model for Radar Images and Its Application to Adaptive Digital Filtering of Multiplicative Noise », IEEE Trans. Pattern Anal. Mach. Intell., vol. PAMI-4, no 2, p. 157166, mars 1982, doi: 10.1109/TPAMI.1982.4767223. |
| [37] | J.-S. Lee, « Digital Image Enhancement and Noise Filtering by Use of Local Statistics », IEEE Trans. Pattern Anal. Mach. Intell., vol. PAMI-2, no 2, p. 165168, mars 1980, doi: 10.1109/TPAMI.1980.4766994. |
| [38] | S. Parrilli, M. Poderico, C. V. Angelino, G. Scarpa, et L. Verdoliva, « A nonlocal approach for SAR image denoising », in 2010 IEEE International Geoscience and Remote Sensing Symposium, juill. 2010, p. 726-729, doi: 10.1109/IGARSS.2010.5651432. |
| [39] | M. Kumar, Y. Tounsi, K. Kaur, A. Nassim, F. Mandoza-Santoyo, et O. Matoba, « Speckle denoising techniques in imaging systems », J. Opt., vol. 22, no 6, p. 063001, mai 2020, doi: 10.1088/2040-8986/ab8b7f. |

 Abstract
 Reference
 Full-Text PDF
 Full-text HTML

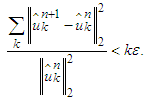
 and
and  one has:
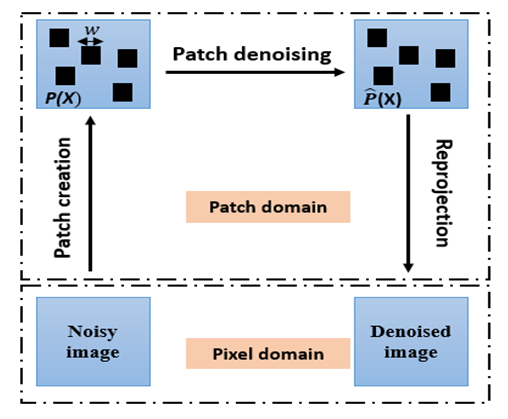
 with X = (x, y), and the filtered estimator for any patch is given as
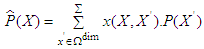
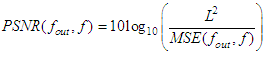
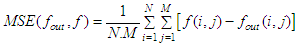
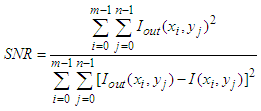
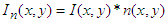
 represents the pixel value at position (i, j) in the original image and
  represents the pixel value at the same position in the corresponding denoised image. The PSNR value must be maximum as much as possible because the good image quality is associated with the higher PSNR value. The quality index (Q) is defined as [12]:
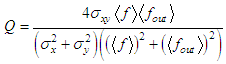
 and
and  are the mean values of the images
  and
and  and
and  are their variances, respectively, and
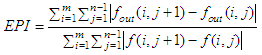
  is their covariance. The value of Q is counted in the interval [−1, +1], when the two images are quite similar, then the value of Q approaches to +1 [12,39]. The edge preservation index (EPI) is defined as: