-
Paper Information
- Paper Submission
-
Journal Information
- About This Journal
- Editorial Board
- Current Issue
- Archive
- Author Guidelines
- Contact Us
Geosciences
p-ISSN: 2163-1697 e-ISSN: 2163-1719
2020; 10(1): 25-32
doi:10.5923/j.geo.20201001.03
Received: Aug. 18, 2020; Accepted: Sep. 16, 2020; Published: Sep. 28, 2020

Magnetotelluric Evaluation of the Pan African Belt and Oceanic Crust Incidence on the Congo Craton
 Abstract
 Reference
 Full-Text PDF
 Full-text HTML
H. L. Ekoro Nkoungou1, 2, J. L. Meli’i2, D. H. Gouet2, 3, V. Oyoa2, 4, P. Njandjock Nouck2, E. Manguelle Dicoum2
1Higher Technical Teacher’s Training College of Ebolowa, University of Yaoundé 1, Yaoundé, Cameroon
2Department of Physics, Faculty of Science, University of Yaoundé 1, Yaoundé, Cameroon
3Institute of Mining and Petroleum Industries, University of Maroua, Maroua, Cameroon
4Higher Teacher’s Training College of Maroua, University of Maroua, Maroua, Cameroon
Correspondence to: H. L. Ekoro Nkoungou, Higher Technical Teacher’s Training College of Ebolowa, University of Yaoundé 1, Yaoundé, Cameroon.
| Email: |  |
Copyright © 2020 The Author(s). Published by Scientific & Academic Publishing.
This work is licensed under the Creative Commons Attribution International License (CC BY).
http://creativecommons.org/licenses/by/4.0/

The both influence of the Oceanic crust and the pan-African belt on the northern limit of the Congo Craton, made up of the Ntem, Lower Nyong and Ayina units, remains partially described. To do this, the magnetotelluric method which were used for good modeling the southern limit of this Craton, was also deployed through 22 stations distributed over its 3 units. The data process by cascade decimation with a dimensional analysis by the phase of this tensor, allowed to detect à major network of regional faults defining the course of Ntem rivers, highlight the violence of tectonic activity during Eburnean erosion in the Ntem unit, through the undulations of the gneiss-granite. Ripples were also observed in the lower Nyong unit in the geoelectric section, however the dimensional analysis could not confirm them as well as the observation of the resistivity curves according to the two modes, thus showing an anomaly attributable to the mobile zone adjacent to the lower Nyong unit. The depth of the upper limit of the Craton materialized by the granite shield was recorded at 3 km in the unit of the lower Nyong, 3.5 km in the unit of Ayina and 1.5 km in the unit of Ntem, moreover, no major fault has been highlighted in the Ayina and lower Nyong units while a network of major faults defining the course of the Ntem river has been highlighted. These different results have led us to the conclusion of the predominance of the activity of the pan african Mobile belt on the northern limit of the Congo Craton.
Keywords: Congo Craton, Mobile belt, Oceanic Crust, Fault
Cite this paper: H. L. Ekoro Nkoungou, J. L. Meli’i, D. H. Gouet, V. Oyoa, P. Njandjock Nouck, E. Manguelle Dicoum, Magnetotelluric Evaluation of the Pan African Belt and Oceanic Crust Incidence on the Congo Craton, Geosciences, Vol. 10 No. 1, 2020, pp. 25-32. doi: 10.5923/j.geo.20201001.03.
Article Outline
1. Introduction
- The Congo Craton, whose have many natural resources has been the subject of numerous geophysical investigations on its southern limit situated at the boundary of Zimbabwe and South Africa [1], [2], the results of these magnetotelluric investigations made it possible to better identify the southern border of this Craton. However, the knowledge of the upper crust of its northern limit in Cameroon, described as a geological disaster, remains approximate.The processing of magnetotelluric recordings produces for each site a complex impedance matrix that allows for a refined analysis of the dimensionality of the structures, géoelectric curves are used to calculate a resistivity model in both directions, [3], for modelisation of soil structure at variable depth, this facts shows that the magnetotelluric method, successfully deployed on African Cratons is appropriate for modeling a structure like this Northerm border of Congo Craton.Audio magnetotelluric (AMT), radiometric and magnetic audio investigations of Manguelle-Dicoum [6], allowed the Congo Craton to be restricted in the Mbalmayo area through the development of a northern shale granite contact and a fracture of the intra-granitic base mentto the south. Gravimetric investigations [7] revealed three major discontinuities in lithosphere density below the Congo Craton: one at 13 km for the upper crust, the second at 25 km for the medium crust and the third at 35 km for the crust-coat interface.In this context, 03 magnetotelluric profiles composed of 22 stations deployed in the Nothern border of congo Craton wich is consitist yo 03 units (Ntem, Lower Nyong and Ayina) units were implemented to identify major fault envisaged by geologic study, highlight the nature and thicknesses of the structural elements of the upper crust of the geological units of the northern boundary of the Congo Craton and highlight the salient characteristic features allowing the identification of the different units of this part of the Congo Craton.At the end of the introduction, we will present the geological context of the units of the northern border of the Congo Craton, the methods and materials used before pre-senting and discussing the results obtained and concluding on the structure of its superficial crust.The objective of this work is to study the influence of the pan African mobile belt and the oceanic plate on the functioning of the different units of the Congo Craton (Ntem, Ayina, Bas Nyong, [20]), located between the Pan-African chain and the ocean. Atlantic), based on magnetotelluric soundings and associated statistical processing [21], [22].
2. Geological Setting
- The Ntem complex that forms the northern edge of the Congo Craton is formed from west to east by the tectonic units of lower Nyong, Ntem and Ayina (Figure 1).
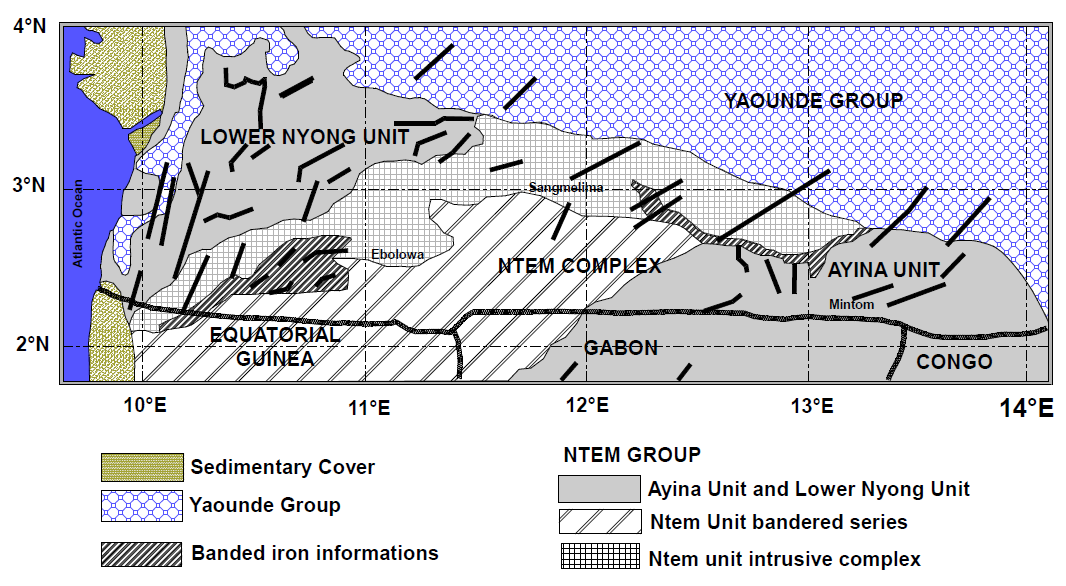 | Figure 1. Geologic map of northern border of Congo Craton [19] |
2.1. Ntem Unit
- This unit consists of a set of granular gneiss (Ribbon series) and an intrusive complex. The intrusive complex is essentially composed of charnockitic granitoids set up around 2.9 Ga [4], its composition is that of TTG (Tonalite-Trondhjemite-Granodiorite). The Ribbon series consists of ferriferous or sterile quartzites and greenstone belts containing basic rocks placed at 3 Ga, especially towards Lolodorf-Ngomezap.
2.2. Lower Nyong Unit
- This unit is chemically and petrologically characteristic of the greenstone belts of the Nyong unit that attach them to the Ntem complex rocks. The metamorphic and tectonic characteristics reflect a much more vigorous structural evolution than the Ntem unit during Eburnean erosion and the influence of pan-African tectonics [5]. The Eburnean orogeny is responsible for the N-S structure and spill on the Ntem unit from the lower Nyong unit to the southeast. A slight retromorphosis observed in the green shale can be attributed to pan-African metamorphism [5].
2.3. Ayina Unit
- This unit is located in the south-east, referred to the Archean, borders the Ntem unit. Most of this unit consists of crystallophyllian rocks (leptynites, amphibolites, gneiss), intrusive rocks (granites, syenites, tonalites) and green stones, which pass in the continuity from the Ntem unit to the Ayina unit. Further east, the Mbalam volcano-sedimentary series is characterized by less intense metamorphism. The Mbalam formations (chlorito-shales, sericito-shales, amphibole shales, amphibolites and ferruginous quartzites) are very straightened (sub-verticals) and affected by a brittle tectonic.
3. Methods and Materials
3.1. Magnetotelluric Method
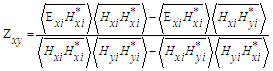
- The magnetotelluric method provides images of the distribution of electrical conductivity in the Earth. The MT measurements record the vertical and horizontal components of the magnetic field (Hx, Hy, Hz)and the horizontal components of the electric field (Ex, Ey), where x and y are horizontal orthogonal directions and z is the vertical direction [8]. This components fields are linked by an impedance tensor estimated by statistical processing, Resistivity and phase were estimated after this statistical processing by equations 1 and 2 [8].
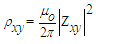 | (1) |
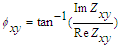 | (2) |
 | (3) |
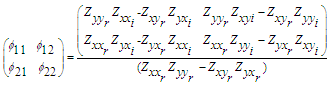 | (4) |
 | (5) |
 | (6) |
3.2. Data Acquisition and Processing
- The data were collected by the ECA 540 resistivity meter manufactured at the Geophysical Research Center in Garchy (France), which produces measurements of electric and magnetic fields. This device uses a frequency range that ranges from 4.1 to 2300 Hz. The quality and reliability of the data are obtained by removing the background noise by averaging 40 or more measurements at each station for a given frequency.The electric (Ex, Ey) and magnetic (Hx, Hy and Hz) fields have been orthogonally recorded at the surface, with axes being defined as x in the north, y in the east, z being the depth. The stations have been chosen to be away from the forest sawmills and any industrial activity as well as electric transmission lines that could provide background noise.The treatment of the impedance tensor was carried out by the Jacknife method [12]. The 2D inversion of the phase and resistivity data has been carried out by the OCCAM code [13] Dimensional analysis was performed by the Caldwell impedance phase tensor [9].
4. Results and Discussion
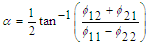
- In this work the three profiles were implemented on the three units of the Ntem complex forming the northern limit of the Congo Craton following the distribution shown in Figure 2. These profiles will be called profile “N” for the Ntem unit, profile “S” for the lower Nyong unit and profile “M” for the Ayina unit.
 | Figure 2. Profiles in study area |
4.1. Profile « N » (Ntem Unit)
- This profile of 30 kilometers is composed of 07 stations distant of 05 kilometers spread along the road connecting that develops along the Campo-Ma'an road, located in southern Cameroon.The geoelectric models, according to the TE and TM modes, show great similarities outside the N3 station where the outcroppings of low resistivity structures surface ac-cording to the TE mode (figure 3).
 | Figure 3. Soundings curves at station N3 |
 | Figure 4. Geo-electric section at Ntem unit |
 | Figure 5. Dimensional parameter α « N5 » |
 | Figure 6. Dimensional parameter λ at « N5 » |
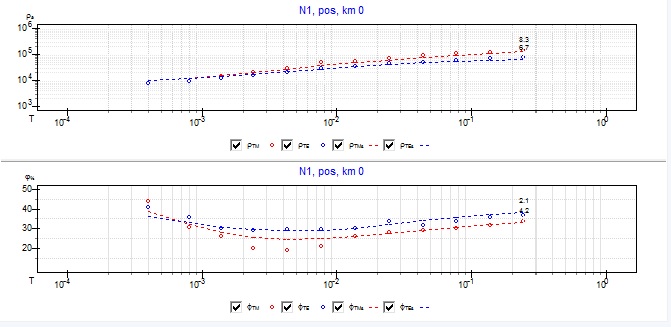
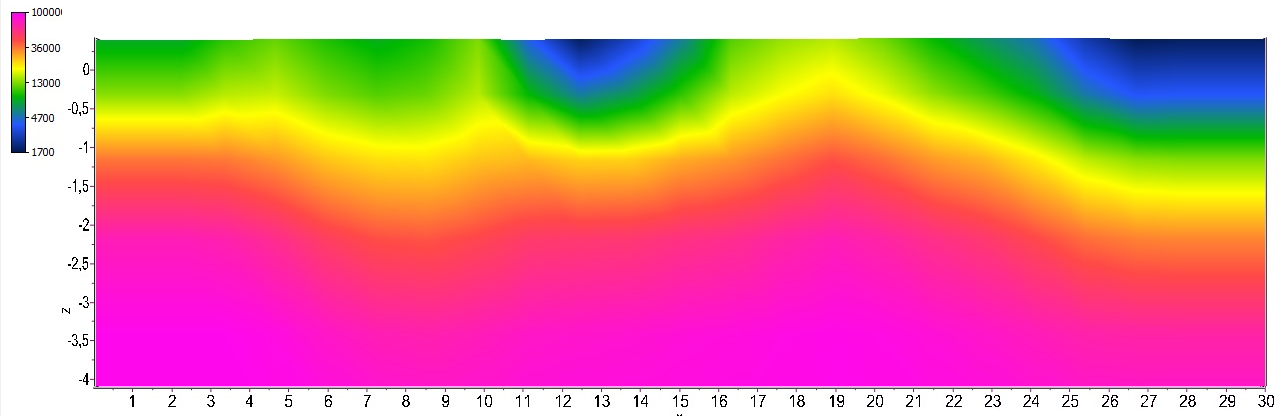
4.2. Profile « S » (Lower-Nyong Unit)
- This profile with a length of 35 kilometers is composed of 08 stations distants of 05 kilometers, develops on the tracks parallel to the axis Sangmelima-Mbalmayo around 75 kilometers of the boundary Craton Congo highlighted [6], with altitudes between 680 and 720 meters.Resistivity and phases section curves show similarities across all the stations with abrupt variations at the "S3" and "S5" stations in the TM mode (Figures 7). Dimensional analysis did not bring out regional 2D structures, as predicted by geological predictions of local faults.
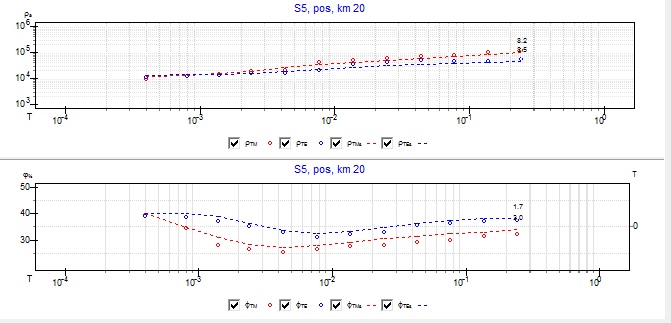 | Figure 7. Sounding curves at « S5 » |
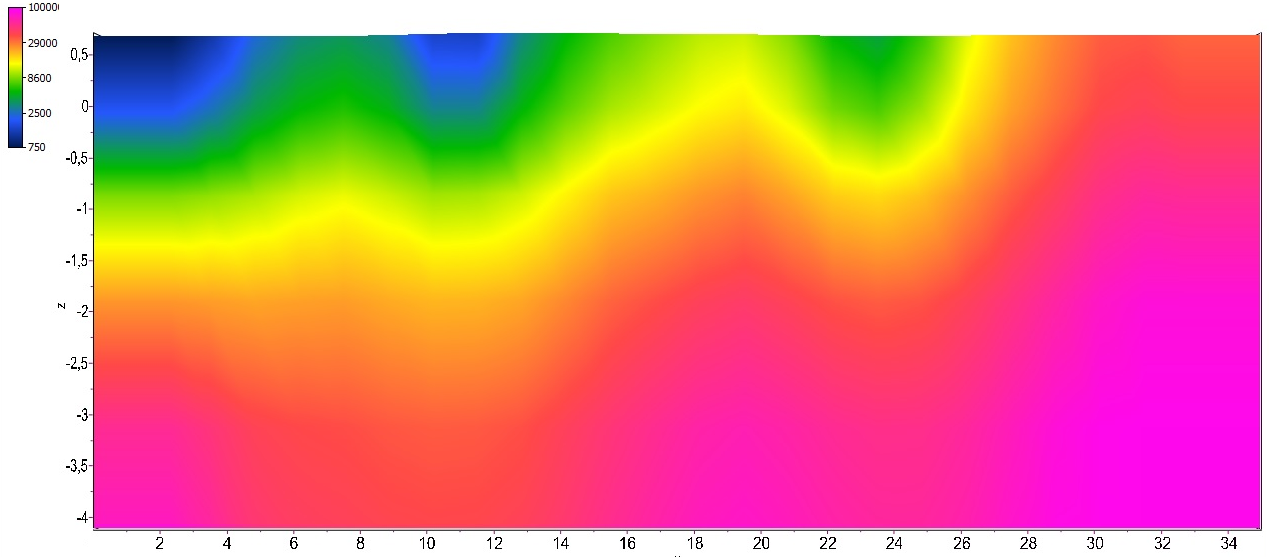 | Figure 8. Geo-electric section at lower-Nyong unit |
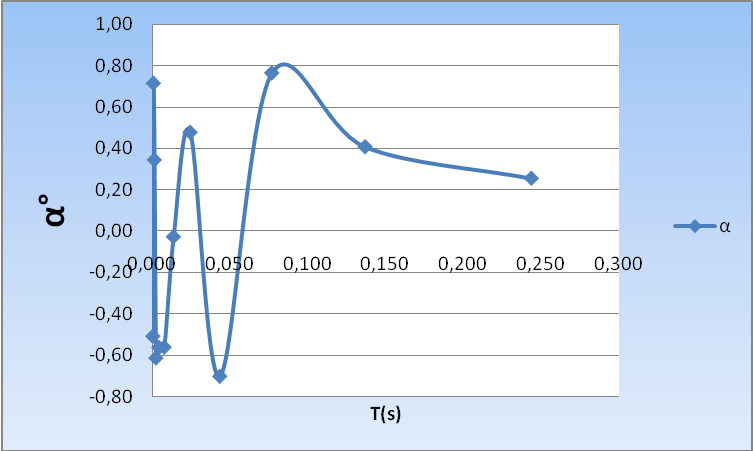
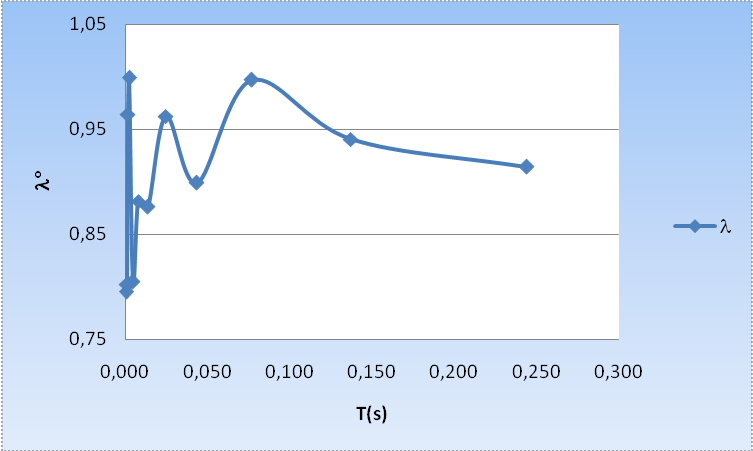
4.3. Profile « M » (Ayina Unit)
- This 30 kilometer profile consists of 07 remote stations of 05 kilometers is deployed in the Mintom area, with altitudes ranging from 600 to 640 m, where a limestone deposit of about 350 million m3 potentially usable for 30 years on a surface of 7 km2 has been recovered. The thickness of this deposit is between 60 and 140 meters of argillite and pelite on the surface [18], [19].The resistivity curves present differences according to the TE and TM modes at stations "M3" and "M6" (figure 9). Dimensional analysis revealed 2D structures at these stations marking the regional rift developing along the Dja River flowing into this region [19], (Figures 10 and 11).
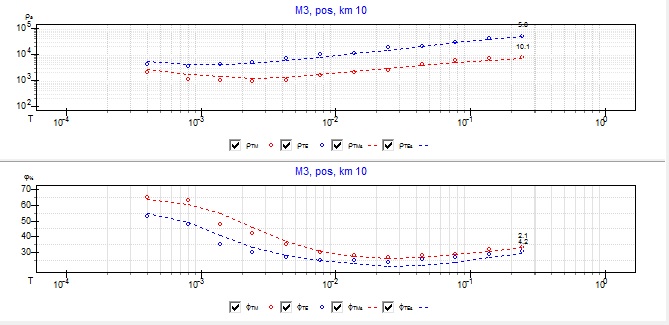 | Figure 9. Resistivity curves at « M3 » |
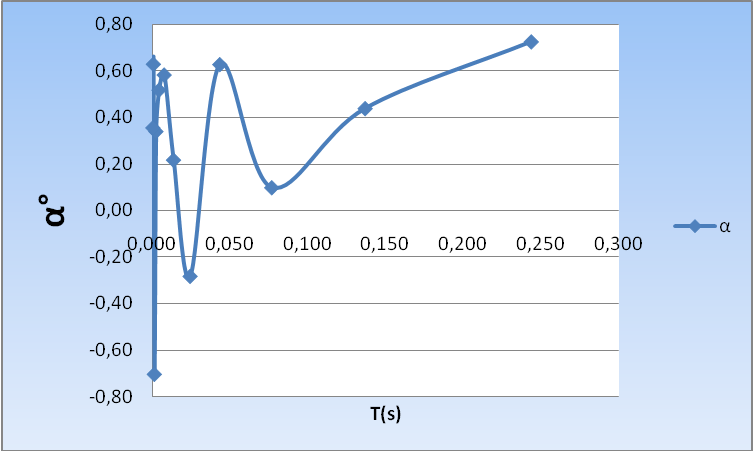 | Figure 10. Dimensional parameter α « M3 » |
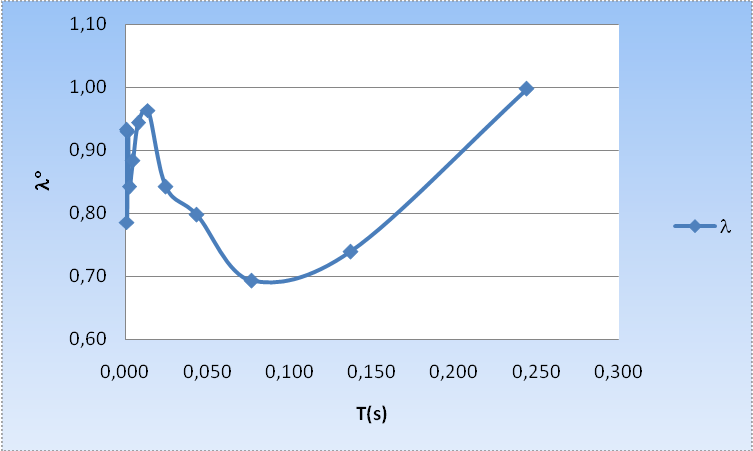 | Figure 11. Dimensional parameter λ at « M3 » |
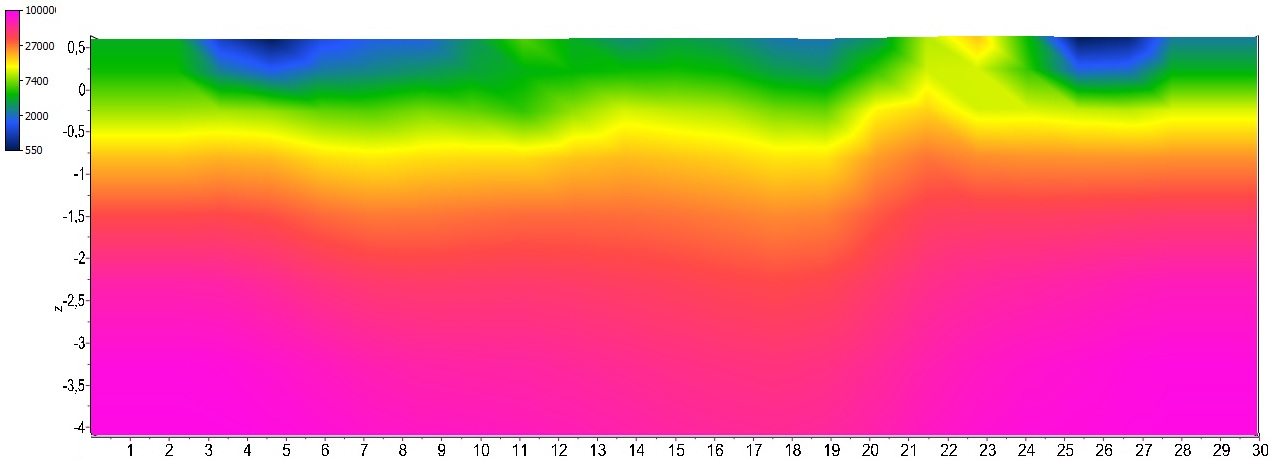 | Figure 12. Geo-electric section at Ayina unit |
4.4. Discussion
- Following Manguelle-Dicoum work in [6], which allowed to circumscribe the boundary between the Congo Craton and the pan-African mobile zone in the vicinity of Mbalmayo area and those of Nnangue in [7], highlighting the thickness of the crust above 13 km, investigations on the superficial crust of Congo Craton units which led us to the following additional conclusions:- Lower Nyong unit This unit has no major fault in the profile studied. However, some local faults are presented on the geological map.The geological structure of the superficial crust of this unit is as follows. Intermittent metamorphic sedimentary deposits of average thickness 0.5 km of various natures as stated by [17] or a very wavy overlays of healthy gneiss-granite structures 2 km thick. The granitic basement marking the start of the upper crust was detected at an average depth of 3 km, passing through a minimum value of 1.5 km and maximum of 3.5 km.The geoelectric section following this unit presented numerous oscillations with the appearance of structures with little resistivity on the surface while antagonisms according to the TM and TE modes of resistivity were not highlighted, moreover the dimensional analysis by the phase of the impedance tensor did not clearly highlight 2D anomaly, comparable to a regional fault. It therefore seems plausible in view of the foregoing to consider an extension of the deep structures influenced by the presence of the mobile belt in this zone.- Ayina unitA major regional fault along the Dja river which suggests the effectivity of the remainder envisaged was highlighted by dimensional analysis. From the review of the data above, the following result has emerged. Superficial global sedimentary deposits over the entire structure with an average thickness of 0,5 km or altered gneiss-granite structures with average depths of 1 km. Healthy gneiss granite structures with a thickness of 1.75 km on average without significant oscillation. The limit of the superficial crust marked by the departure of granite structures is highlighted at an average depth of 3,5 km.The observation of the divergences on the resistivity curves according to the TM and TE modes combined with the fact that the dimensionality parameters have highlighted many anomalies not highlighted by the geoelectric sections shows that the structures composing the Ayina unit are essentially 3D, which is why there are many more mining deposits there, the thickness of the surface crust marked by the presence of the Granite Shield is generally found at 3.5 km, which shows that this zone is stable and was less marked by previous tectonic activity.- Ntem unitThis unit as presented in its geological context includes a network of major faults highlighted by dimensional analysis along the Ntem River and another along the assembly line of Lolodorf-Ngomedzap.The structure of the next upper crust was reemerged this way, metamorphic sedimentary deposits in places reaching depths of 1 km or altered gneiss-granite thicknesses of oscillating thicknesses between 0.5 and 1.5 km, Healthy gneiss-granite structures of average thickness 0.5 km, under the gneiss-granite altered without appearances on the surface.The granite base representing the boundary between the superficial crust and the upper crust was detected at an average depth of 2 km, passing through a minimum value of 1.5 km and maximum of 2.5 km.The different depths of the granite subsoil detected 3.5 km in the Ayina unit, 2.5 km in the lower Nyong unit and 2 km in the Ntem unit show that the surface crust thins as it progresses. that we move away from its central zone with a pronounced thinning towards the Atlantic Ocean. this thinning is due to the tectonic activity induced by the Oceanic crust. However, the presence of rejects from the metamorphism of the mobile zone observed in the upper Nyong unit, show that the impact of the Pan African mobile belt is greater than that of the oceanic plate, the effects of which are limited to the unit. of Ntem.
5. Conclusions
- At the end of the interpretation of the data of 22 Magnetotelluric surveys deployed across the three units of the northern limit of the Congo craton (units of Ntem, Nyong and Ayina), implemented with a view to evaluation of the impact of the mobile zone and the oceanic crust on the latter, the following observations were made.A superficial layer consisting of sedimentary deposits of varying nature and thickness. A altered gneiss-granite layer of oscillating thickness averaging 1 km in Ntem unit, with alternated superficial and non superficial apparitions. A The third layer we have gneiss-granite structures with superficial appearances in the lower Nyong unit with oscillating with mean thicknesses averaged 1 km. These healthy gneiss-granite units are followed by a granitic basement which marks the limit of the superficial crust whose depth has been highlighted at 2 km in the Ntem unit, 3 km in the lower Nyong unit and 3.5 km in the Ayina unit.The dimensional analysis revealed a network of major faults defining the course of the Ntem river [15] and local faults in the Ayina unit [19]. Investigations in the lower Nyong unit brought out signs of the presence of the influence of the mobile zone marked by undulations of the granite gneiss structures not justifiable by dimensional analysis and by divergences on the resistivity curves following the TE and TM modes.
ACKNOWLEDGEMENTS
- The authors would like to thank Mrs. Esther BINDANG MBOT for the financial support.