-
Paper Information
- Paper Submission
-
Journal Information
- About This Journal
- Editorial Board
- Current Issue
- Archive
- Author Guidelines
- Contact Us
Geosciences
p-ISSN: 2163-1697 e-ISSN: 2163-1719
2020; 10(1): 10-24
doi:10.5923/j.geo.20201001.02
Received: Aug. 2, 2020; Accepted: Aug. 26, 2020; Published: Sep. 15, 2020

Multitechnique Mineral Exploration in a Part of Igarra North Basement Complex of Southwestern Nigeria
 Abstract
 Reference
 Full-Text PDF
 Full-text HTML
Abolarin O. Macpaul1, Eze U. Stanley2, Ibitoye T. Abel1, Bello A. Maruff1, Nnorom S. Lotanna3
1Department of Petroleum Engineering and Geosciences, Petroleum Training Institute, Effurun, Nigeria
2Department Marine Geology, Nigeria Maritime University, Okerenkoko, Nigeria
3Department of Earth Sciences, Federal University of Petroleum Resources, Effurun, Nigeria
Correspondence to: Eze U. Stanley, Department Marine Geology, Nigeria Maritime University, Okerenkoko, Nigeria.
| Email: |  |
Copyright © 2020 The Author(s). Published by Scientific & Academic Publishing.
This work is licensed under the Creative Commons Attribution International License (CC BY).
http://creativecommons.org/licenses/by/4.0/

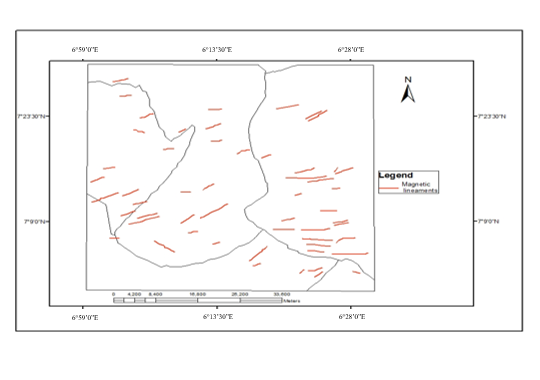
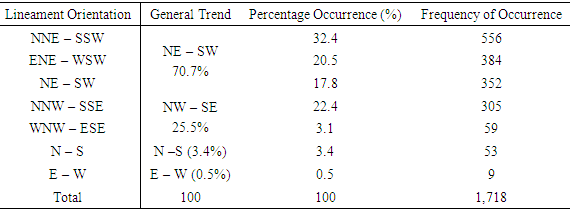
A Multitechnique approach have been employed for mineral deposit exploration in a part of Igarra North Basement complex of Southwestern Nigeria, which is known to have undergone polyphase episodes of deformation, based on earlier structural geological studies reported in the area. Ground geophysical surveys involving 2D resistivity and IP-chargeability tomography, and Magnetic method were employed for locating mineralized zones within the study area. Seven (7) 2D resistivity tomography profiles LI to L7 were occupied in the area. Induced polarization (IP)-chargeability data was acquired alongside 2D ERT along profile seven (L7) which was close to the centre of the survey outlay. In both cases, ground resistivity measurement was made using SAS-1000 Terrameter and the Wenner array was employed with array length limited by space constraint of 200m. Ground magnetic data was also acquired in the area along five (5) profiles (L1 to L5) to supplement the resistivity survey using a high precision fluxgate magnetometer which measures vertical component (ZnT) of the Earth’s field. Landsat 8 OLI remote sensed data was employed for interpretation of geological structures in the area. 2D Resistivity inversion showed anomalous zones with relatively low and high resistivity variation compared with the background trend. In Profile L1, a low resistivity range of 85-243 Ωm was observed disseminated at 8.6m and at 34.3m and interpreted as metallic sulphide/oxide deposit. In Profiles L2 and L3, similar trends in resistivity variations were observed between 8.6 to 17.1m and were both interpreted as quartz veins due to their high resistivity. In Profile L4, a low resistivity value ranging from 85-105 Ωm was observed at 17.1 to 34.3m and interpreted as metallic sulphide/oxide deposits. In Profile L5, a resistivity value ranging from 87-120 Ωm was observed in layers at 17.1 to 34.3m and interpreted as metallic sulphide/oxide deposit. In Profile L6, a resistivity range of 115-315 Ωm was observed at depth of 15 to 17m and interpreted as quartz veins deposits surrounded by metasediments found in the area. In Profile L7, it was observed that both electrical resistivity and IP-chargeability tomography showed similar trends of low resistivity and high chargeability anomalies. A low resistivity value ranging from 31.9-86.6 Ωm corresponded with high chargeability value of 49.5 msec (>20 msec) observed at about 13.5 to 26.9m for both methods. This trend in resistivity and IP-chargeability anomalies is indicative to presence of clay minerals which are derived from weathering of micaschist which is prevalent within the Igarra schist belt as well as presence of segregated sulphide-bearing quartz veins. Total Horizontal Derivative (THD) map computed from Relative magnetic intensity (RMI), estimated the locations of geological contacts (lineaments) and the lineaments were manually digitized as zones of maximum gradient values with amplitude range of 0.00073 nT/m to 0.03668 nT/m. 1661 lineaments where manually digitized from the remote sensed data ranging from 0.103 km to 0.955 km in length. The dominant lineament trend had orientation in the NE – SW direction. Magnetic lineaments picked from the THD map also showed a NE – SW orientation and correlates with remote sensed lineaments. 1718 composite lineaments were digitized using magnetic and remote sensed data and when plotted on rose diagram showed prevalent NE – SW trend.
Keywords: Electrical resistivity tomography (ERT), Total horizontal derivative (THD), Lineament, Mineralized zones, Basement complex
Cite this paper: Abolarin O. Macpaul, Eze U. Stanley, Ibitoye T. Abel, Bello A. Maruff, Nnorom S. Lotanna, Multitechnique Mineral Exploration in a Part of Igarra North Basement Complex of Southwestern Nigeria, Geosciences, Vol. 10 No. 1, 2020, pp. 10-24. doi: 10.5923/j.geo.20201001.02.
Article Outline
1. Introduction
- The study area is underlain by rocks of the Precambrian basement complex of the Igarra Schist Belt (Jones and Hockey, 1964; Rahaman, 1971, 1973), which lies within the Pan African mobile belt to the rest of the West Africa craton and northwest of the Congo craton. The Nigerian Basement complex (Figure 1) is divided into two zones: (a) western zone in which involved the collision between the passive continental margin of the West African craton and active continental margin (Pharusian belt) about 600Ma (Burke and Dewey, 1972; Leblanc, 1976, Black et al., 1979a,b and Caby et al., the north-south trending elongate schist belt are represented by migmatites, gneisses and granites (b) an eastern zone in which the schist belts are poorly represented; it comprises mainly migmatites, gneisses, and granites (Rahaman, 1976). Evidence from the eastern and northern margins of the West Africa craton indicates that the Pan African belt evolved by plate tectonic processes 1981; as cited in Ayodele and Ofuyah, 2017). The collision at the plate margins is believed to have led to the reactivation of disseminated and segregated mineral deposits in the region. The study area lies in the reactivated part of the belt.
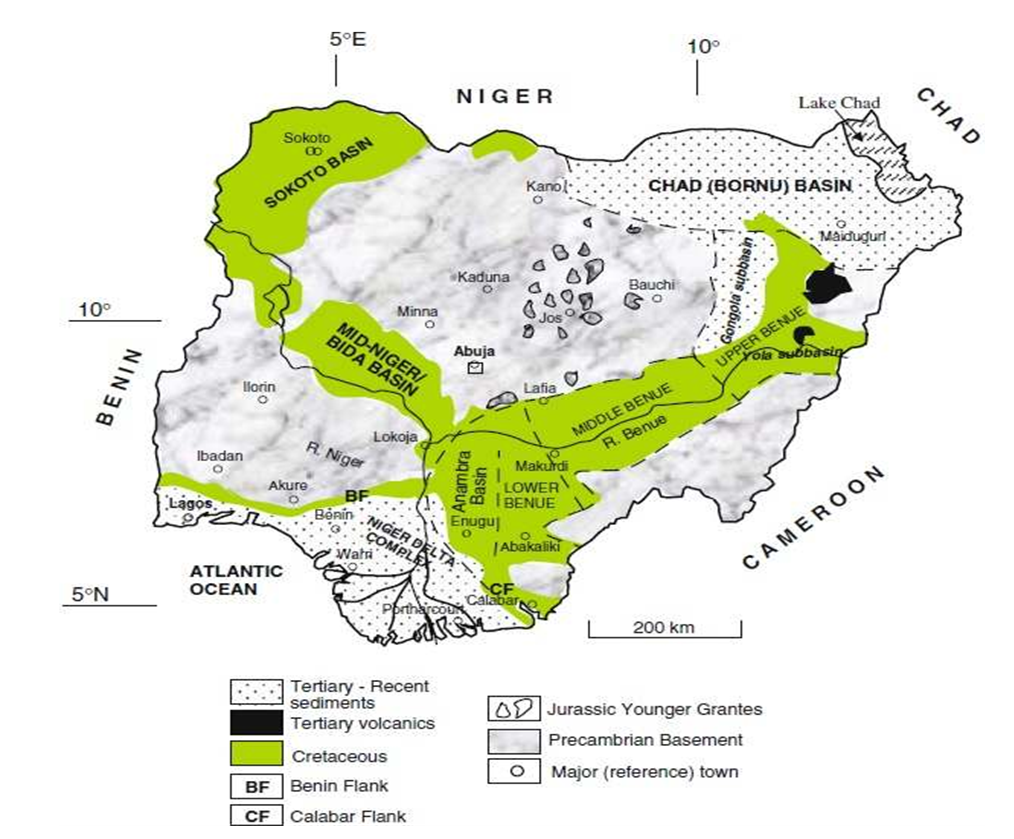 | Figure 1. Geological Map of Nigeria (After Obaje, 2009) |
2. The Study Area
2.1. Location, Climate and Topography
- The study area covers the Northern part of Igarra town with area of overlap in the northern portion with Aiyetoro, southern portion with Igarra South. Geographically, it lies between Latitudes 7° 08′ N and 7° 22′ N, and from Longitude 6° 00′ E to 6° 15′ E respectively. Igarra town covers an area of about 3000 km2 and is flanked in the west by Idoani and Idogun parts of Ondo State (Odeyemi, 1976). The climatic condition of Igarra and its environs falls within the warm-humid tropical climate region where wet and dry seasons are prominent. The dry season is between November and February while the rainy season is mostly between April and October. Average rainfall is between 1000mm and 1500mm with temperature as high as 36.7°C (Udo, 1970).An elongate granite pluton stretches from Igarra to Aiyetoro. The peak of this ridge is about 1550m above sea level.On the western side of the area are the Quartzite ridges which are of lower elevation of about 1100m maximum. The Schists and Metaconglomerates occupy the lowlands and has an elevation of about 650m above sea level.
2.2. Geology of the Area
- The study area is underlain by rocks of the Precambrian basement complex. The rocks of the Igarra schist belt have experienced several deformation and metamorphic episodes. The basement rocks of the Igarra schist belt represent a high grade metamorphic terrain with polyphase deformation. The deformation has caused folding, refolding, foliation, lineaments and shearing of the metamorphic rocks with mainly N-S to NE-SW trends in conformity with other parts of the reactivated basement complex of Nigeria (Rahaman, 1971, 1973; Odeyemi, 1976; as cited in Ayodele and Ofuyah, 2017).Ten rock types observed in the area, they are; Granite, Quartzites, Metaconglomerate, Schist (of two types; quartz-biotite schist and migmatised schist), Metabreccia, Pegmatite, Syenite, Lamprophyre, Dolerite and Quartz veins (Fig. 2). These rocks fall into two main groups which are (i) the metasediment which consist of Quartzites, Metaconglomerate, Schist and Metabreccia (ii) Igneous rocks which comprise the granites, lamprophyre, pegmatite, dolerite and syenite. Structural features found in the area include: Joints, lineation, foliation veins and folds.
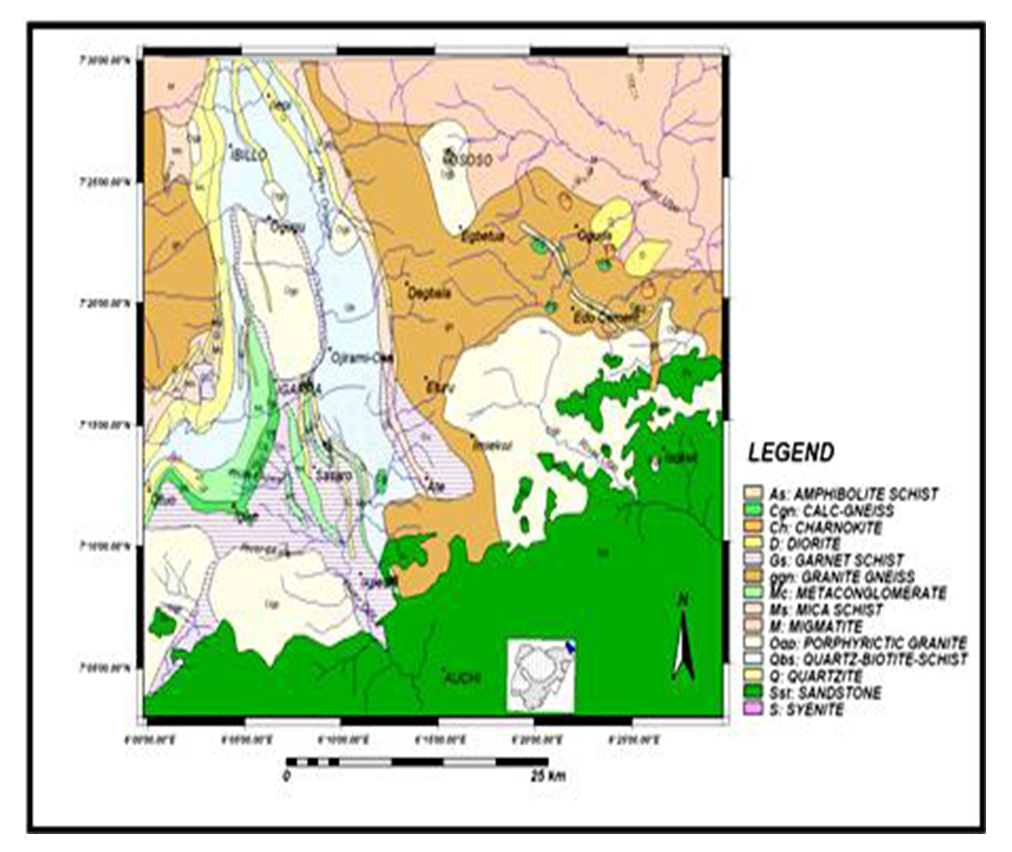 | Figure 2. Geologic map of the Study area (Modified after Odeyemi, 1976) |
3. Methods of Study
- The Igarra schist belt was selected for this study because of its mineral resources potential based on earlier structural geological studies of the area. In this study, 2D electrical resistivity tomography (ERT) data was acquired along seven profiles (L1 to L7). Also, induced polarization (IP)-chargeability data was acquired alongside 2D ERT along Profile 7 (L7) which was close to the centre of the survey outlay. In both cases, ground resistivity measurement was made using SAS-1000 Terrameter with a multi-electrode system. The Wenner array was used with total array length limited by space constraint to 200 m. Ground magnetic data was also acquired in the area along five profiles (L1 to L5) using a high precision fluxgate magnetometer (AMC-6 high precision magnetometer) which measures the vertical component (ZnT) of the Earth’s main field and gives a better picture of the subsurface geology to supplement the resistivity survey for mineral exploration in the area. In each case, IP-chargeability, resistivity and magnetic data were generated and automatically recorded by the resistivity meter and magnetometer. These data were later processed (reduction and correction) and interpreted. The base map of data acquisition is shown in Figure 3. During the magnetic data acquisition, it was imperative to eliminate all factors affecting the recorded field other than those from the Earth’s main field, so that they do not interface with the primary signal and constitute noise. This is because ferromagnetic substance can produce an induced magnetic field in the presence of the Earth's main field and because modern magnetometers are very sensitive (about 0.1 nT in reading accuracy), the field crew running the magnetic survey were self-demagnetized of all ferrous objects.
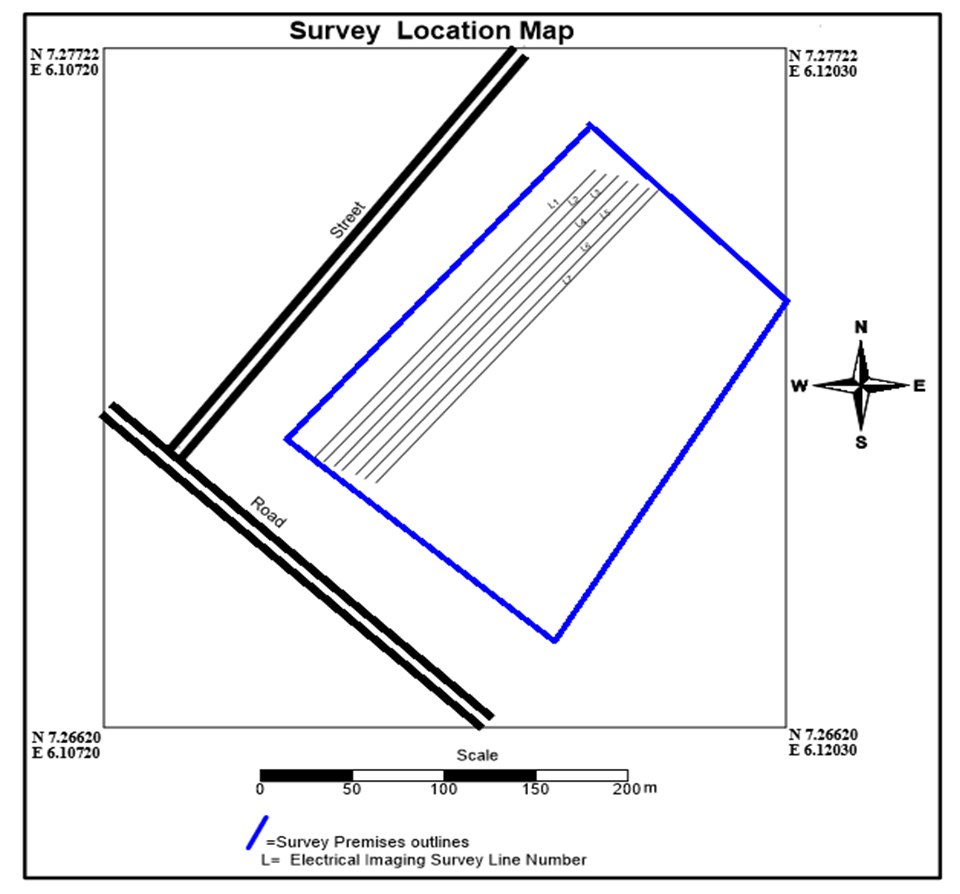 | Figure 3. Base map of study area IGARRA, South-West Nigeria showing profiles occupied during data acquisition |
3.1. 2D Resistivity and IP-Chargeability Data Processing and Interpretation
- The resistivity and IP-chargeability data were extracted from the resistivity meter and processed using 2D Earth Imager and Res2dinv software programs which converts the apparent resistivity data to true subsurface resistivity by inversion. The resistivity meter measures apparent resistivity from which pseudosections were developed and subsequently processed to give the inverted 2D resistivity sections.
3.2. Magnetic Data Processing and Interpretation
- In practice, to make a good geological interpretation from magnetic data, several processing and filtering techniques were applied to the ground magnetic data. The magnetic data was corrected by removing the IGRF field and smoothening in order to remove specious high frequency anomalies associated with background sources. After this, the background signals were removed by plotting the corrected data in Grapher 11 window software to enhance the wanted primary signals, this gave the relative magnetic intensity (Δ). The gridding method was then applied using Surfer-12 software to plot the relative magnetic intensity map of the area which enhanced shallow features and identification of magnetic anomalies beneath the earth’s surface in order to delineate mineralized zones within the subsurface of the study area.Edge Enhancement techniques using Total Horizontal Derivative was then carried out on the residual magnetic intensity in order to map lineaments.If Z is the potential field, then the total horizontal derivative (THDR) is given by:
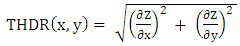 | (1) |
 are derivatives in the x and y directions respectively.The Total Horizontal Derivatives technique is the easiest approach to estimate contact location of bodies at depths (Ndougsa et al., 2012). It has also been shown to be an improved detector detector (Verduzco et al., 2004; Beamish, 2008) with the added advantage of low sensitivity to noise in the data since only calculations of the two first-order horizontal derivatives of the vertical field is required (Phillips, 2002). From the above, a magnetic lineament map for the study area was then produced.
3.3. Processing of Remote Sensing Data
- The Landsat data was georeferenced to the Universal Tranverse Mercator (UTM) projection, WGS 84 datum and Zone 32. Thereafter, the imagery was processed using ERDAS imaging software to improve its thematic and spectral qualities. The map was then overlayed in the overlay module of ARCGIS software for lithological extraction and visualization. The processed image was added in ARCGIS for visual extraction and delineation of lineaments. The remotely sensed lineaments were combined with magnetic lineaments extracted from THD map to produce a composite lineament map for the study area. The composite lineament map was then analysed statistically to obtain the number, lengths, orientation and frequency of occurrence of the lineaments, from which rose diagram was plotted to show the orientations of the lineaments and dorminant direction of the stress field in the area.
4. Results and Discussion
4.1. DC Electrical Resistivity and Induced Imaging
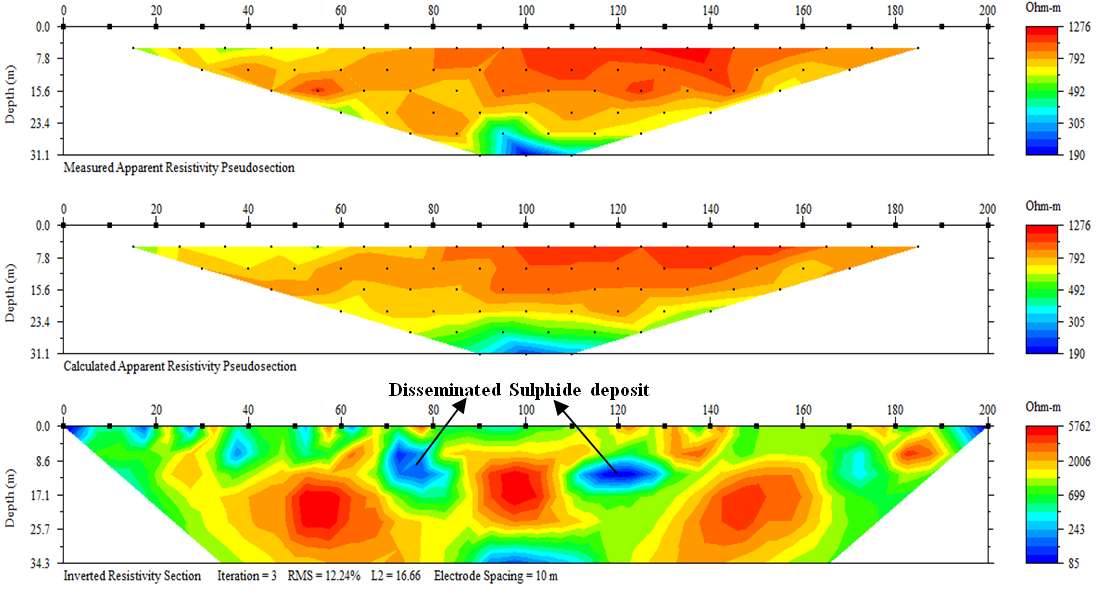
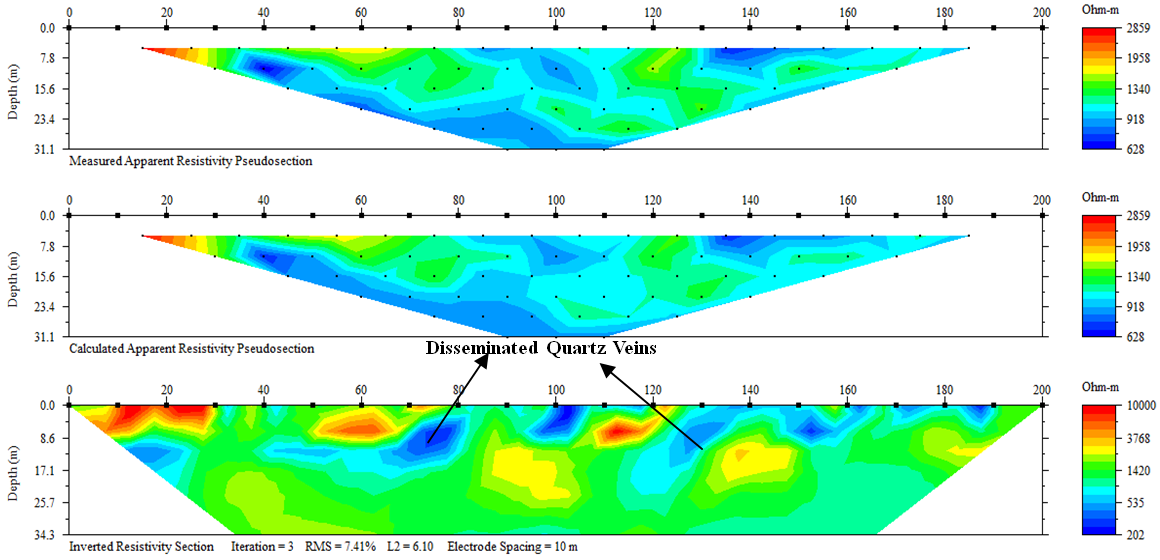
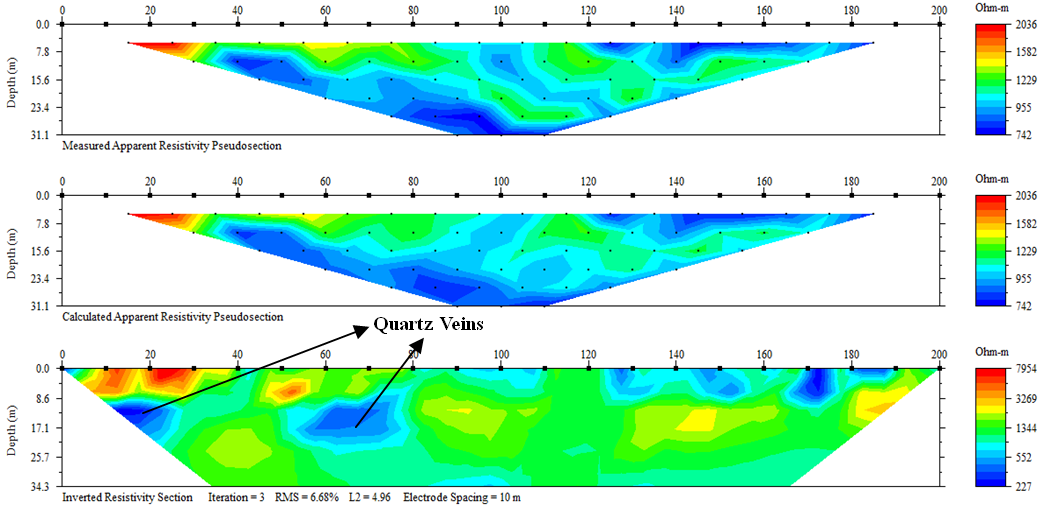
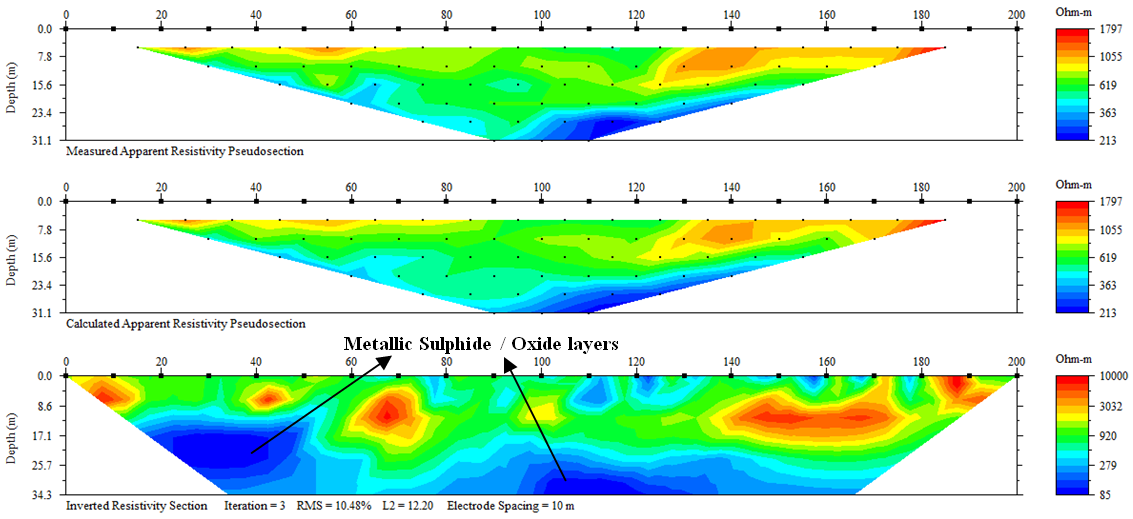
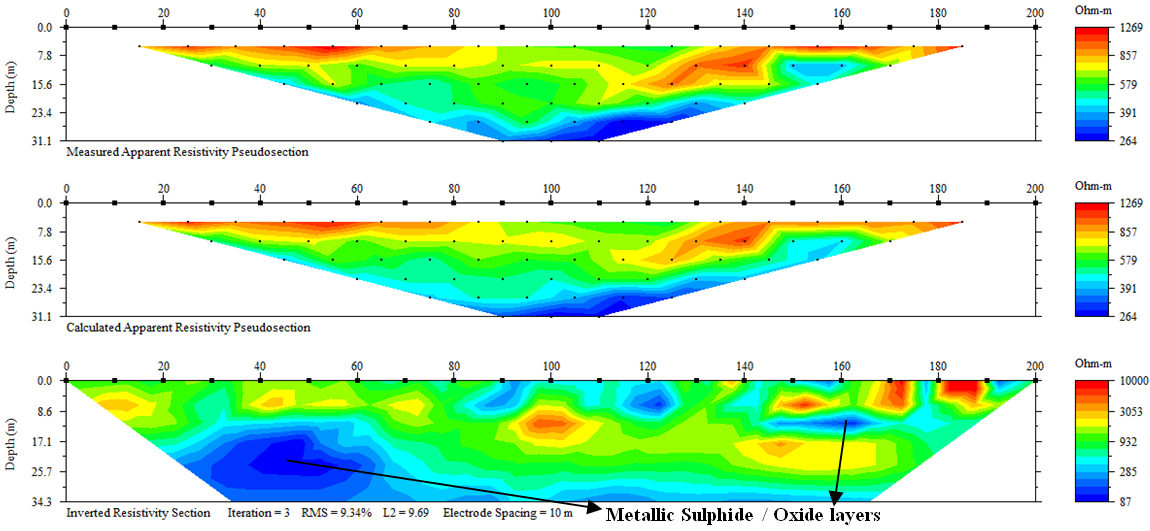
- 2-DResistivity imaging sections along Profiles L1 to L6 is shown in Figures 4(a-f), while IP-chargeability section acquired alongside resistivity data along Profile L7 is shown in Figure 4g. These sections are presented as resistivity-depth structures showing resistivity variation in the vertical and horizontal direction along the survey line.The anomalous zones are seen as areas with relatively low and high resistivity variation with respect to depth compared with the background trend. Areas with very low resistivity values may represent disseminated metallic sulphides / oxides deposits which are good electrical conductors, thus they show a low resistivity anomaly. Areas with relatively high resistivity values represent silicification and presence of quartz veins. In Profile L1 (Fig. 4a), a low resistivity range of 85-243 Ωm was observed disseminated at 8.6m and at 34.3m and interpreted as disseminated metallic sulphide/oxide deposit. In Profiles L2 and L3 (Fig. 4b and 4c), similar trends were observed in resistivity variations compared with the background trend. In Figure 4b, between 8.6 to 17.1m a relatively high resistivity value ranging from 202-535 Ωm was observed and in Figure 4c between 9.0 to 17.1m a relatively high resistivity value ranging from 227-552 Ωm was also observed at electrode spacing of 10-20m and both were interpreted as quartz veins. In Profile L4 (Fig. 4d), a low resistivity value ranging from 85-105 Ωm was observed at 17.1 to 34.3m below the subsurface. This was interpreted as metallic sulphide/oxide deposits. In Profile L5, (Fig. 4e) a resistivity value ranging from 87-120 Ωm was observed in layers at 17.1 to 34.3m and electrode spacing 20 to 160m and interpreted as metallic sulphide/oxides deposits. In Profile L6, (Fig. 4f) a resistivity range of 115-315 Ωm was observed at depth of about 15 to 17m below the subsurface, and was interpreted as quartz veins deposits surrounded by metasdiments found in the area.In Profile L7, (Fig. 4g) were IP-chargeability tomography was sounded alongside resistivity tomography, it was observed that both the resistivity and IP section showed similar trends and consistent anomalies of low resistivity and high chargeability (Fig. 4g). A low resistivity values ranging from 31.9-86.6 Ωm was observed at about 13.5 to 26.9m, while high chargeability value of about 49.5 msec (>20 msec) was observed to the right of the 2D IP-tomography section at about 13.5 to 26.9m which correspond to the low resistivity anomaly (<100 Ωm) observed in the resistivity section. This trend in resistivity and IP-chargeability anomalies is indicative to presence of clay minerals which are derived from weathering of micaschist which is prevalent within the Igarra schist belt as well as presence of segregated sulphide-bearing quartz veins along this profile. The probable homogenous patterns and trends defined in the anomalous zones observed in the resistivity sections imply that the mineralization in the area is structurally controlled.
 | Figure 4a. Inverted 2D Resistivity section beneath Profile 1, IGARRA, SW NIG |
 | Figure 4b. Inverted 2D Resistivity section beneath Profile 2, IGARRA, SW NIG |
 | Figure 4c. Inverted 2D Resistivity section beneath Profile 3, IGARRA, SW NIG |
 | Figure 4d. Inverted 2D Resistivity section beneath Profile 4, IGARRA, SW NIG |
 | Figure 4e. 2D Resistivity section beneath Profile 5, IGARRA, SW NIG |
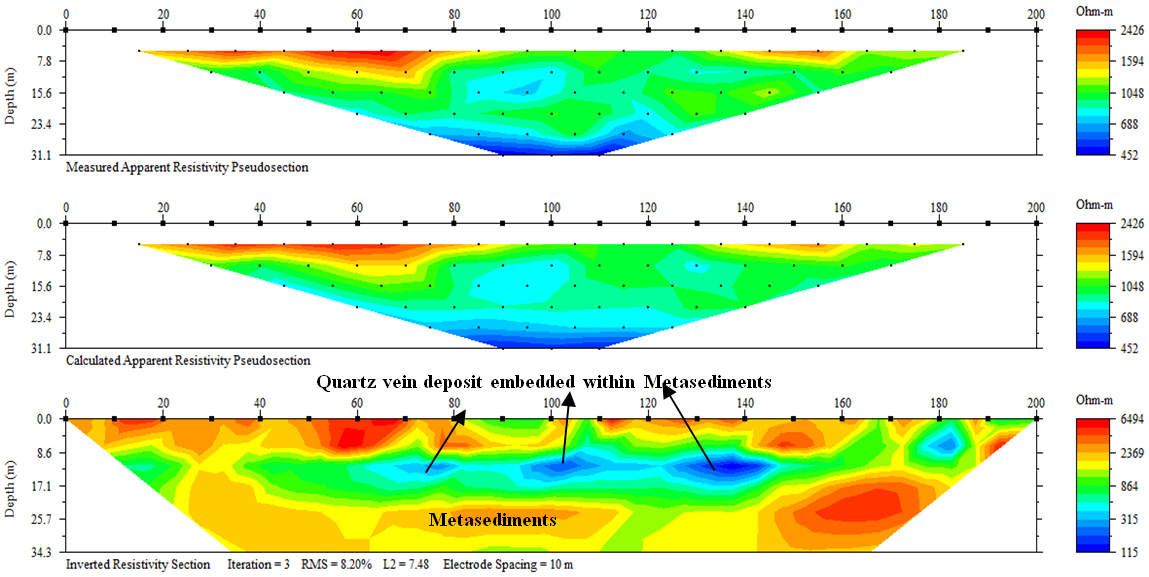 | Figure 4f. 2D Resistivity section beneath Profile 6, IGARRA, SW NIG |
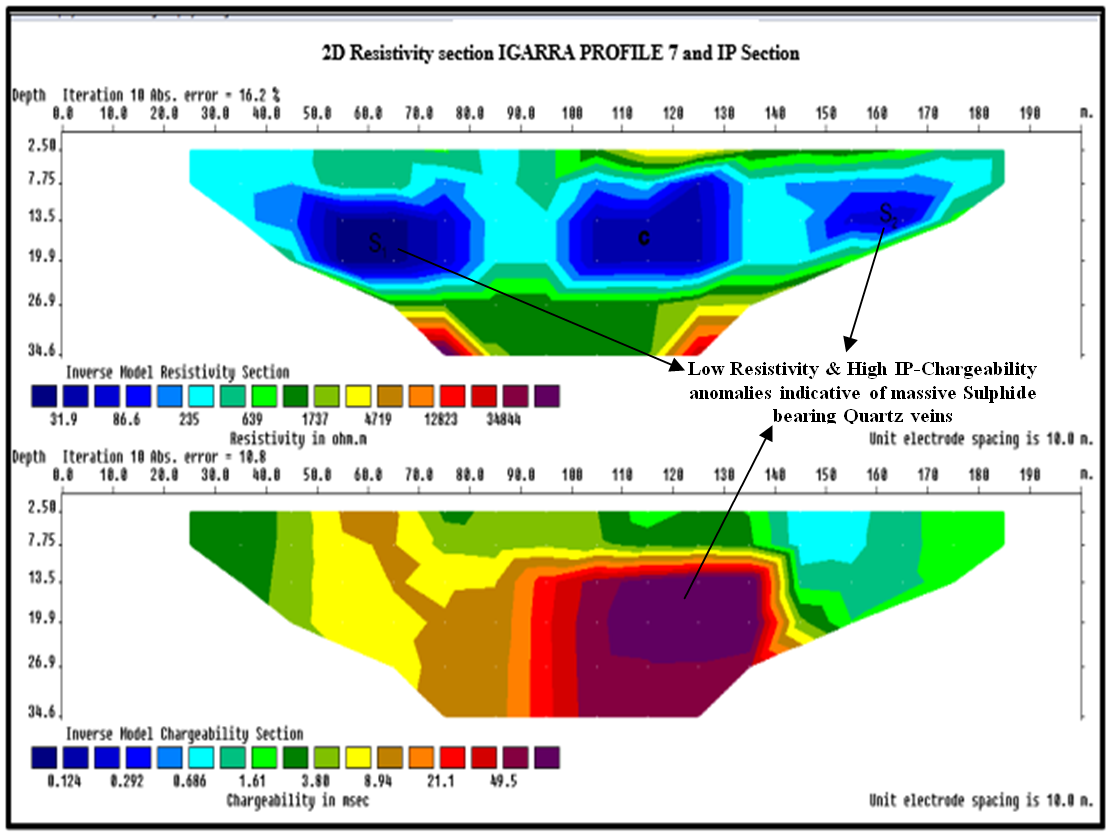 | Figure 4g. 2D Ressistivity tomography and IP-chargeability section beneath Profile 7, IGARRA, SW NIG |
4.2. Magnetic and Remote Sensing Interpretation
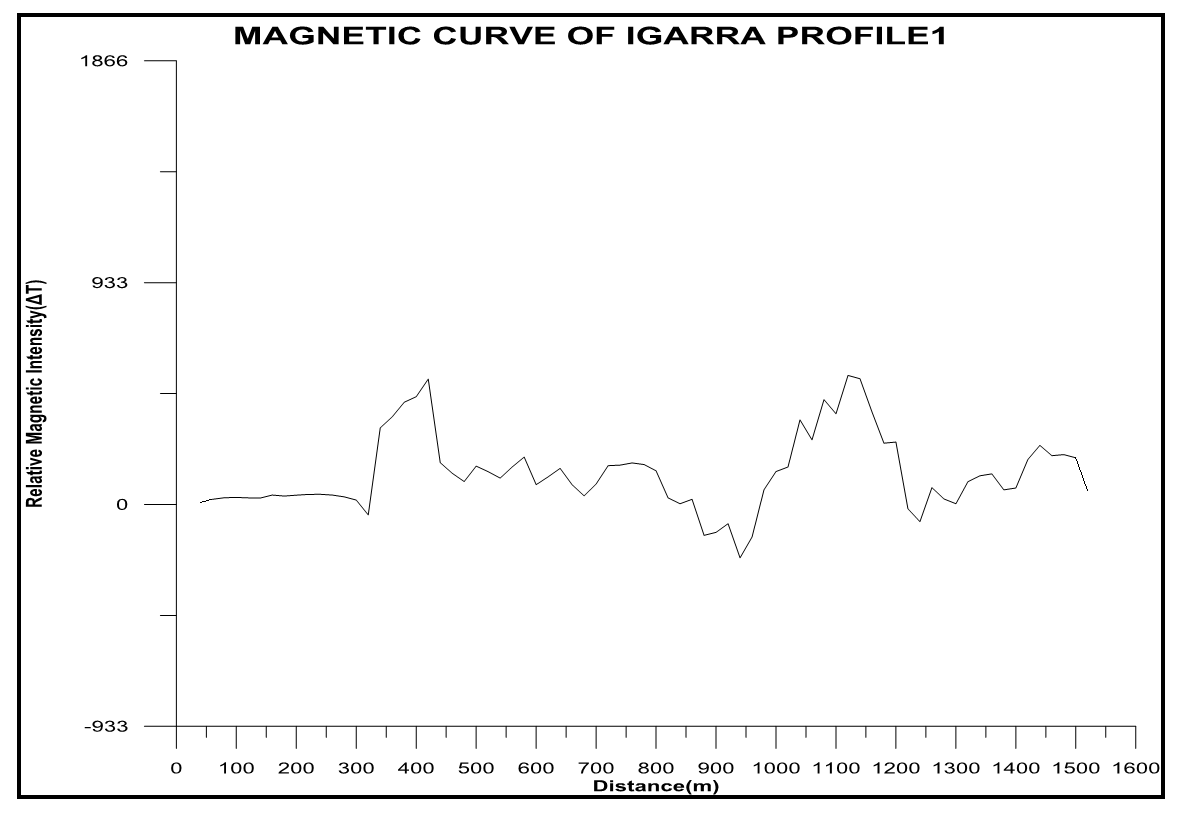
- Figure 5a is the plot of relative magnetic intensity (Δ) against distance along Profile L1. A close observation of the curve shows the variations (rise and fall) in amplitude of magnetic intensity with peak values (highest point) which define anomalous zones with high magnetic intensity which depicts mineralized zones in the subsurface. Figure 5b is the curve of processed magnetic signal (background noise removed and wanted signal enhanced) which depicts the actual magnetic variation in the area as dataset is sharpen by the removal of background noise. Figure 6 is the relative magnetic intensity (RMI) map of the area with shallow features enhanced using filtering operation in Surfer-12 program. A close observation of the map shows anomalous zones with high magnetic intensity (red colour band), low magnetic intensity (yellow colour band) and negative magnetic intensity (green colour band) distributed from Profiles L1 to L5. The anomalies observed on the RMI map appeared to be more localized and distinct with high and low anomalies. The RMI values ranged from -4500 to 3000nT. The varying amplitude of the anomalies is an indication of varying topography and different sedimentary thickness in the study area. These variations in anomaly amplitude also indicates varying amounts of magnetic mineral occurrences within the basement complex rocks of the study area. Areas with high magnetic intensity (red colour band) is considered to be due to the presence of ferromagnetic minerals with higher magnetite content (a common magnetic mineral found in metallic sulphides and oxides) as compared to areas with low and negative magnetic intensity. This interpretation validates the results of 2D geoelectrical survey in the area.
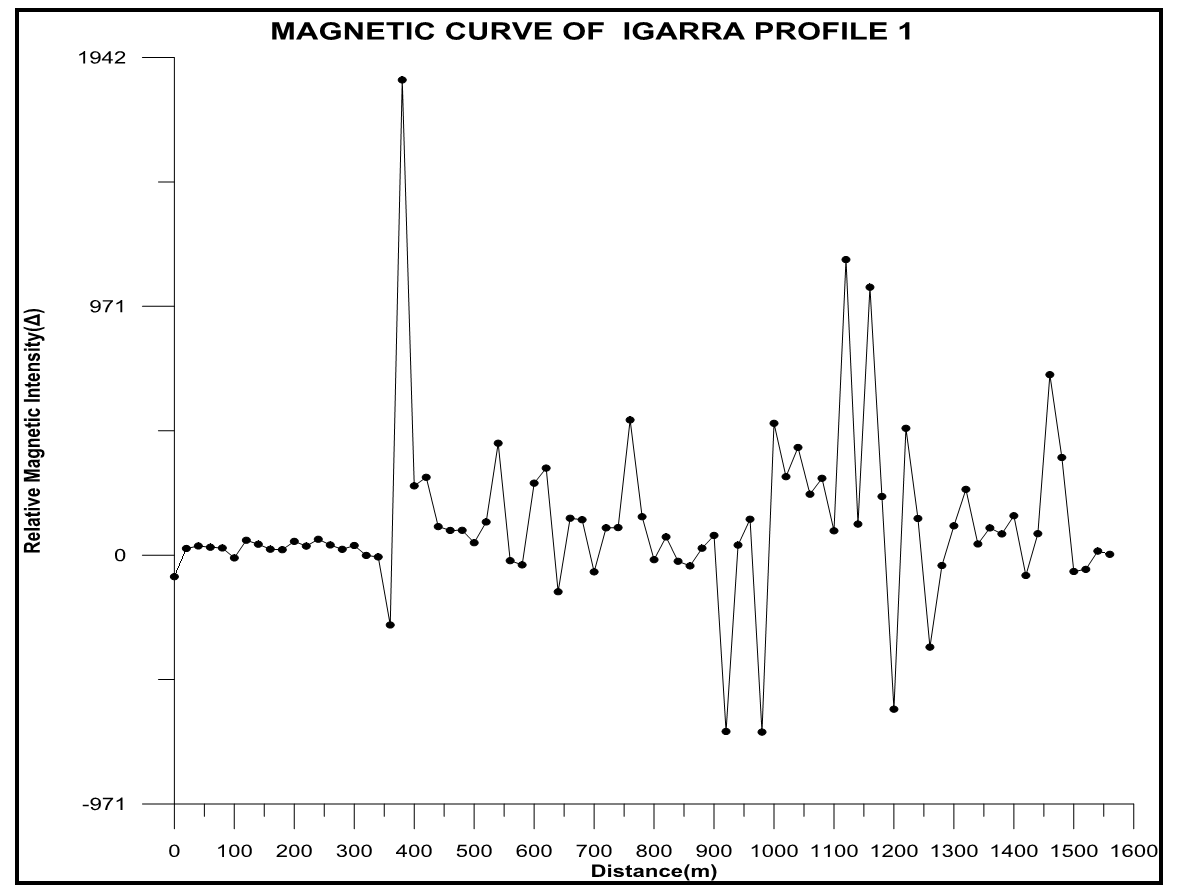 | Figure 5a. Noise Magnetic Signals (signals of interest blended with background signal). |
 | Figure 5b. Processed Magnetic signals (background signals removed and wanted signal enhanced) plotted using Grapher 11 window program |
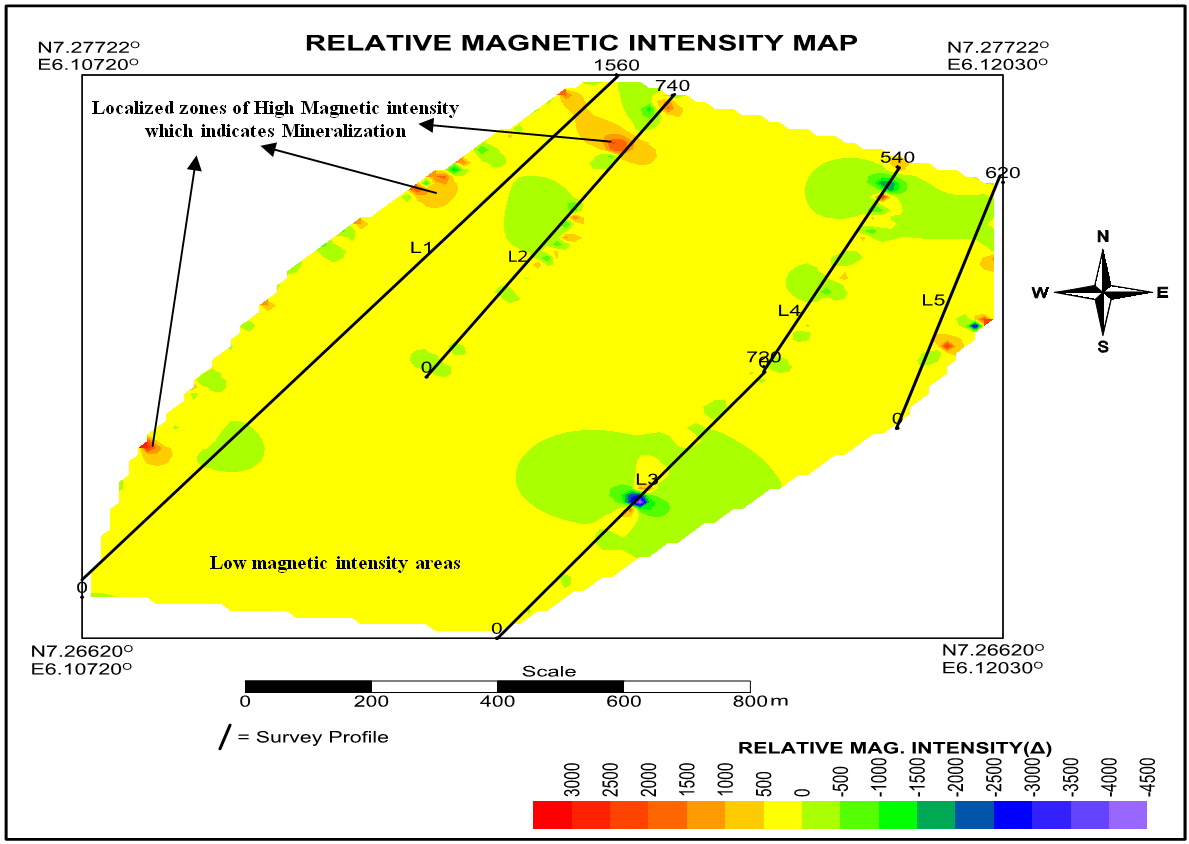 | Figure 6. Magnetic map of area enhanced using filtering operation in surfer-12 program. The map shows mineralized zones within shallow features in the area |
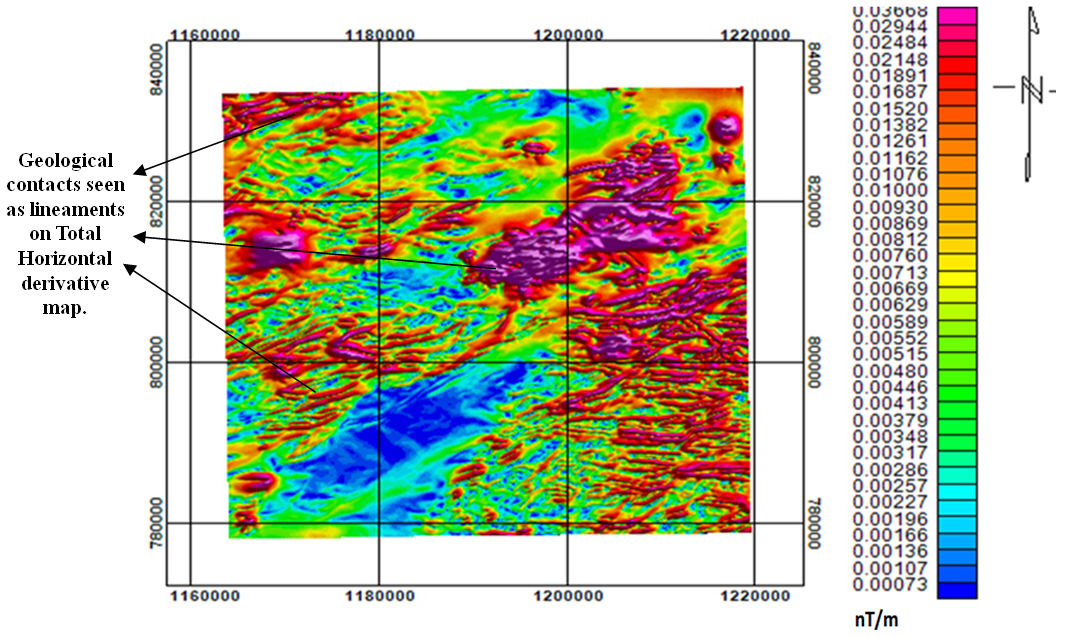 | Figure 7. Total Horizontal Derivative (THDR) Map of the Study Area |
 | Figure 8. Lineaments Extracted from THDR |
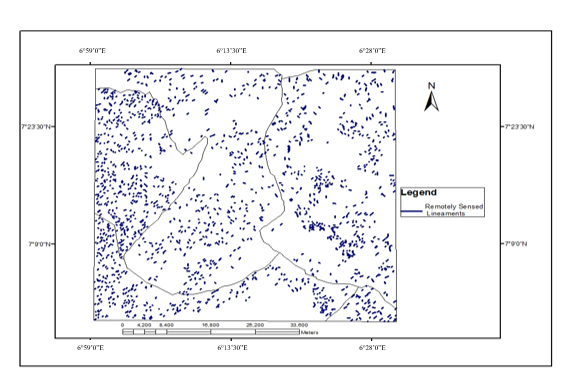 | Figure 9. Remote Sensing Lineament Map of the Study Area |
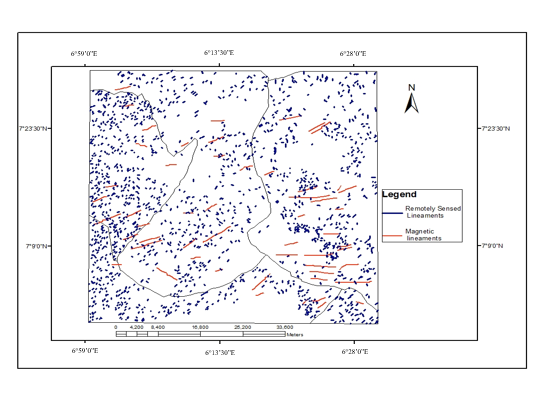 | Figure 10. Composite Lineament Map (Magnetic lineament integrated with Remote sensed lineament). |
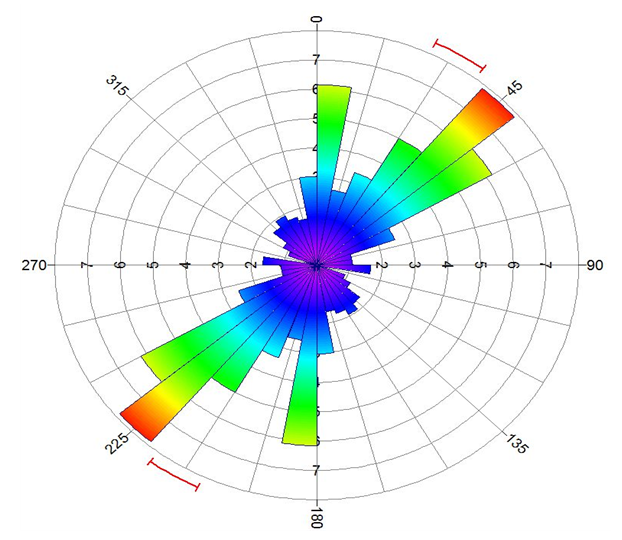 | Figure 11. Rose diagram of the composite lineament (Bin frequency) Banded display showing orientation of Remote sensed lineaments |
|
5. Summary and Conclusions
- We have applied a Multitechnique approach which employs electrical resistivity tomography, IP-chargeability tomography, and Magnetic method for mineral exploration in Igarra North, Edo State. The effectiveness of geophysical methods in mineral exploration are enhanced when several geophysical techniques are integrated together with geological data. This enhances the exact definition of the target of interest. In this study, metallic sulphides / oxides and silica quartz veins within the Igarra schist belt were the targets of interest and the magnetic method was used to define the localized zones of mineralization target in the area. IP-chargeability and resistivity tomography were efficient tools in mapping the depth of occurrence and identifying mineralized bodies. The average depth of occurrence of the mineralized bodies delineated in Profiles L1 to L6 in the area is about 30.0 to 39.6m, although this depth was shallow in Profile L7 (13.5 to 26.9m). The pattern of mineral deposit occurrence implies that the mineralization in the area is structurally controlled. These structures are seen as lineaments and serve as the localized zones of deposition of the ore minerals during the polyphase deformation episodes that occurred in the area. The orientation of the lineament structures picked from the THD map showed good correlation with the remotely sensed lineaments and showed a NE-SW trend along with the N-S trending extensional set. The orientation of lineaments defined in this study is observed to correspond with the general trend of lineaments reported from previous studies in the area.The results obtained indicate the presence of mineral deposits (metallic sulphides/oxides and quartz veins) in the area.
ACKNOWLEDGEMENTS
- We wish to express our gratitude to members of the field crew involved in the geophysical data acquisition for resistivity, IP-chargeability and magnetic surveys that provided the dataset used for this study. Also our profound appreciation goes to Mr. Eremionkhale, Paul who is the Senior Consultant Geophysicist of Alberg Geophysical services Nigeria Limited for his support and allowing us use their workstation platform during the 2D resistivity and IP-Chargeability inversion and magnetic interpretation.