-
Paper Information
- Paper Submission
-
Journal Information
- About This Journal
- Editorial Board
- Current Issue
- Archive
- Author Guidelines
- Contact Us
Geosciences
p-ISSN: 2163-1697 e-ISSN: 2163-1719
2020; 10(1): 1-9
doi:10.5923/j.geo.20201001.01

Comparative Analyses of Uphole and Seismic Refraction Techniques in Near-Surface Attributes Delineation: A Case Study of North-Central Niger Delta
 Abstract
 Reference
 Full-Text PDF
 Full-text HTML
G. I. Alaminiokuma
Department of Earth Sciences, Federal University of Petroleum Resources Effurun, Effurun, Nigeria
Correspondence to: G. I. Alaminiokuma, Department of Earth Sciences, Federal University of Petroleum Resources Effurun, Effurun, Nigeria.
| Email: |  |
Copyright © 2020 The Author(s). Published by Scientific & Academic Publishing.
This work is licensed under the Creative Commons Attribution International License (CC BY).
http://creativecommons.org/licenses/by/4.0/

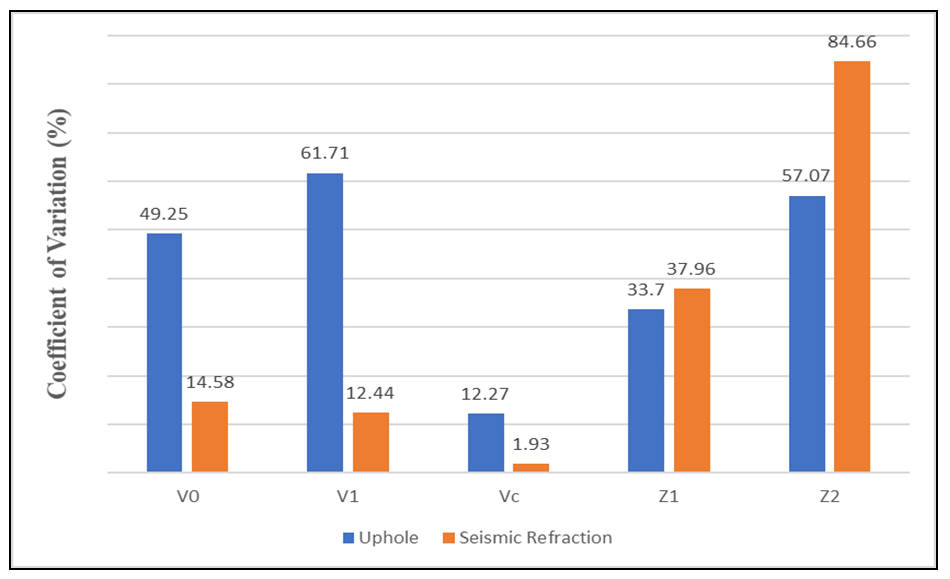
Uphole and seismic refraction techniques used for the delineation of near-surface attributes in the North-Central Niger Delta were comparatively analyzed in order to provide proper guide on the viable technique(s) to meet exploration objectives. Different field parameters and data were considered and statistically compared. Results reveal that the uphole technique is cost-intensive, requires many crew men, time-intensive, limited in areal coverage, delivers small quantity of data in a long period and provides information for mapping hidden and thin layers while the seismic refraction technique is cost-effective, requires few crew men, time-efficient, extensive in areal coverage, delivers large quantity of data within a short period and effectively resolves dipping layers. Statistical computations reveal that the uphole technique has low Coefficient of Variations (CVs) for thicknesses: Z1 (33.70%) and Z2 (57.07%) while seismic refraction technique has high CVs: Z1 (37.96%) and Z2 (84.66%). The low CVs for Z1 and Z2 implies low dispersion and precise estimation of the thicknesses. Conversely, seismic refraction technique has low CVs for velocities: V0 (14.5%), V1 (12.44%) and Vc (1.93%) while the uphole technique has high CVs: V0 (49.25%), V1 (61.71%) and Vc (12.27%). The low CVs for velocities imply low dispersion and good estimation by seismic refraction technique while the high CVs by the uphole technique imply high dispersion and high estimation of velocities. These results suggest that uphole technique provides the most direct measure of the thickness of near-surface layer while seismic refraction technique resolves velocity better around the mean value. Therefore, where resources are favourable, both techniques should be deployed in the same prospect to accurately delineate the near-surface attributes.
Keywords: Uphole, Seismic Refraction, First-Breaks, Velocity, Thickness, Coefficient of Variation, Near-surface, Niger Delta
Cite this paper: G. I. Alaminiokuma, Comparative Analyses of Uphole and Seismic Refraction Techniques in Near-Surface Attributes Delineation: A Case Study of North-Central Niger Delta, Geosciences, Vol. 10 No. 1, 2020, pp. 1-9. doi: 10.5923/j.geo.20201001.01.
Article Outline
1. Introduction
- The exploration for hydrocarbon, solid minerals and the delineation of bedrock for geotechnical engineering significantly depend on the proper description of the near-surface and its attributes such as thickness, velocity, acoustic impedance, absorption coefficient and nature of lithology. This description can be conducted mainly by downhole detectors spread (uphole survey) or surface detectors spread (seismic refraction survey). The particular technique to be chosen by the seismologist may depend on several factors among which are: volume of information required, areal coverage, quality of data acquired, cost and duration of acquisition among others. A technique may be capital intensive yet delivers good quality data while another may be capital effective yet delivers poor quality data and vice versa. Therefore, the choice of a technique based mainly on one of the above-mentioned factors may not suffice. Several studies have been conducted using the uphole/downhole and seismic refraction methods to determine the near-surface/weathered low velocity layer (LVL) characteristics in different parts of the Niger Delta Basin. A summary of some of these previous studies are given in Table 1. A Comparative analysis to reveal the advantages and disadvantages of employing these two main techniques for the delineation of near-surface attributes is very necessary considering their importance on seismic and structural information in 3D/4D reflection survey for oil and gas exploration.
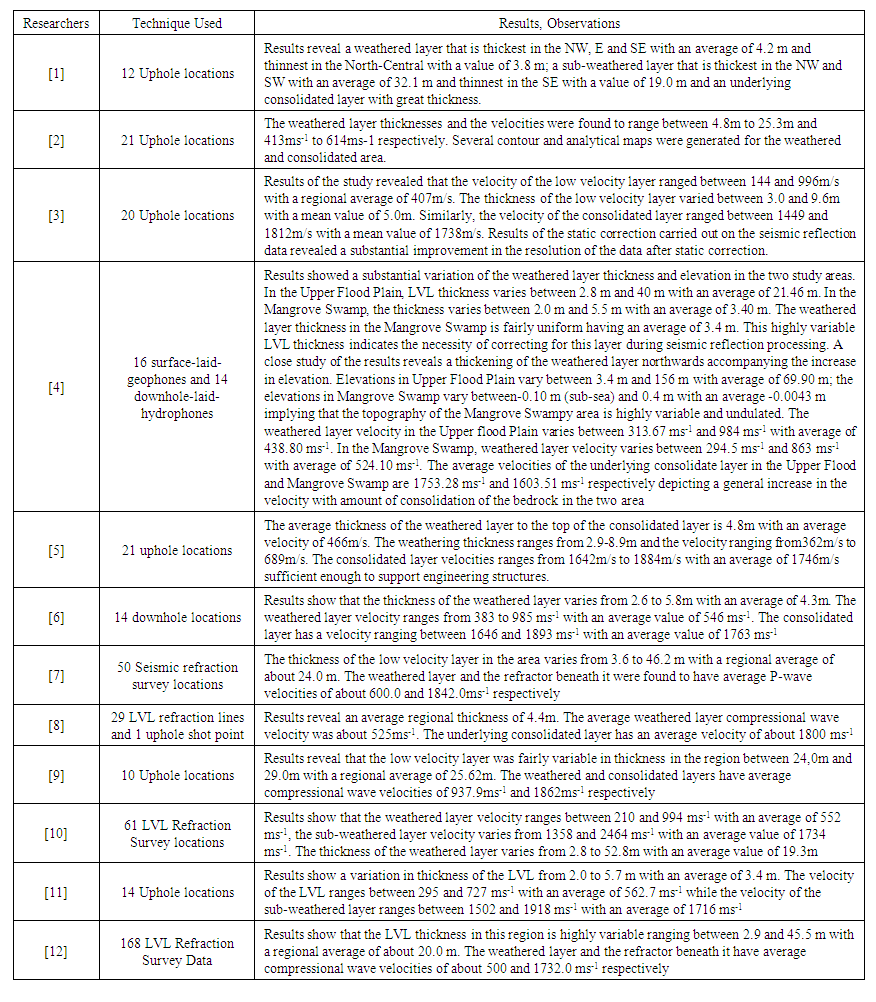 | Table 1. Previous Studies of the Near-surface/Weathered Layer in the Niger Delta |
2. Location of the Study Area
- The area of study is the Niger Delta sedimentary Basin (Figure 1). It is situated on the Continental margin of the Gulf of Guinea in Equatorial West Africa between Latitudes 3° N and 6° N and Longitude 5° E and 8° E. The study area is located in the North-Central part of the Niger Delta Basin (Figure 1) and it covers about 468.5 and 313.16 km2 of surface and subsurface areas respectively. It is delimited by Latitude 05° 00'' 0' and 05° 30'' 0’ and longitude 06° 10'' 0' and 07° 10'' 0' [13].
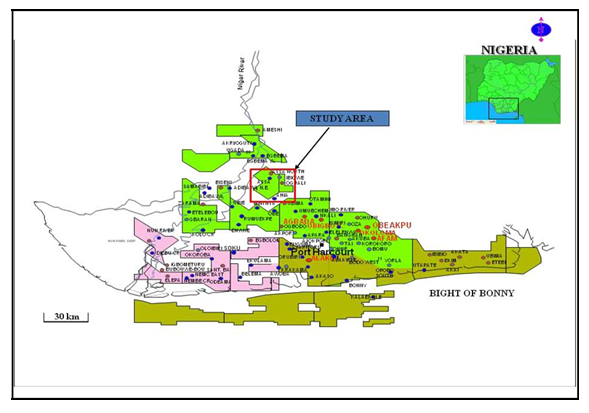 | Figure 1. Map showing the Study Area |
3. Methodology
- The uphole and seismic refraction surveys were conducted within the same 4D seismic prospect in the North-Central onshore Niger Delta on a grid of 4 x 4.km2 (Figure 2). Data for 30 upholes were acquired in order to cover the entire prospect while data for 6 forward and reverse seismic refraction shooting schemes (lines) were acquired at intervals that allowed for a complete coverage of the prospect since they are laterally extensive. The various field acquisition parameters considered in this work are shown in Table 2.
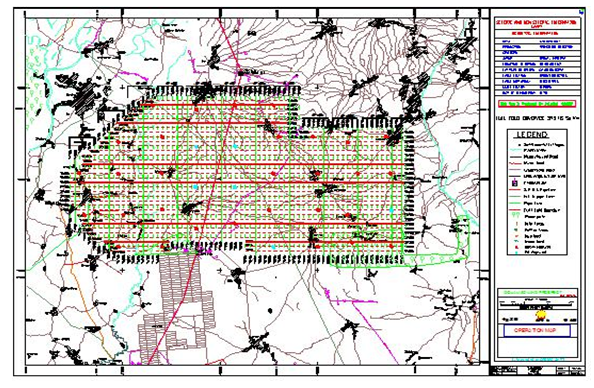 | Figure 2. Uphole and Seismic Refraction Surveys Location Map |
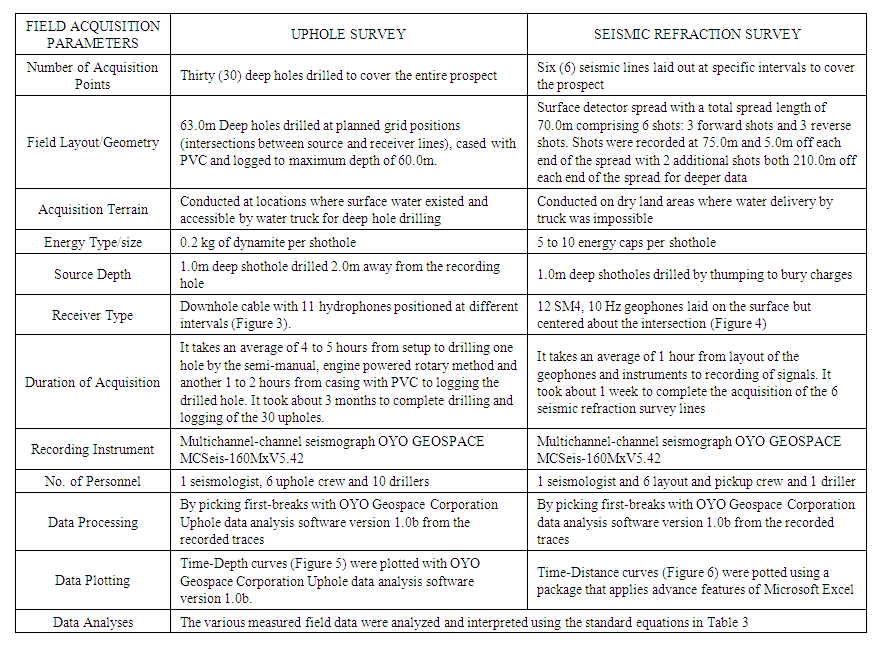 | Table 2. Field Acquisition Parameters for Uphole and Seismic Refraction Surveys |
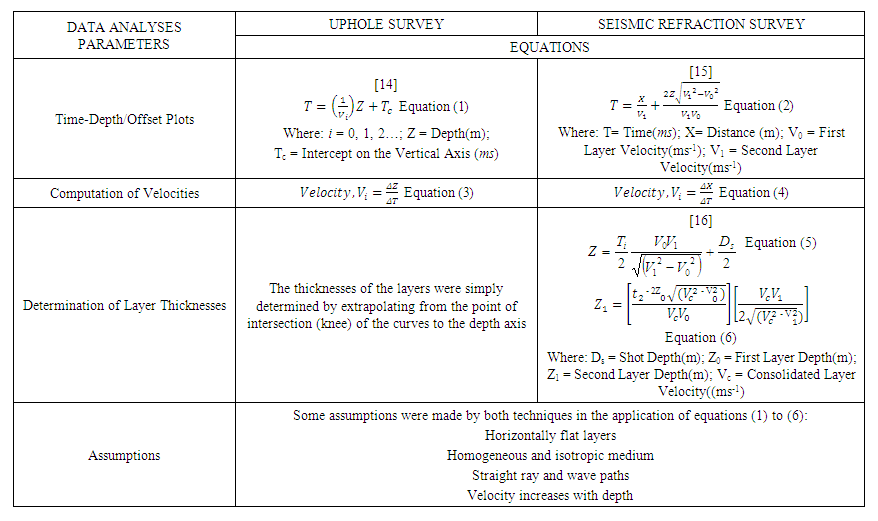 | Table 3. Equations for Uphole and Seismic Refraction Surveys Data Analyses |
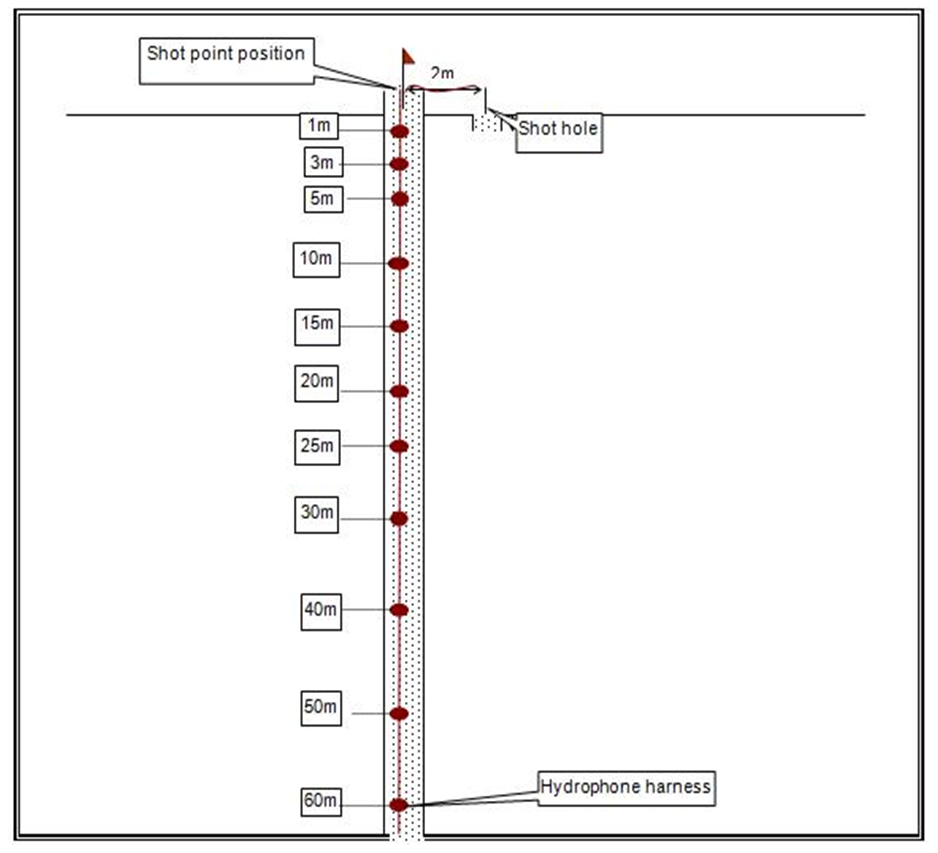 | Figure 3. Uphole Survey Hydrophone/Source |
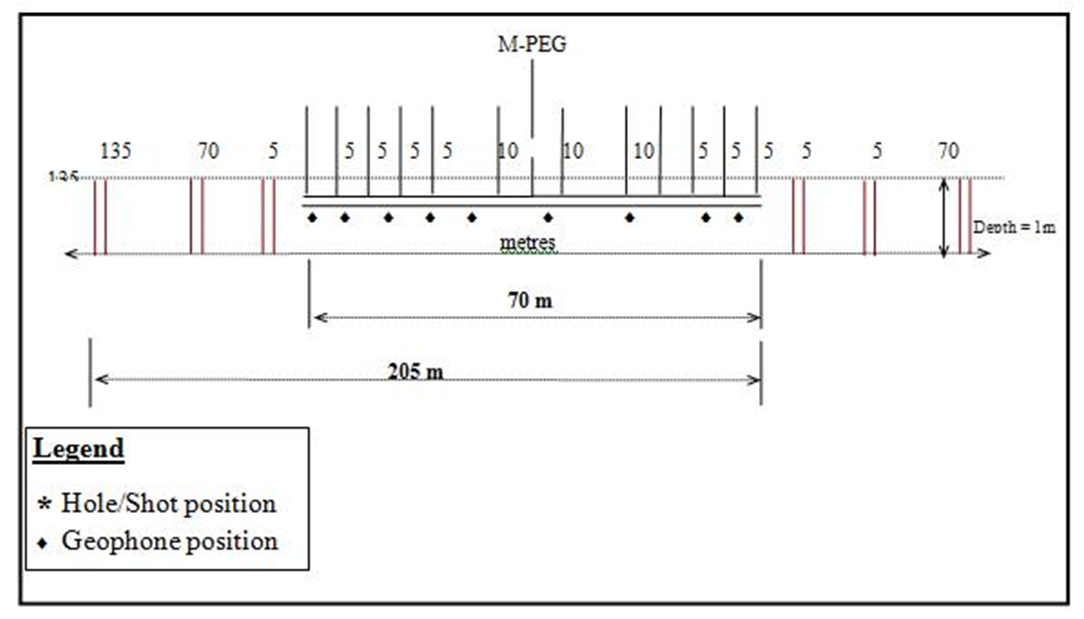 | Figure 4. Seismic Refraction Survey Geophone/Source array |
4. Results
- Table 4.0 shows the measured and computed field results while Figures 5 and 6 show typical Time-Depth/Distance plots for the uphole and seismic refraction techniques respectively.
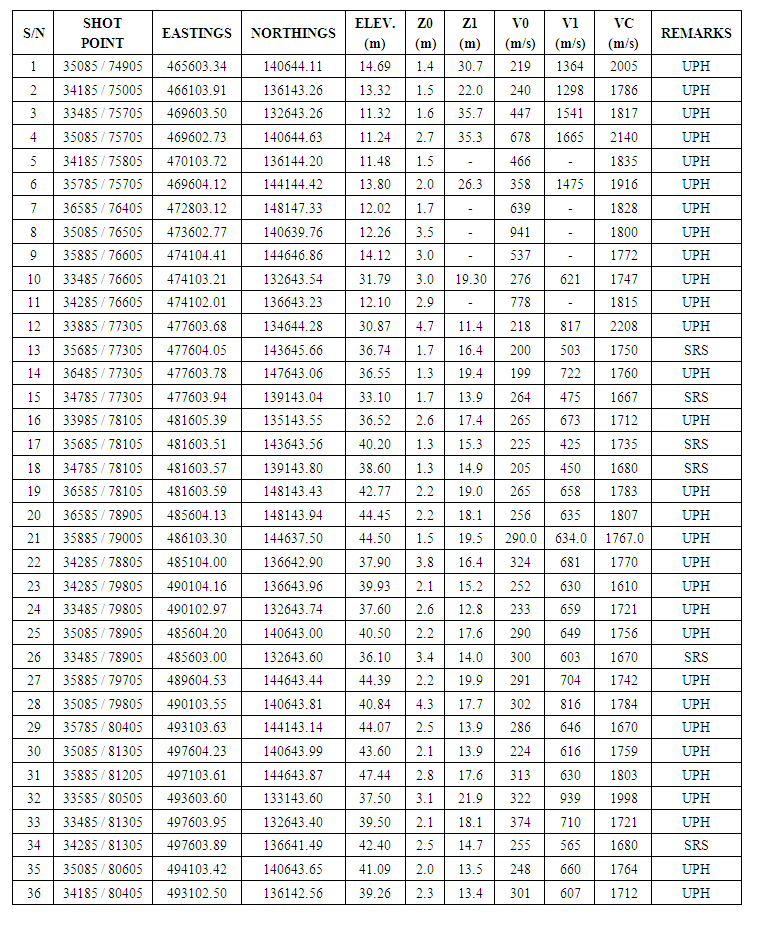 | Table 4. Summary of Uphole (UPH) and Seismic Refraction Survey (SRS) Results |
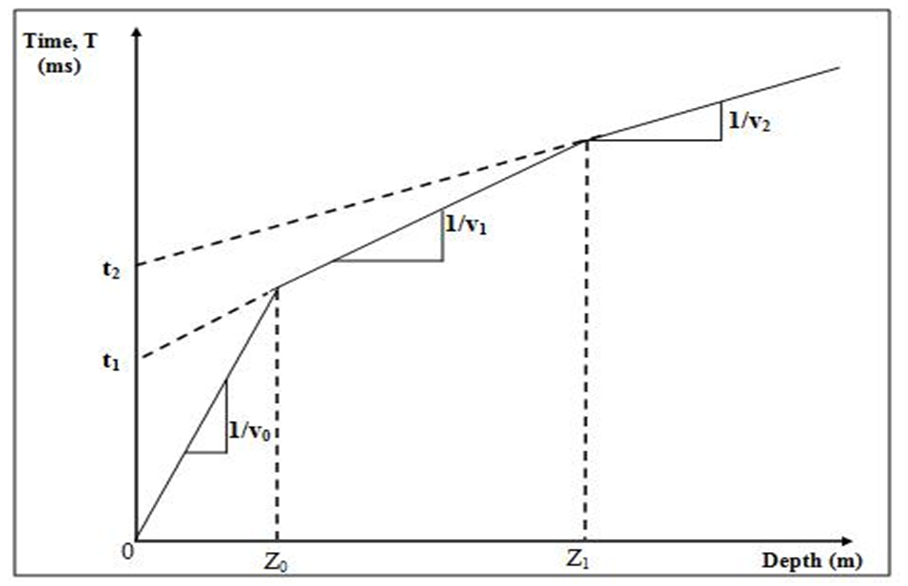 | Figure 5. Typical Time-Depth Plot for Uphole Survey |
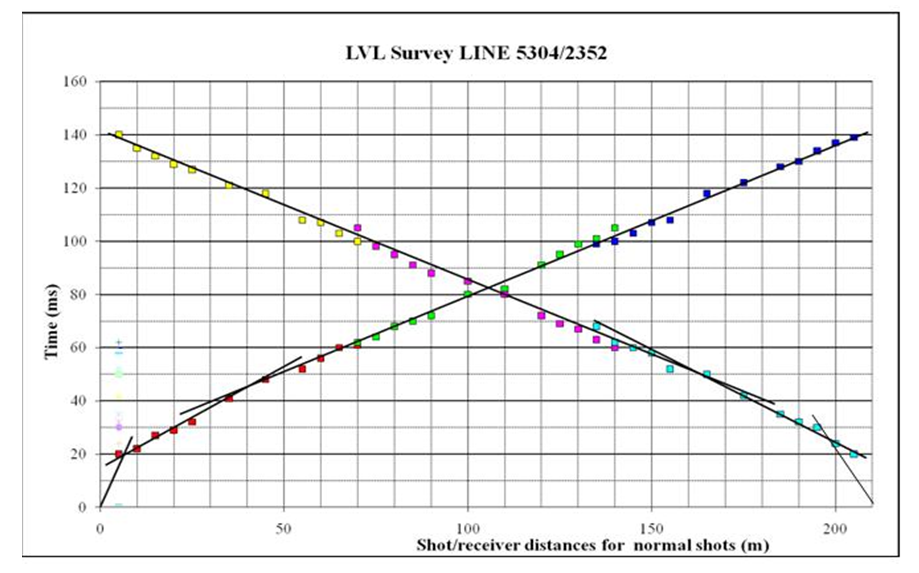 | Figure 6. Typical Forward and Reverse Time-Offset Plot for Seismic Refraction Survey |
4.1. Statistical Comparison of Results
- For good comparative analyses of results, standard deviation, σ of the various results were computed as shown in Table 5. Their respective coefficients of variations (CVs) which give direct statistical comparison of the measure of dispersion between the results obtained by both techniques are computed and shown in Table 6 and Figure 7.
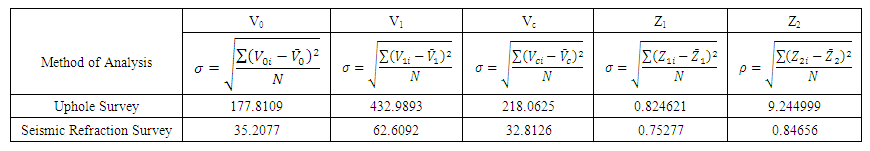 | Table 5. Computation of Standard Deviation (SD) |
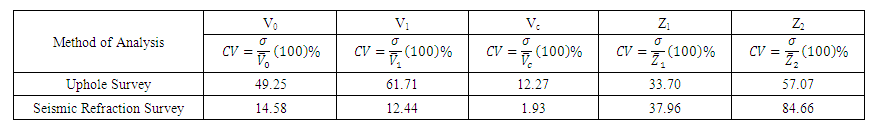 | Table 6. Computation of Coefficient of Variation (CV) |
 | Figure 7. Chart showing the Coefficient of Variations (CV) of the different Near- Surface Parameters for the Uphole and Seismic Refraction Techniques |
5. Discussion
- A visual examination of the data in Table 2 shows the range of values of the different near-surface attributes obtained by the uphole and seismic refraction techniques. It can be observed that the thickness(es) of all the existing layers were not completely resolved by the uphole technique. The technique only recorded complete data for the first layer thickness, Z1 and null data for some of the second layer thickness, Z2 at five shot points: 34185/75805, 36585/76405, 35085/76505, 35885/76605 and 34285/76605 while the seismic refraction technique recorded complete data for the thickness and velocities of both layers. The uphole technique showed greater values for the thicknesses and velocities of the layers. This can probably be attributed to the fact that the hydrophones are located in situ the recording hole as the near-surface is vertically traversed. More so, the coefficients of variations in Figure 7 show the measure of dispersion among the near-surface seismic attributes. The results reveal that the uphole technique has low Coefficient of Variations (CVs) for thicknesses: Z1 (33.70%) and Z2 (57.07%) while seismic refraction technique has high CVs: Z1 (37.96%) and Z2 (84.66%). The low CVs for Z1 and Z2 implies low dispersion and precise estimation of the thicknesses. Conversely, seismic refraction technique has low CVs for velocities: V0 (14.5%), V1 (12.44%) and Vc (1.93%) while the uphole technique has high CVs: V0 (49.25%), V1 (61.71%) and Vc (12.27%). The low CVs for velocities imply low dispersion and good estimation by seismic refraction technique while the high CVs by the uphole technique imply high dispersion and high estimation of velocities. The high CVs may be due to high attenuation of seismic energy resulting to time delays as signals traverse low velocity materials through the mud cake and PVC casing to the hydrophones in the recording hole.
6. Conclusions
- From this study, the following general comparative conclusions shown in Table 7 can be adduced:
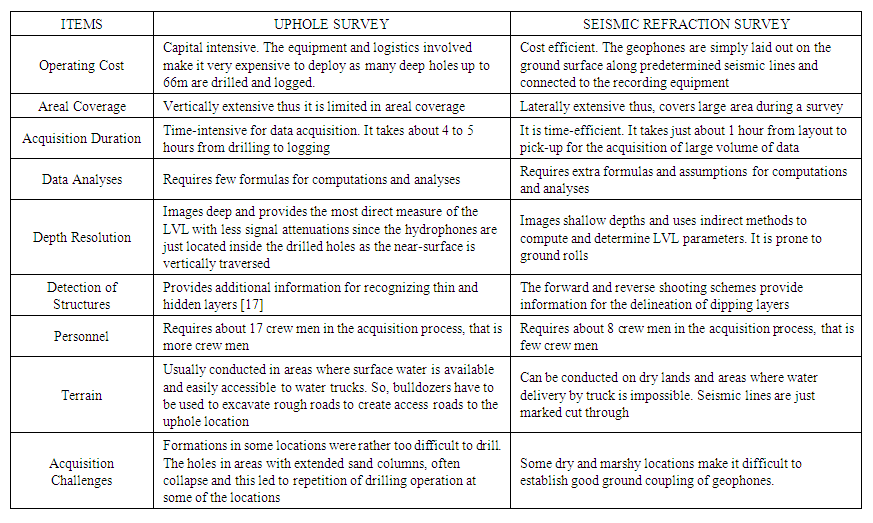 | Table 7. Comparative Conclusions |
7. Recommendations
- For the delineation of the near-surface seismic attributes: LVL thicknesses and velocities, no one technique can be conclusively endorsed as it depends significantly on the available resources, areal coverage, duration of acquisition, quantity and quality of data required. Of these, the quality of data required is of paramount importance to the seismologists in the multinational oil and gas companies. Whereas, the uphole technique deploys many crew men to suitably provide the most direct measure of the LVL in a long period, the seismic refraction technique deploys few crew men to acquire more quantity of data in a short period and resolves the dipping layer within the near-surface. So, where the resources are favourable, it is recommended that both techniques be deployed together to accurately delineate the near-surface seismic attributes considering the importance/effects of this zone in 3D/4D seismic reflection exploration for hydrocarbon.
ACKNOWLEDGEMENTS
- The authors wish to thank Shell Petroleum Development Company Nigeria for making available the data used in this research and to the Department of Petroleum Resources for the permission to use the data.