-
Paper Information
- Next Paper
- Paper Submission
-
Journal Information
- About This Journal
- Editorial Board
- Current Issue
- Archive
- Author Guidelines
- Contact Us
Geosciences
p-ISSN: 2163-1697 e-ISSN: 2163-1719
2019; 9(2): 50-56
doi:10.5923/j.geo.20190902.02

Curie-Temperature Depth and Heat Flow Deduced from Spectral Analysis of Aeromagnetic Data over the Southern Bida Basin, West-Central Nigeria
 Abstract
 Reference
 Full-Text PDF
 Full-text HTML
Ikumbur Emmanuel Bemsen1, Chinwuko Augustine Ifeanyi2, Ogah Vincent Edaba1, Akiishi Moses3, Usman Ayatu Ojonugwa4, Udoh Abraham Christopher5
1Department of Geology, Benue State Polytechnic, Ugbokolo, Nigeria
2Department of Geological Sciences, Nnamdi Azikiwe University Awka, Nigeria
3Department of Physics, College of Education Oju, Nigeria
4Department of Geophysics, Alex Ekwueme University Ndufu-Alike, Ikwo, Nigeria
5Department of Geosciences, Akwa Ibom State University, Ikot Akpaden, Nigeria
Correspondence to: Ikumbur Emmanuel Bemsen, Department of Geology, Benue State Polytechnic, Ugbokolo, Nigeria.
| Email: |  |
Copyright © 2019 The Author(s). Published by Scientific & Academic Publishing.
This work is licensed under the Creative Commons Attribution International License (CC BY).
http://creativecommons.org/licenses/by/4.0/

The purpose of the study is to estimate the curie-temperature depth and heat flow in the southern Bida basin, which is deduced from spectral analysis of aeromagnetic data over the southern Bida basin of west-central Nigeria. The area covered is about 12,000 km2 which lies on coordinates 8°00′N, 6°00′E and 9°00′N, 7°00′E. The qualitative and quantitative interpretations of aeromagnetic map over part of the southern Bida basin were carried out using spectral analysis. The aeromagnetic maps were digitized along flight lines of 2 km interval. Curie point depths for the study area were estimated using spectral analysis of aeromagnetic data. The results show that the average depth to top of magnetic sources (Zt) obtained was 1.388 km, while the average depth to centroid (Zo) was 13.188 km. The average Curie point depth obtained from the study area was 24.987 km. The Curie point depths are shallow at Gulu and Kirri areas; these correspond to high values of heat flow in those areas. This confirms that Curie depths are direct indicators of the thermal structure of the area. The average heat flow obtained is 59.751 mW/m2. This value is good for utilization for exploration of an alternative source of geothermal energy, especially at Gulu and Kirri areas. The spectral analysis data in conjunction with heat flow information revealed an almost linear relationship between heat flow and Curie depths.
Keywords: Geothermal gradient, Depths to basement, Heat flow and Spectral analysis
Cite this paper: Ikumbur Emmanuel Bemsen, Chinwuko Augustine Ifeanyi, Ogah Vincent Edaba, Akiishi Moses, Usman Ayatu Ojonugwa, Udoh Abraham Christopher, Curie-Temperature Depth and Heat Flow Deduced from Spectral Analysis of Aeromagnetic Data over the Southern Bida Basin, West-Central Nigeria, Geosciences, Vol. 9 No. 2, 2019, pp. 50-56. doi: 10.5923/j.geo.20190902.02.
Article Outline
1. Introduction
- The application of spectral analysis to the interpretation of potential field data is one method that can be used to determine the basement depth, and is now sufficiently well established (Spector and Grant, 1970). This present study concerns the evaluation of the total aeromagnetic anomalies for estimation of curie-temperature depth and heat flow in the Southern part of Bida basin, West-Central Nigeria, which has in the past received limited attention from geoscientists especially geophysicists. The reasons may be due to lack of immediate geologic and economic values, although it is fast becoming an important research area for geoscientists. Geophysical studies in the area are limited, without records of crustal temperature studies. Curie-temperature depth combined with heat flow assessment would complement greatly the geophysical information of the area to bridge the gap of absence of crustal temperature information.Use of aeromagnetic data to estimate curie temperature depth is not entirely new and has been applied to various parts of the world, either by employing the frequency domain method or analyzing isolated magnetic anomalies due to discrete sources. The present research uses spectral analyses to estimate curie–temperature depth and heat flow to determine the geothermal history of the area. The Curie point depth is known as the depth at which the dominant magnetic mineral in the crust passes from a ferromagnetic state to a paramagnetic state under the effect of increasing temperature (Hisarlis, 1996; Nwankwo, et al., 2011; Kasidi and Nur, 2012; Megwara, et al., 2013, Anakwuba and Chinwuko, 2015, Abraham and Nkitnam, 2017). For this purpose, the basal depth of a magnetic source from aeromagnetic data is considered to be the Curie point depth (Kasidi and Nur, 2012). This depth can be approximated from aeromagnetic survey data through spectral analysis. The assessment of variation of the curie isotherm of an area can provide valuable information about the regional temperature distribution at depth and the concentration of subsurface geothermal energy (Tselentis, 1991). One important parameter that determines the relative depth of the curie isotherm with respect to sea level is the local thermal gradient i.e. heat flow (Hisarlis, 1996). Results have shown that a region with significant geothermal energy is characterized by an anomalous high temperature gradient and heat flow (Tselentis, 1991). It is therefore expected that geothermally active areas would be associated with shallow Curie point depth (Nurri et al., 2005). Estimates of depth to Curie temperature can provide valuable insights in the assessment of geothermal energy, calculation of thermal conductivity and tectonic/geodynamic evolution. In this present research, we studied the geothermal structure of the Southern Bida basin, based on the Curie point depth estimations. This work is aimed at filling the missing gap in the crustal temperature information of the study area in addition to providing clues to likely productive zones. The results will throw more light on the geology and other features of the area, including the depth to magnetic sources and curie-temperature depth.
2. Geology of the Study Area
- The area of study, which is the southern part of Bida basin, lies on coordinates 8°00′N, 6°00′E and 9°00′N, 7°00′E. It is an area of about 12,000 km2 situated at the West-Central Nigeria. The Bida Basin is an elongated NW-SE trending depression perpendicular to the main axis of the Benue Trough of Nigeria. The basin is a gentle down-warped shallow trough filled with Campanian-Maastrichtian marine to fluviatle strata believed to be more than 300m thick (Jones, 1958; Adeleye, 1976). The Basin might be regarded as northwestern extension of Anambra basin, which is found in the southeast, both of which were major depocenters during the second major sedimentary cycle of southern Nigeria in the Upper Cretaceous time (Obaje, 2009). The original rock of the area could have been subjected to considerable erosion before the Upper Cretaceous beds were laid down. The sandstones consist of unfossiliferous shallow water sandstones and beds. It is possible that these sandstones could have covered a large area (continuous to the Sokoto Basin) than now (Russ, 1957). Tertiary earth movements impacted low dips to this Formation leading to erosion over wider areas. The youngest rocks of the area are laterites and alluvial, terrace and terrestrial deposits of tertiary and recent age (Russ, 1957). According to Agyingi (1991), both surface and subsurface information available is suggestive of Post-Santonian origin as sediments in Bida basin are generally undisturbed (Fig. 1). Maximum sedimentary thickness of up to 3.30km has been recorded in the basin from aeromagnetic interpretation (Agyingi, 1991). The study area is underlain by three distinct formations namely; Lokoja, Patti and Agbaja Formations (Akande, et al., 2005 and Usman et al., 2017). According to Akande, et al., (2005), the Patti Formation which is the only stratigraphic unit containing carbonaceous shale in the Bida basin is sand witched between the order Campanian-Maastrichtian Lokoja Formation (conglomerates, sandstones and claystones) and younger Agbaja Formation which is mainly ironstones.
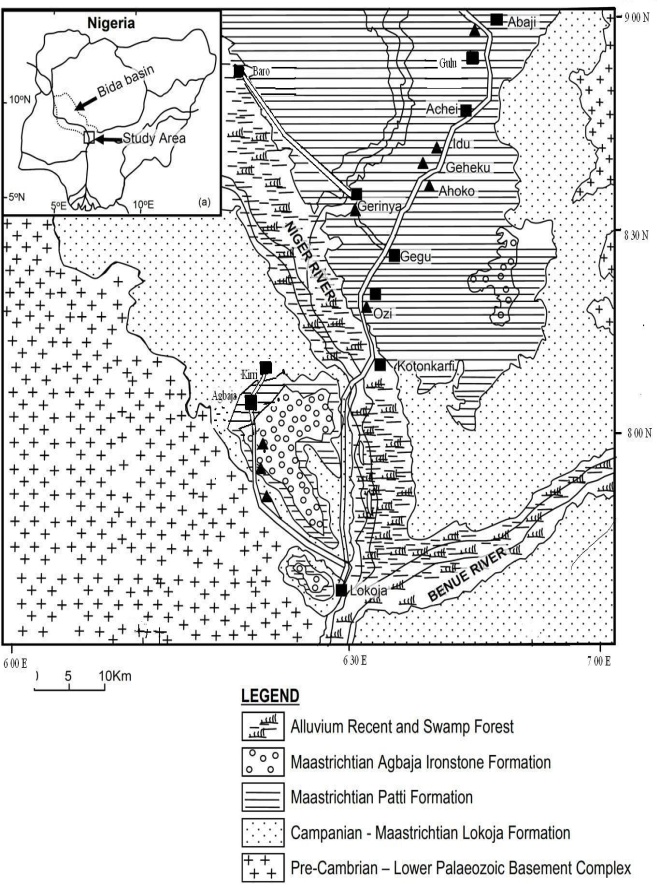 | Figure 1. Location and Geologic Map of Study Area (After Agyingi, 1991) |
3. Methodology
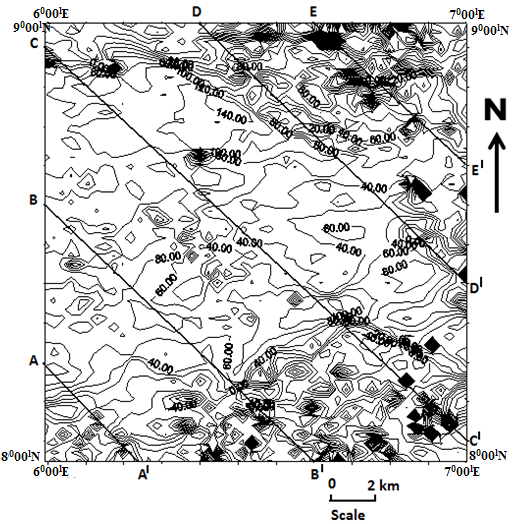
- Four digitized aeromagnetic maps (sheets 205, 206, 226 and 227) were acquired, assembled and interpreted. These maps were obtained as part of the nationwide aeromagnetic survey sponsored by the Geological Survey Agency of Nigeria. The data were acquired along a series of NW-SE flight with a spacing of 2 km and an average flight elevation of about 150 m while tie lines occur at about 20 km interval. The area covered is about 12,100 km2. The first step in the present study was to assemble the four maps covering the survey area. The next step was to contour the map to produce the total field aeromagnetic intensity map. The contouring was done using contouring software (Surfer Version 32).Furthermore, the contoured total-field intensity map contains both the regional and residual anomaly. The regional gradient was then removed from the map by fitting a linear surface to the digitized aeromagnetic data using a linear regression technique according to Likkason (1993) as;
 | (1) |
 = the magnetic value at
  and
and  co-ordinates. The Least squares method of statistical analysis was used to obtain the constants (a, b and c) and the trend surface equation (regional gradient) becomes;
 | (2) |
4. Results and Discussion
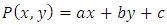
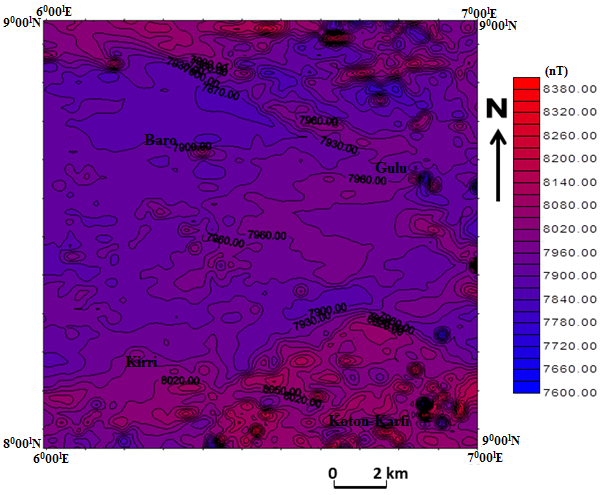
- The total magnetic field from the study area ranges from 7600 to 8380 nanotesla (nT). Higher values are found in the northern and southern parts, and lower values in the central region (Figure 2). The closely spaced linear sub-parallel orientation of contours in the northern and southern parts of the study area suggests that faults or local fractured zones may possibly pass through these areas (Figure 3). Such geologic features may appear as thin elliptical closures or nosing on an aeromagnetic map. The elliptical contour closures seen in the study area suggests the presence of magnetic bodies (Ikumbur et al., 2013). These features represent geologic lineaments. The main trend of the lineament is East-West (E-W), while few trend North-East to South-West (NE-SW). The residual magnetic anomaly map (Figure 3) shows that the contour lines are widely spaced in the central part of the study area which shows that there are thicker sediments in the region, indicating that the depth to basement is higher compared to the closely spaced contours in the northern and southern parts which suggest shallow sedimentary thickness. Figure 3 also shows positive magnetic anomalies indicating deeper depths at the central region, while the northern and southern portions show negative anomalies indicating shallower depths.
 | Figure 2. Total Magnetic Intensity map of the study area (Contour Interval ≈ 30nT) |
 | Figure 3. Residual Anomaly map of the study area with profile lines (Contour interval ≈ 30nT) |
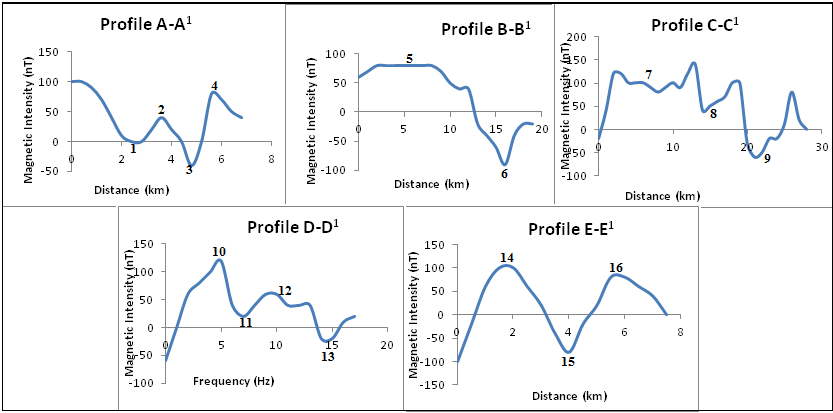 | Figure 4. Graphs of Magnetic anomalies taken within the study area |
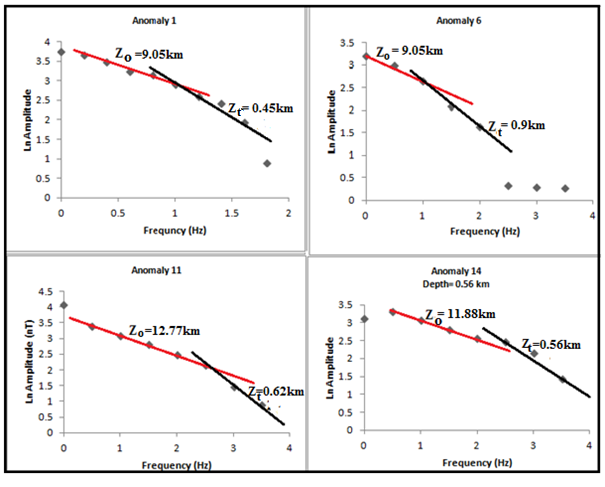 | Figure 5. Graphs of amplitude spectral for various anomalies |
|
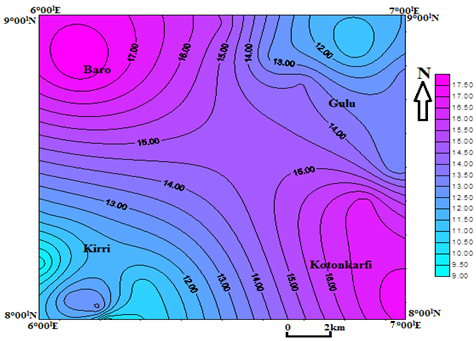
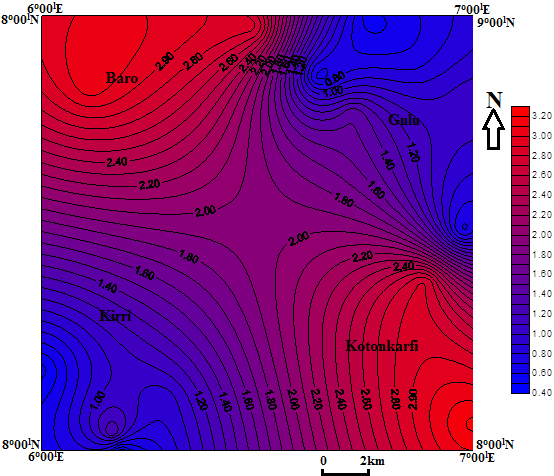 | Figure 6. Distribution map showing depth-to-top of magnetic sources |
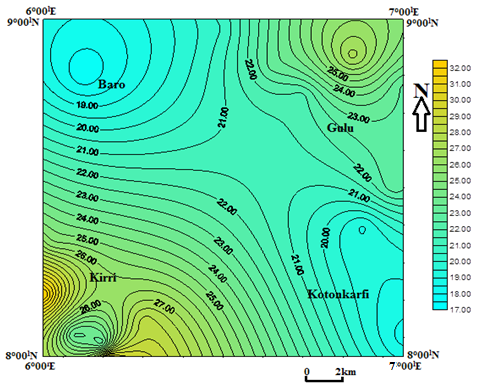
 | Figure 7. Distribution map showing depth-to-the centroid |
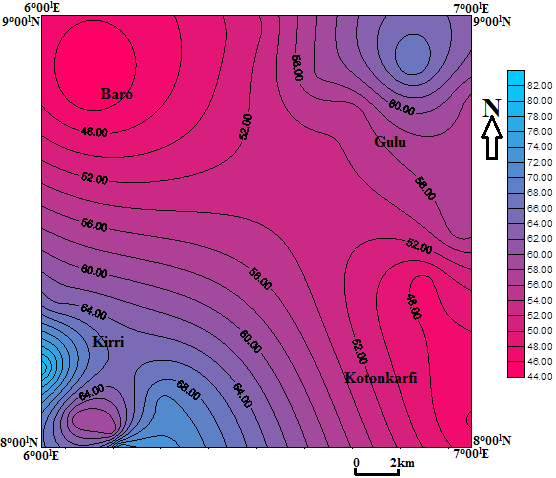
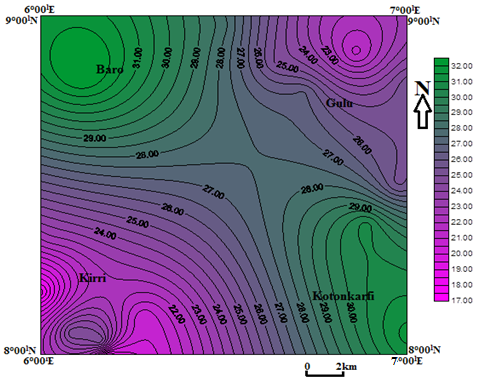 | Figure 8. Distribution map showing Curie point isotherm depth |
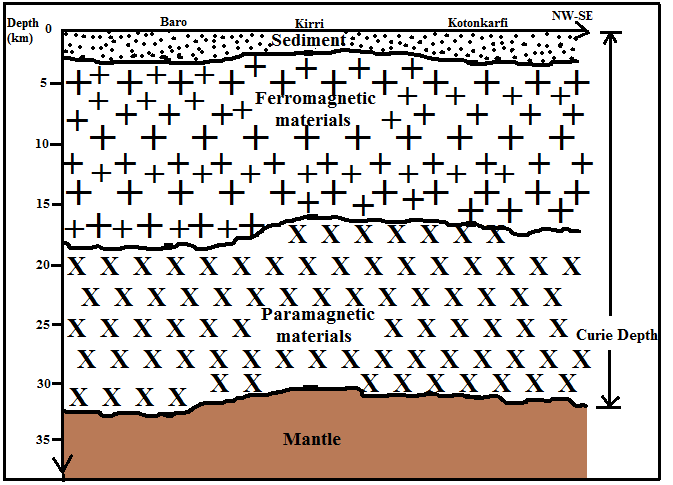 | Figure 9. Geological model of the subsurface in the study area |
 | Figure 10. Distribution Map showing the geothermal gradient in the study area |
 | Figure 11. Distribution map showing the heat flow in the study area |
5. Conclusions
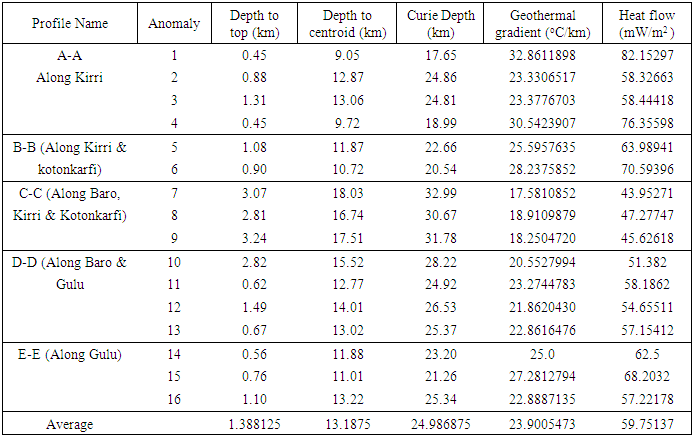
- The Curie point depths for the study area were estimated using spectral analysis of aeromagnetic data. The results show that depth to top of magnetic sources ranges from 0.45 km to 3.24 km with an average of 1.388 km and the depth to centroid ranges from 9.05 km to 18.03 km, with an average value of 13.188 km. The Curie point depth obtained ranges from 17.65 km to 32.99 km, with an average of 24.987 km. The Curie point depths are shallow at Gulu and Kirri areas. These correspond to high values of heat flow in those areas. The average heat flow obtained is 59.751 mW/m2. These obtained thermal properties are good for utilization as alternative source of geothermal energy, especially at Gulu and Kirri areas. Also, this study has contributed to the better understanding of geothermal energy potential in Nigeria.
ACKNOWLEDGEMENTS
- We wish to express our gratitude to the Tertiary Education Trust Fund (TETFUND) for sponsoring this research in the 2014 Research Programme Intervention. Also, we thank the Management of Benue State Polytechnic, Ugbokolo, Nigeria for their adherence and commitment in processing this research for the TETFUND Intervention. We also acknowledged the Nigerian Geological Survey Agency (NGSA) Abuja for making available the digital aeromagnetic data for this work.