Tochukwu Innocent Mgbeojedo1, Latifa Shaheen Al-Naimi2
1Department of Geosciences, Federal University of Technology, Owerri, Nigeria
2Department of Chemistry and Earth Sciences, Qatar University, Doha, Qatar
Correspondence to: Tochukwu Innocent Mgbeojedo, Department of Geosciences, Federal University of Technology, Owerri, Nigeria.
| Email: |  |
Copyright © 2018 The Author(s). Published by Scientific & Academic Publishing.
This work is licensed under the Creative Commons Attribution International License (CC BY).
http://creativecommons.org/licenses/by/4.0/

Abstract
Forty-three water samples were collected from boreholes and shallow hand dug wells, and were analyzed using a combination of titrimetric, colorimetric and atomic absorption spectroscopy (AAS) methods. The study area lies within the Cross River Basin, having a wide variety of climatic conditions, hydrologic regimes and geologic environments. Results of the conductivity values revealed that the groundwater in most part of the study area ranges from fresh, to brackish and finally saline. The range of TDS values across the study area revealed that most of the samples are fresh. The water samples with low TDS values were discovered to occur at relatively higher elevations, while the water samples which are characterized by low and intermediate TDS values occur along topographic lows and flow paths where more water-rock and soil-rock interactions that would increase TDS is expected. Results of the salinity indicated that most of the samples are fresh with salinity values less than 1000 mg/l. Iron, manganese and copper occur in trace amounts. The total concentration of soluble salts in irrigation water in all the samples expressed in terms of specific conductance according to salinity hazard classes were found to be excellent and hence suitable for irrigation purposes.
Keywords:
Cross river basin, Physico-chemical studies, TDS, Salinity hazard, Water samples
Cite this paper: Tochukwu Innocent Mgbeojedo, Latifa Shaheen Al-Naimi, Hydrogeochemical and Physico-chemical Studies of the Groundwater within Afikpo and Abakaliki, South-eastern Nigeria, Geosciences, Vol. 8 No. 2, 2018, pp. 32-43. doi: 10.5923/j.geo.20180802.02.
1. Introduction
Geochemical processes occurring within the groundwater and reactions with aquifer minerals have a profound effect on water quality. Hydrogeochemical composition of groundwater can also be indicative of its origin and history of the passage through underground materials with which water has been in contact with. Groundwater contains dissolved minerals from the soil layers through which it passes. It may also contain some harmful contaminants through the process of seepage from the surface water and biological activities.Groundwater chemistry is largely a function of the mineral composition of the aquifer through which it flows. The hydrochemical processes and hydrogeochemistry of the groundwater vary spatially and temporally, depending on the geology and chemical characteristics of the aquifer. Hydrogeochemical processes such as dissolution, precipitation, ion exchange processes and the residence time along the flow path control the chemical composition of groundwater.The hydrogeochemistry of groundwater in parts of Abakaliki and Afikpo areas was studied in this research. Previous studies reported that the groundwater quality in the area is rapidly deteriorating [4]. This study attempts to evaluate the different water types and hydrogeochemistry of the main source of water supply in the area as well as determine the groundwater characteristics.
1.1. Location and Geology of the Study Area
Ebonyi State is located within southeastern Nigeria and lies on the geographic coordinates: longitudes 7° 00' - 8° 00'E and latitude 5° 50' - 6° 40'N. The state has boundaries in the north with Benue State; on the east with Cross River State, on the south with Abia State and on the west with Enugu State. The study area is divided into two major hydrological provinces, with active flood plains of recent alluvium within the Abakaliki and Ikwo areas.The study area falls within the Cross river basin where serious hydrogeological problems exist. The Cross River is the main river that drains the area; several of its tributaries, Asu River, Ebonyi River in the north, the Ubeyi, and Itara Rivers in the south and their numerous tributaries traverse the area in NE-SE direction.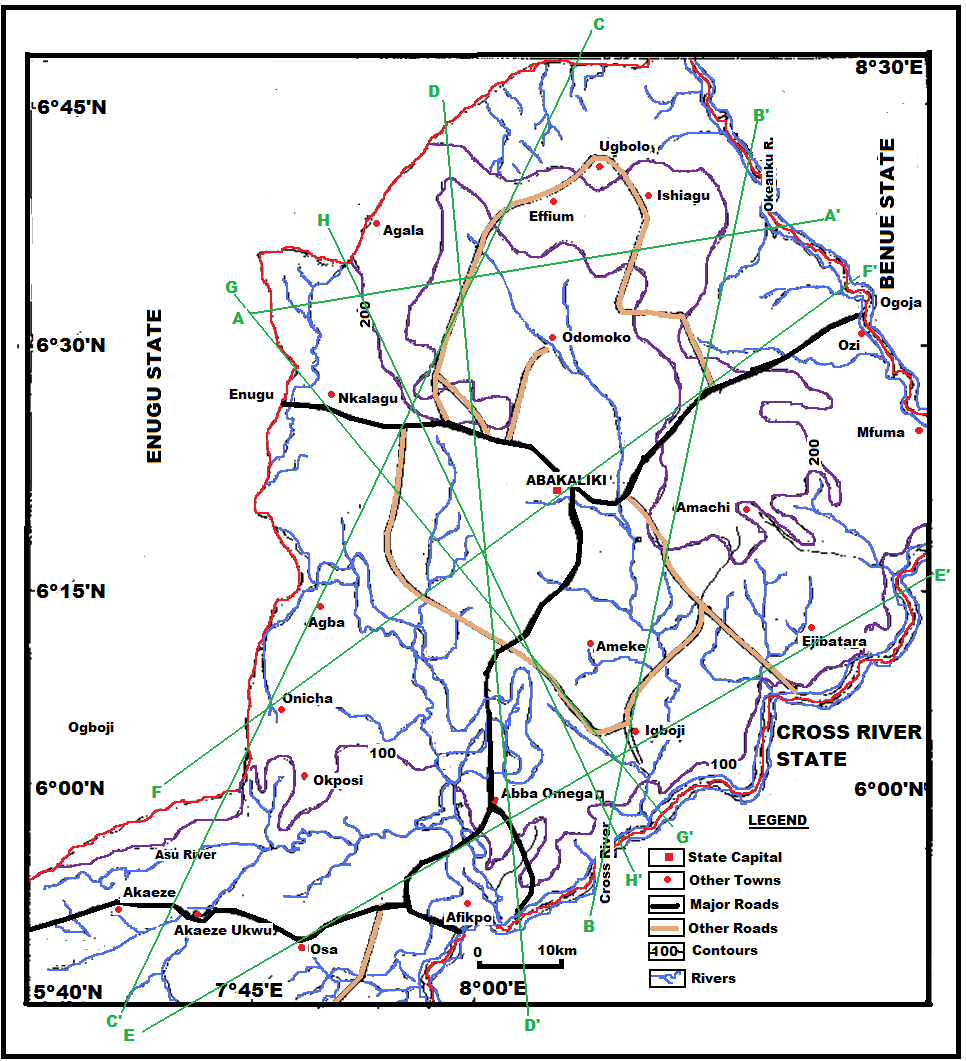 | Figure 1. Topographic map of the study area showing the interpretative cross-sections (profiles) |
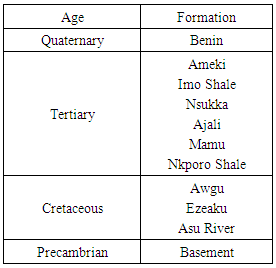
The geology, geomorphology, sedimentology and hydrogeology of the Cross river basin have been extensively studied by several authors [6, 4, 5, 1]. The study area falls within the Lower Benue Basin. The area consists of a succession of rocks leading from Precambrian (basement) through Cretaceous to Tertiary sedimentary beds. A typical sequence is as shown in table 1 below.Table 1. Generalized stratigraphy of the study area
 |
| |
|
More than 90% of the Cross river basin is overlain by Cretaceous rocks of the Asu River, Ezeaku, Awgu, Nkporo and Mamu Formations, with the oldest, the Asu River Formation underlain by the basement complex rocks. With the exception of Awgu and Ezeaku Formations, all these rocks are very poor aquifers.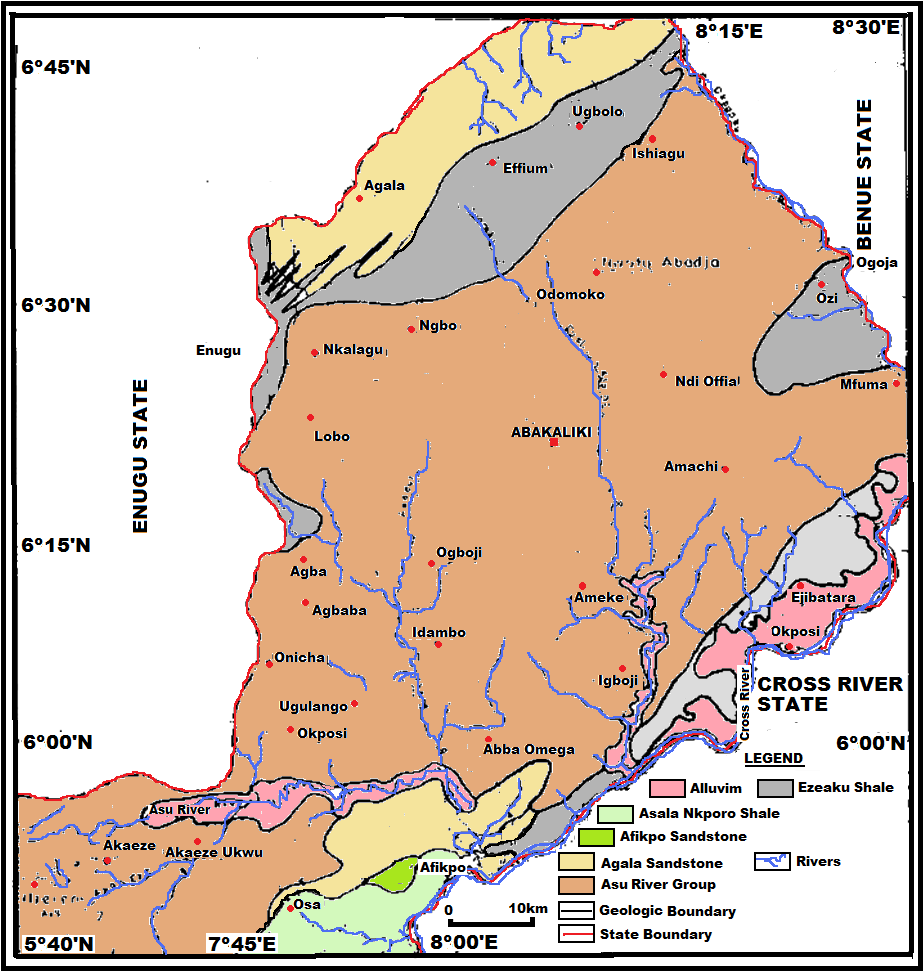 | Figure 2. Regional geology map of the study area (Adapted from NGSA) |
2. Materials and Method
43 boreholes were used for the purpose of the study. The ground water samples were collected near the well head of each of the sampled boreholes before the water went through tanks/treatment units. 1 litre of water was collected from each borehole. Prior to sample collection, the wells were pumped for about three to five minutes. This was to ensure collection of representative samples. Samples were collected in two labeled, well-drained plastic containers tightly corked. The choice of plastic containers is to minimize contamination that could alter the water constituents. The first (1 litre container) was acidified with two drops of concentrated nitric acid (HNO3) for cations determination in order to homogenize and prevent absorption/adsorption of metals to the wall of the plastic container. Acidification equally stops further bacterial growth, inhibits oxidation reactions and leads to precipitation of cations. The second plastic container (1 litre) was used for anion determination. These samples were preserved in cool boxes to keep the temperature below 20°C for eventual transfer to the laboratory for analysis within stipulated period. A Global Positioning System (GPS) unit, portable GARMIN Etrex 76, was used for recording coordinates and elevation readings at borehole points. Because the chemistry of groundwater is sensitive to environmental changes, the following physico-chemical parameters were measured and recorded in-situ: colour, pH, conductivity and temperature. The pH meter was first calibrated using pH buffer 7, pH buffer 4/10 and distilled water. 50ml of the water sample was poured into a beaker and the probe inserted into the water 10 minutes after the meter was switch on and the pH reading was recorded when the reading became stable. The conductivity meter was calibrated using the conductivity solution at 25°C; it was then switched on and inserted into the 50ml water sample. Electrical conductivity value was recorded in  when the reading became stable. Similarly, alkalinity was determined titrimetrically with a standard solution of sulphuric acid (H2SO4). The sample was titrated with the 0.1N H2SO4 using phenolphtalein and methyl orange indicators. 100ml water was measured into a conical flask and 3 drops of phenolphthalein indicator added. When the sample remained colourless, it indicated in all cases that phenolphthalein alkalinity was zero.The groundwater samples were analysed using standard methods prescribed by the American Public Health Association [2]. Sulphate was analysed using the turbidimetric method, which relies on the formation of Barium sulphate in the presence of acidified HCl and Barium chloride. Sodium and potassium concentrations were analysed using a flame photometer based on the flame-emission method. Calcium, magnesium, carbonate, bicarbonate and chloride were determined by chemical titration.
3. Results
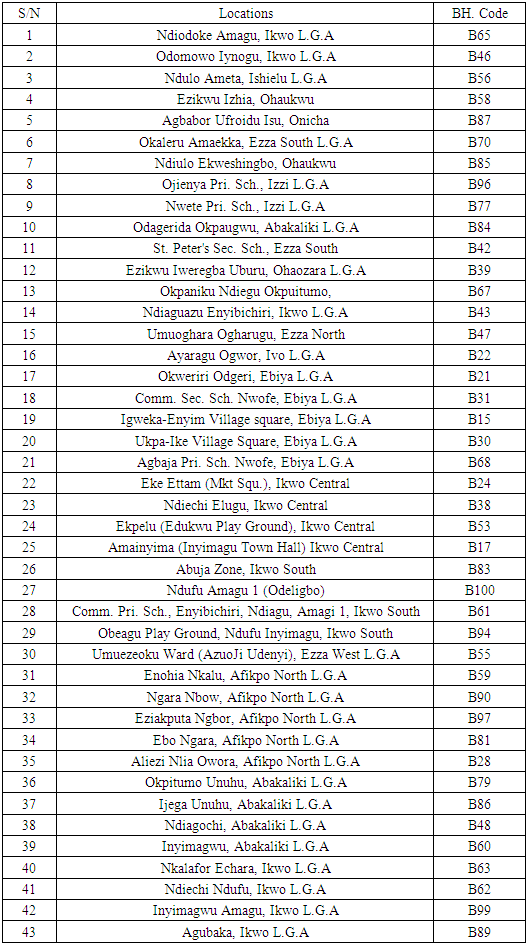
The geochemical analysis was carried out at the following wells in details.Table 2. Locations of the various boreholes studied
 |
| |
|
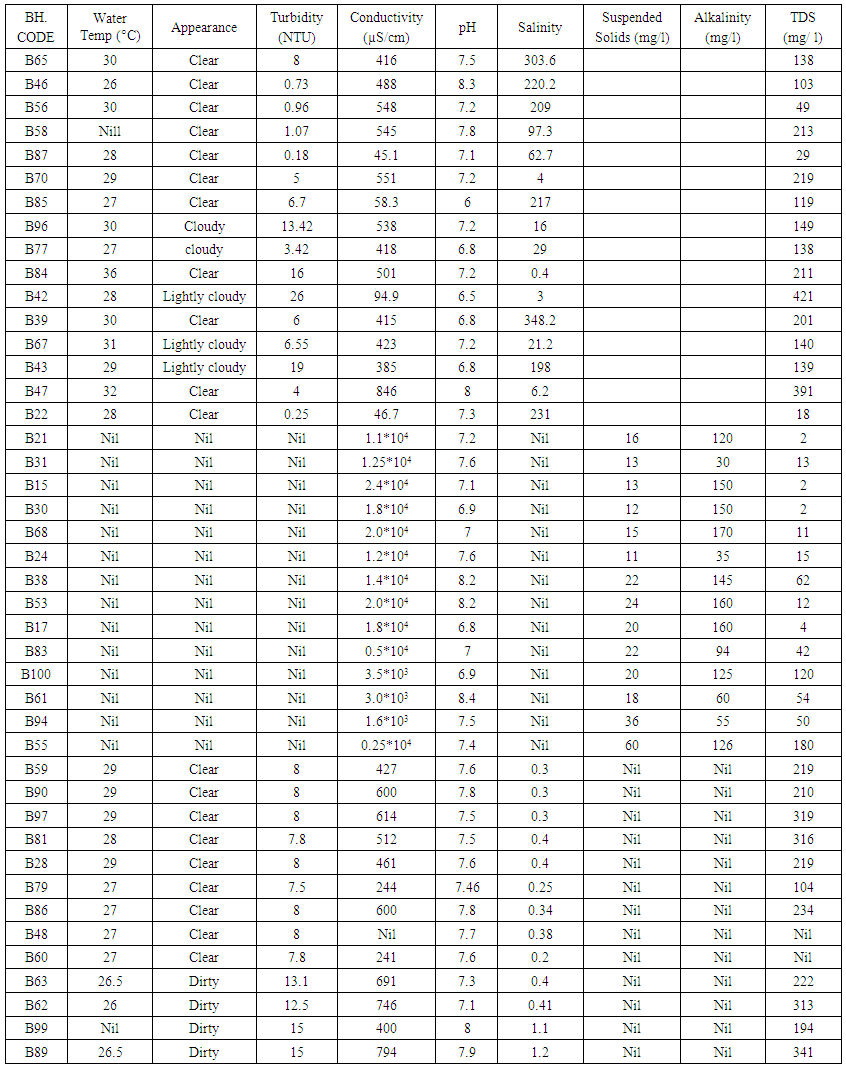 | Table 3. Summary of physico-chemical parameters of aquifers of the study area |
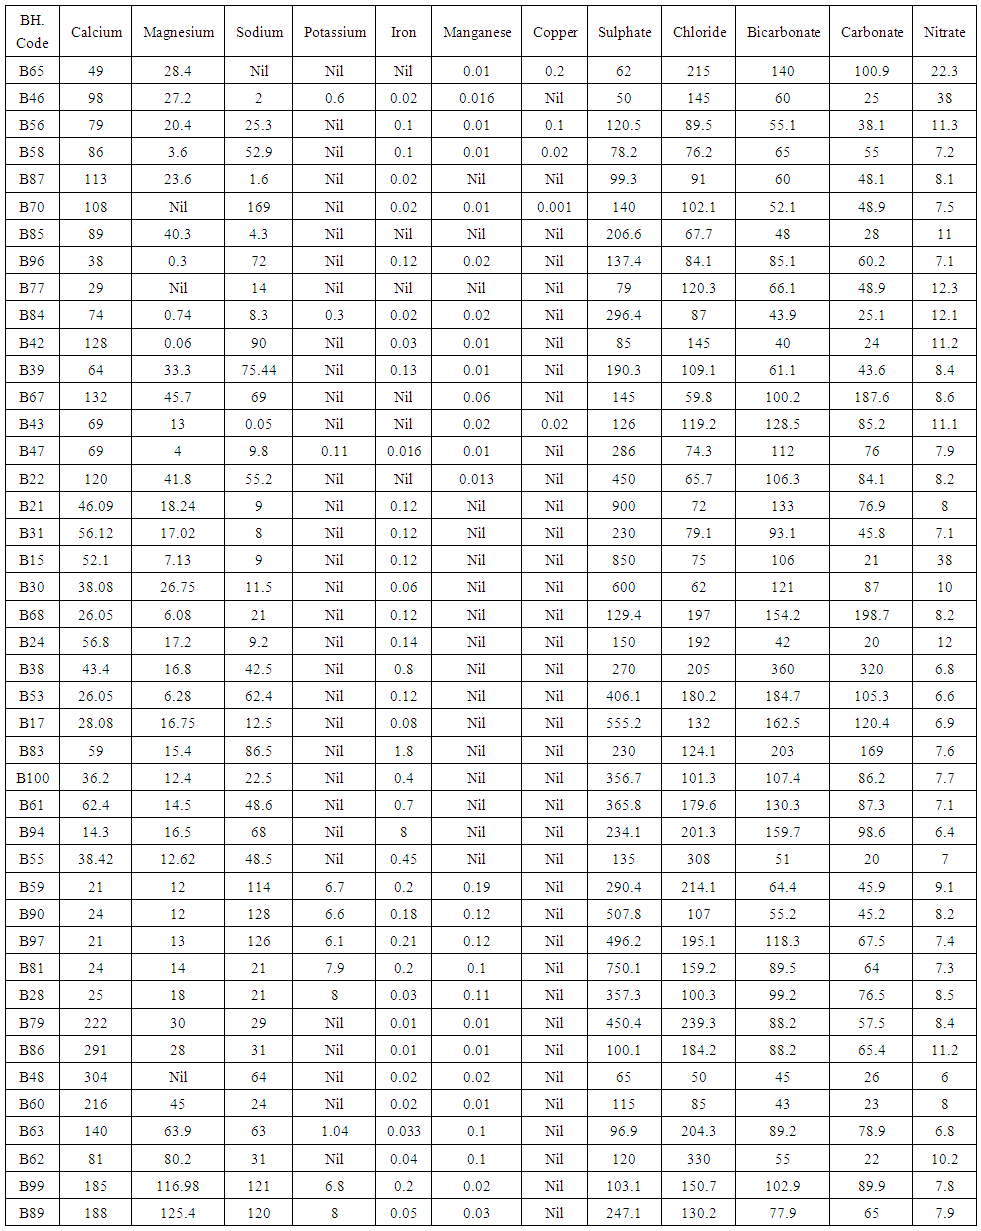 | Table 4. Summary of the results of the geochemical analysis of the study area |
4. Discussion
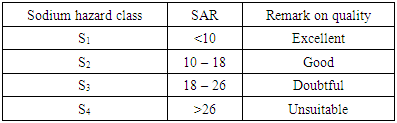
Results of the conductivity values revealed that the groundwater in most part of the study area ranges from fresh, to brackish and finally saline. Groundwater samples from boreholes B65, B46, B56, B58, B87, B70, B85, B96, B77, B84, B42, B39, B67, B43, B47, B59 and B22 were noticed to be fresh whereas other samples are brackish to saline. Borehole water samples with conductivity values with less than 1000µS/cm were noted to be fresh whereas others are brackish to saline. The dissolved-solids concentration is the sum of the major ion constituents for a discrete sample, which includes major cations (dissolved calcium, magnesium, potassium, and sodium), major anions (dissolved carbonate species, chloride, fluoride, and sulfate), and non-ionic silica [8]. The range of TDS values across the study area revealed that most of the samples are fresh. Results of the salinity indicated that most of the samples are fresh with salinity values less than 1000 mg/l. Iron, manganese and copper occur in trace amounts.Sodium absorption ratio of the groundwater samples was determined from borehole groundwater samples from the study area. For determination of the sodium absorption ratio, the following parameters were used: sodium, magnessium, and calcium. The concentrations of these parameters from various groundwater samples in mg/l were converted to their concentrations in milli- equivalent per litre (meq/l). These values in milli-equivalent per litre were finally used to estimate the sodium absorption ratio within the study area. Results of the study revealed that the SAR varies from about 0.00145 at borehole point B43 to as high as 5.33 at borehole point B90 with a regional mean value of 1.41. Sodium hazard classification based on sodium absorption ratio after [13], shows that all the samples falls into sodium hazard class 1 which is classified to be of excellent quality.Table 5. Sodium hazard classes based on sodium adsorption ratio (after Wilcox, 1995)
 |
| |
|
Generally, the chemical composition of groundwater is primarily dependent on the type of chemical reaction as well as the geochemical processes taking place within the groundwater system. Similarly, the mineralogical composition can exert an important control on the final water chemistry. As groundwater flows through the strata of different mineralogical composition, the water composition undergoes adjustments caused by imposition of new mineralogically controlled thermodynamic constraints. Chloride is the most useful parameter for evaluating atmospheric input to water as it shows very little fractionation. Sodium and Chloride inputs are likely to be mainly from rainfall and, therefore, will largely reflect the ratio observed in seawater. Cation exchange may account for a reduction in the Na concentration, and halite dissolution may account for high concentration of Cl. The low concentrations of potassium in natural water are a consequence of its tendency to be fixed by clay minerals and participate in the formation of secondary minerals. Dissolved species and their relations with each other can reveal the origin of solutes and the processes that generated the observed composition of water. The Na/Cl relationship has often been used to identify the mechanism for salinity distribution and saline intrusions. The Na+ and Ca2+ shows a good correlation indicating that Cl- and for the most part, Na+ are probably derived from the dissolution of disseminated halite in fine-grained sediments. The high Na/Cl ratios are probably controlled by water rock interaction. When there is an exchange between Na+ and K+ in groundwater with Mg2+ or Ca2+ in the aquifer material, both of the indices are positive, indicating ion exchange of Na+ in groundwater with Ca2+ or Mg2+. In general, these indices show positive values, whereas the low salt waters give negative values. The increase in groundwater salinity is usually accompanied by a slow rise in reverse ionic exchange, which indicates a cationic exchange that increases the hardness of these waters. The contribution of K+ to the groundwater in these samples is modest. The low levels of potassium in water are a consequence of its tendency to be fixed by clay minerals and to participate in the formation of secondary minerals.Concentration of ions dissolved in groundwater is generally controlled by lithology, groundwater flow rate, natural geochemical reactions and human activities [10, 3]. In fresh groundwater, both HCO3- and CO32- originate mainly from the atmosphere but dissolution of sulfates, dolomite, calcite or silicates minerals also contribute to the concentration of these ions. Excess calcium and magnesium concentration in most water samples is most likely supplied by the dissolution of various minerals such as dolomite, gypsum, calcite, anhydrite or weathering of silicate minerals such as plagioclase, pyroxene, amphibolites and montmorillonite [7]. The water samples with low TDS values were discovered to occur at relatively higher elevations, while the water samples which are characterized by low and intermediate TDS values occur along topographic lows and flowpaths where more water-rock and soil-rock interactions that would increase TDS is expected. This agrees with the findings of [12]. As noted by some researchers, evaporation greatly increases the concentration of ions formed by chemical weathering, leading to higher salinity [9].Finally, the suitability of groundwater for irrigation purposes depends on its mineral constituent [11]. Total salt concentration as measured by electrical conductivity (EC), relative proportion of sodium to other principal cation as expressed by SAR, sodium percent and residual sodium carbonate (RSC) are some of the techniques adopted by the US Salinity Laboratory of the Department of Agriculture [13] in evaluating the suitability of water for irrigation purposes. The total concentration of soluble salts in irrigation water in all the samples expressed in terms of specific conductance according to salinity hazard classes were found to be excellent and hence suitable for irrigation purposes. Piper trilinear plots were drawn along the profiles depicted in Figure 1, to faciliatate an understanding of the water geochemistry hence inferring the various groundwater types. These plots are shown in the following diagrams.Along the A-A1 cross section, the following boreholes were considered: B46, B56, B58 and B65. The Piper diagram revealed that the water class is of Ca- SO4-Cl- which is typical of gypsum ground waters and mine drainages.For B-B1 profile, the following borehole samples were used in plotting the Piper diagram along this cross section: B70, B77, B85, B87 and B96. The Piper diagram along this profile revealed a mainly Ca- Mg-SO4-Cl- water type.Six borehole samples were used for the plot along C-C1 profile. They include B39, B42, B43, B47, B67, and B84. Borehole sample B67 revealed groundwater that is believed to be fresh. However, the Piper diagram along this cross section revealed two water types (hydro-geochemical facies) as shown below: Ca-SO4-Cl- (typical of gypsum groundwaters and mine drainage) and Ca-HCO3- - CO3 (indicating shallow fresh water aquifers). Only one borehole sample (B67) was revealed to be fresh along this cross section.For D-D1 cross-section, boreholes B15, B21, B22, B30, B31 and B66 were used. The Piper plot revealed only one hydrogeochemical facies (water type), the Ca-Mg-SO4- type.The borehole samples used for E-E1 profile include B17, B24, B36, and B53. The Piper diagram revealed a water class of the Ca-Mg-SO4- type.For the F-F1 cross-section, the following samples were used: B100, B55, B59, B61, B83 and B94. The water type revealed by the Piper diagram is indicative of Ca-Mg-SO4- and Na-Cl- water types. The Na-Cl- water type is typical of marine and deep ancient groundwaters. Borehole samples with this water type are very saline.The borehole samples used for the G-G1 profile include the following: B28, B48, B79, B81, B86, B90 and B97. Interpretation of the Piper diagram along this cross-section revealed a combination of two water types: the Ca-Mg-SO4- and Na-Cl- water types.For the H-H1 profile, borehole samples from B60, B62, B63, B89 and B99 were used. Interpretation of the Piper diagram along this profile revealed mainly Ca-Mg-SO4- water type (indicative of gypsum groundwater and mine drainage).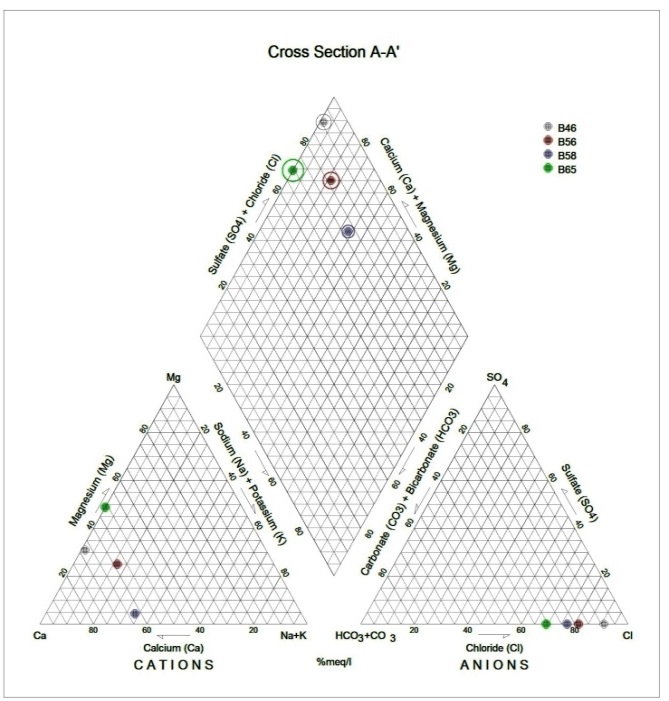 | Figure 3. Piper diagram interpretation along A-A1 profile |
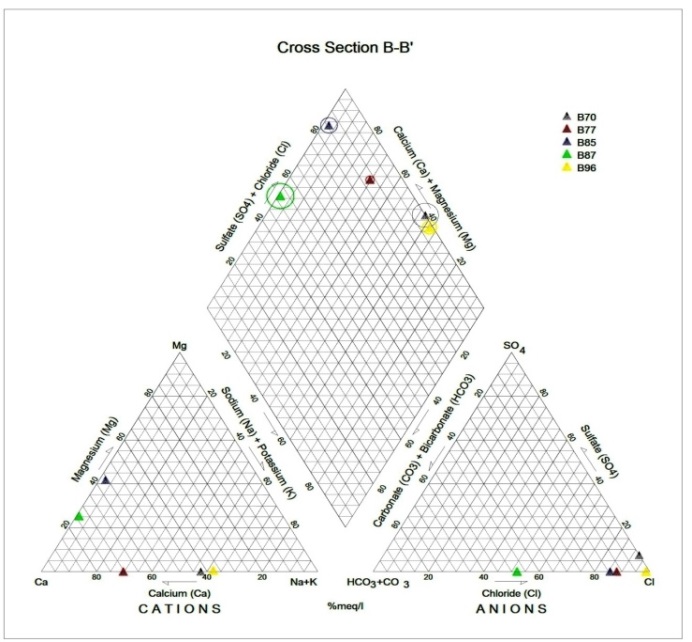 | Figure 4. Piper diagram interpretation along B-B1 profile |
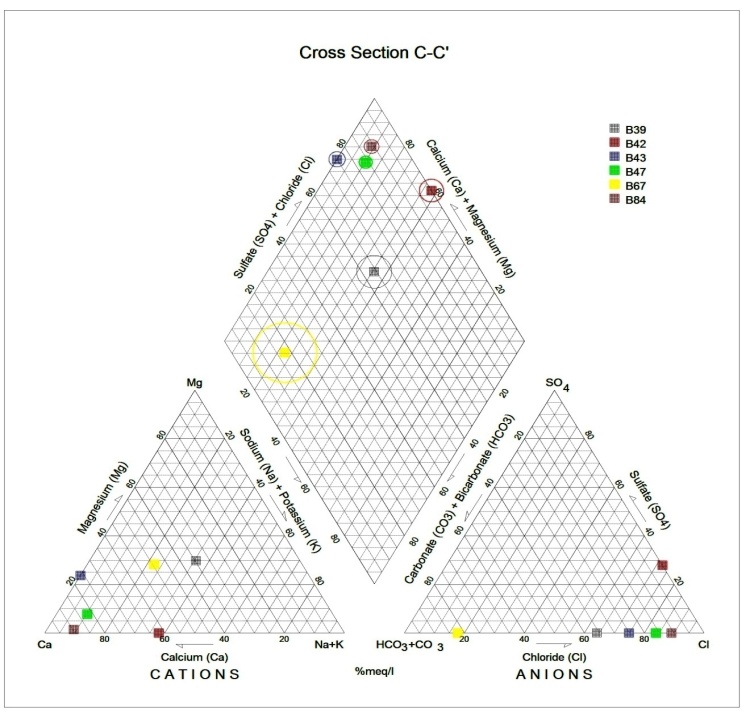 | Figure 5. Piper diagram interpretation along C-C1 profile |
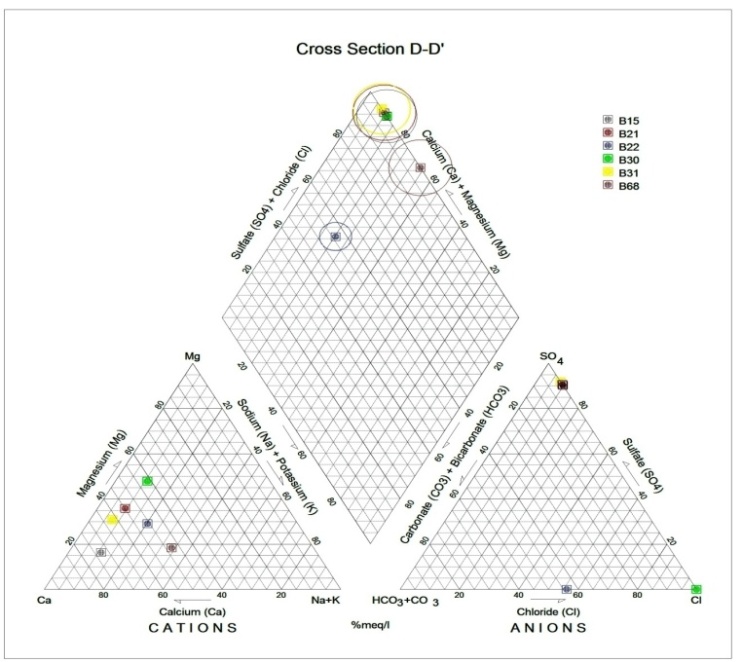 | Figure 6. Piper diagram interpretation along D-D1 profile |
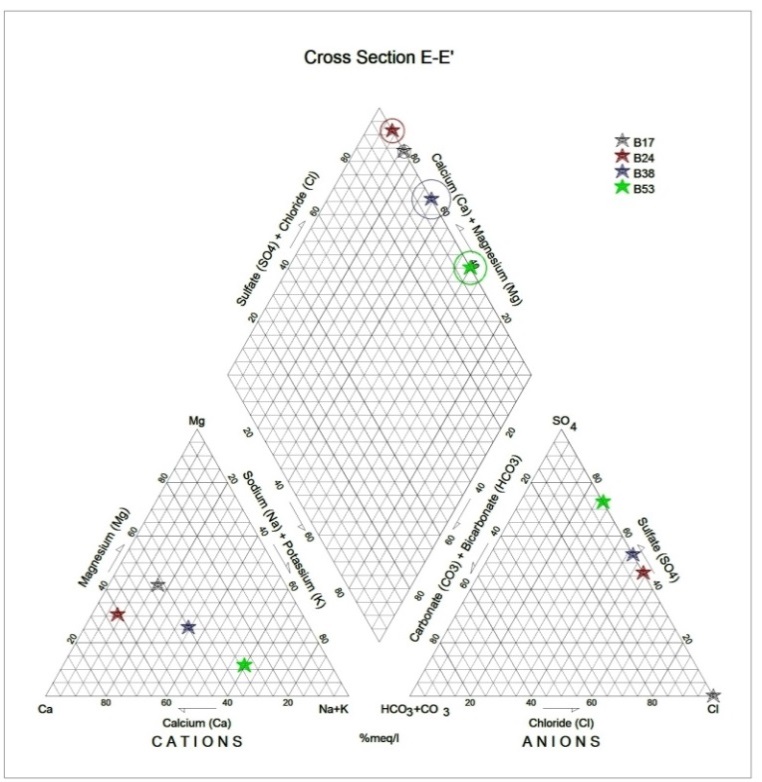 | Figure 7. Piper diagram interpretation along E-E1 profile |
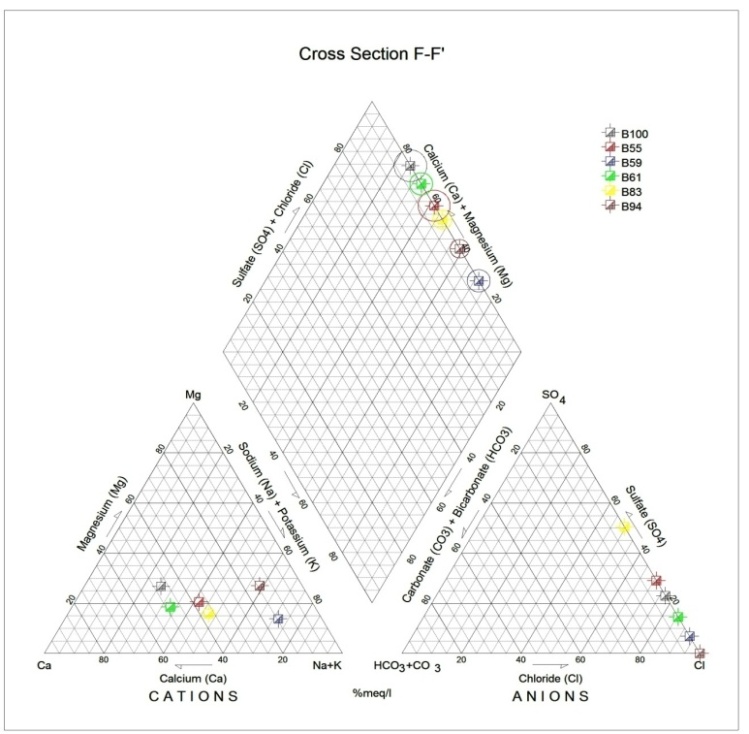 | Figure 8. Piper diagram interpretation along F-F1 profile |
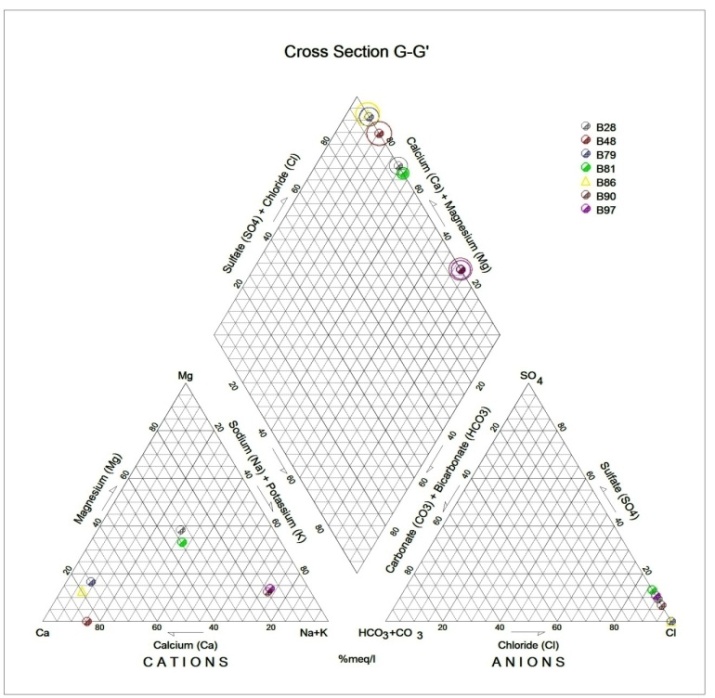 | Figure 9. Piper diagram interpretation along G-G1 profile |
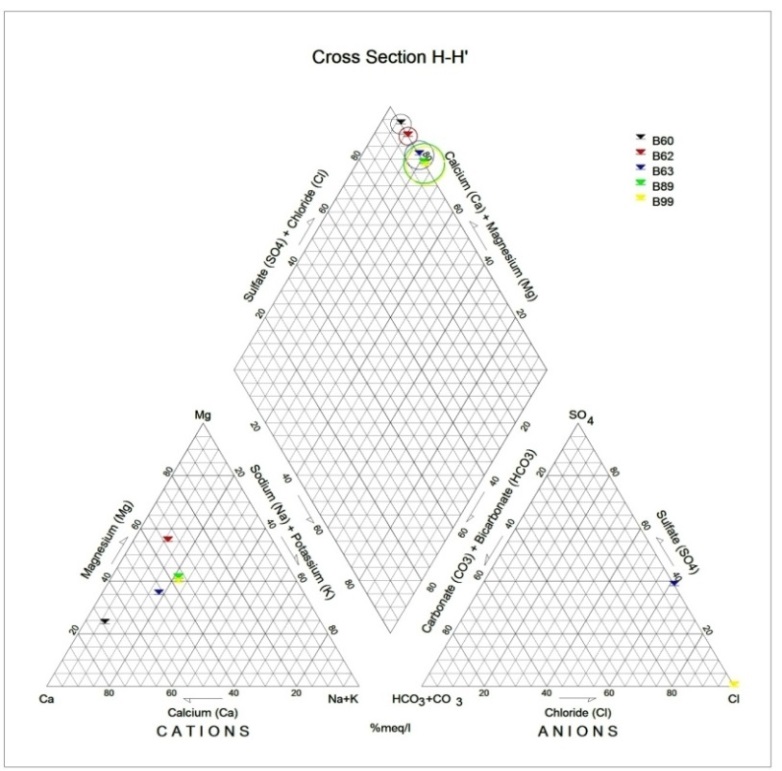 | Figure 10. Piper diagram interpretation along H-H1 profile |
5. Conclusions
The study area revealed a poor to fairly good ground water yield that can sustain rural water supply. The ground water quality is poor to fairly good in most parts of the study area and good in areas without salt bearing minerals, heavy metals and high bicarbonate, such as in some parts of Ikwo (areas along the Cross River) and also parts of Afikpo.
References
| [1] | Amajor, L.C., 1991, Aquifers in the Benin Formation (Miocene Recent), Eastern Niger Delta, Nigeria: lithostratigraphy, hydraulics, and water quality, Environ Geol Water Sci., 17(2), 85-101. |
| [2] | APHA, 1998, Standard methods for the examination of water and wastewater, 19th edition, American Public Health Association, Washington DC, U.S.A. |
| [3] | Bhatt, K.B., and Salakani, S., 1996, Hydrogeochemistry of the upper Ganges River, J. Geol. Soc. India, 48, 171–182. |
| [4] | Edet, A.E., and Okereke C.S., 2002, Delineation of shallow groundwater aquifers in the coastal plain sands of Calabar area (Southern Nigeria) using surface resistivity and hydrogeological data, Journal of African Earth Sciences, 35, 433-443. |
| [5] | Edet, A.E., Okereke, C.S., Teme, S.C., and Esu, E.O., 1998, Application of remote-sensing data to groundwater exploration: a case study of the Cross River State, south-eastern Nigeria, Hydrogeology Journal, 6, 394-404. |
| [6] | Esu, O.E., Okereke, C.S., and Edet, A.E., 1999, A regional hydrostratigraphic study of Akwa Ibom State, Southeastern Nigeria, Global Journal of Pure and Applied Sciences, 5(1), 89-96. |
| [7] | R. A. Freeze and J. A. Cherry, Groundwater, N.J: Prentice-Hall, Englewood Cliffs, 1979. |
| [8] | J.D. Hem, “Study and Interpretation of the Chemical Characteristics of Natural Water”, 3rd Edition, US Geological Survey Water-Supply, University of Virginia, Charlottesville, 1985, paper 2254, p. 263. |
| [9] | Jalali, M., 2005, Major ion chemistry of groundwaters in the Bahar area, Hamadan, western Iran, Environ. Geol., 47, 763-772. |
| [10] | Karanth, K.B., 1997, Groundwater assessment, development and management. McGraw-Hill Publishers, New Delhi. |
| [11] | Sadashivaiah, C., Ramakrishnaiah, C.R., and Ranganna, G., 2008, Hydrochemical Analysis and Evaluation of Groundwater Quality in Tumkur Taluk, Karnataka State, India, International J. Environmental Research and Public Health, 5(3), 158-164. |
| [12] | Thyne, G., Guler, C., and Poeter, E., 2004, Sequential analysis of hydrochemical data for watershed characterization. Groundwater 42(5), 711–723. |
| [13] | L.V. Wilcox, “Classification and use of irrigation waters”, US Department of Agriculture, Washington DC, p. 19, 1995. |

 Abstract
 Reference
 Full-Text PDF
 Full-text HTML