-
Paper Information
- Paper Submission
-
Journal Information
- About This Journal
- Editorial Board
- Current Issue
- Archive
- Author Guidelines
- Contact Us
Geosciences
p-ISSN: 2163-1697 e-ISSN: 2163-1719
2018; 8(2): 21-31
doi:10.5923/j.geo.20180802.01

On the Seismic Hazard in Himachal Pradesh and Uttarakhand States
 Abstract
 Reference
 Full-Text PDF
 Full-text HTML
D. Shanker, Shubham
Indian Institute of Technology Roorkee, Department of Earthquake Engineering, Roorkee, Uttarakhand, India
Correspondence to: D. Shanker, Indian Institute of Technology Roorkee, Department of Earthquake Engineering, Roorkee, Uttarakhand, India.
| Email: |  |
Copyright © 2018 The Author(s). Published by Scientific & Academic Publishing.
This work is licensed under the Creative Commons Attribution International License (CC BY).
http://creativecommons.org/licenses/by/4.0/

Seismic hazard analysis involves the quantitative estimation of ground shaking at a particular site or for a particular region. In the present study Deterministic Seismic Hazard Analysis (DSHA) has been carried out for the states of Himachal Pradesh & Uttarakhand. The study region is one of the most seismically active regions of western part of Himalaya, India and there are numerous major seismic faults present in this region. Eighty-nine seismo-tectonic sources in and around Himachal Pradesh & Uttarakhand were identified. Using an appropriate attenuation model the peak horizontal accelerations, peak vertical accelerations and ratios of peak vertical to horizontal accelerations were computed. For this purpose the study region was divided into grids of 0.5° by 0.5°. The estimated peak horizontal accelerations vary from 0.02g to 0.60g and peak vertical accelerations vary from 0.01g to 0.47g. The ratios of horizontal to vertical accelerations vary from 3.60 to 1.28. This variation seems to be more realistic because it takes into account the effect of large number of tectonic features that may rupture causing earthquakes. The PGA contour maps prepared for the region show that larger Peak Ground Accelerations are present in the region where there is a higher density of larger faults and vice versa.
Keywords: Deterministic Seismic Hazard Analysis (DSHA), Peak horizontal accelerations, Peak vertical accelerations
Cite this paper: D. Shanker, Shubham, On the Seismic Hazard in Himachal Pradesh and Uttarakhand States, Geosciences, Vol. 8 No. 2, 2018, pp. 21-31. doi: 10.5923/j.geo.20180802.01.
Article Outline
1. Introduction
- Destructive effects of earthquakes is becoming alarming day by day because of growth in population, the rapid rate of industrialization, the large scale engineering activities and their impact on the environment, which now call for increased efforts to minimize resulting seismic hazards. The human population and the extent of built- up areas (cities etc.) are directly related, and, at present, both are increasing in a big way. Also the effects of ground motion (vibrations) on various structures as well as on human beings have become a great concern for the society. It is felt that an assessment of seismic hazards is fundamentally a predictive effort where attempts are made to forecast the earthquake effects in a region in terms of ground motion (shanking). Therefore, somehow or other, the seismic hazard assessment is analogous to the long-term earthquake prediction. In a real sense, it is a challenge to before the geoscientific community to improve the quantification of earthquake hazards for societal benefits. The local geological and soil conditions can profoundly influence all of the characteristics – amplitude, frequency content, and duration – of strong ground motion. Significant earthquake damage and loss of life has been directly related to the effect of local site condition in several recent earthquakes (eg., 1985 Mexico earthquake, 1989 Loma Prieta Earthquake, 1994 Northridge, 1995 Kobe Earthquake, and Bhuj earthquake 2001) which effects play an important role in earthquake resistant design [3]. local site condition related damage are very essential component of a comprehensive assessment of seismic hazard and are attributed to geotechnical / geophysical characteristics of soil overburden closure to the ground. There is a clear role for geological and geotechnical data in evaluating the ground motions and in turn in the study of seismic hazard.
2. Characteristics of Study Region
- The considered region falls within 29°N - 33°N latitude and 75°E - 81°E longitude and is located in Himalayan range (Fig. 1). This region comes under the Zone IV (severe) and Zone V (very severe) of the seismic zoning map of India (IS: 1893-2002) with damage intensity of VIII and IX, respectively [8]. It is seismically a very active region and cascades in the zone of continental collision of the Indian and Eurasian plates [5]. The seismic activity of this area is closely associated with the several active faults running nearby and the dynamic regional tectonic features. The region is in the lap of Himalayas, and the Himalayan orogeny resulted in the formation of a large number of major faults in this region. Seismotectonics of the region is related to the regional tectonic features like thrusts and faults, their interactions and clustering of epicentres at places. Thus, the frequent seismic activities observed in this region are due to ruptures at these thrust faults formed by the subduction of the Indian plate below the slow moving Eurasian plate [5]. Some of these prominent faults are the Main Frontal Thrust (MFT) [11, 12] the north-west-south-east trending Main Boundary Thrust (MBT) and Main Central Thrust (MCT) running parallel to Himalayas and other local transverse faults across the area. A highly devastating earthquake of magnitude 7.8 on the Richter scale occurred in 1905 within the study area. Despite the seismicity, the increase in the population in the high seismicity regions of this state has led to increase in the seismic vulnerability. For the present study, deterministic seismic hazard assessment have been carried out.
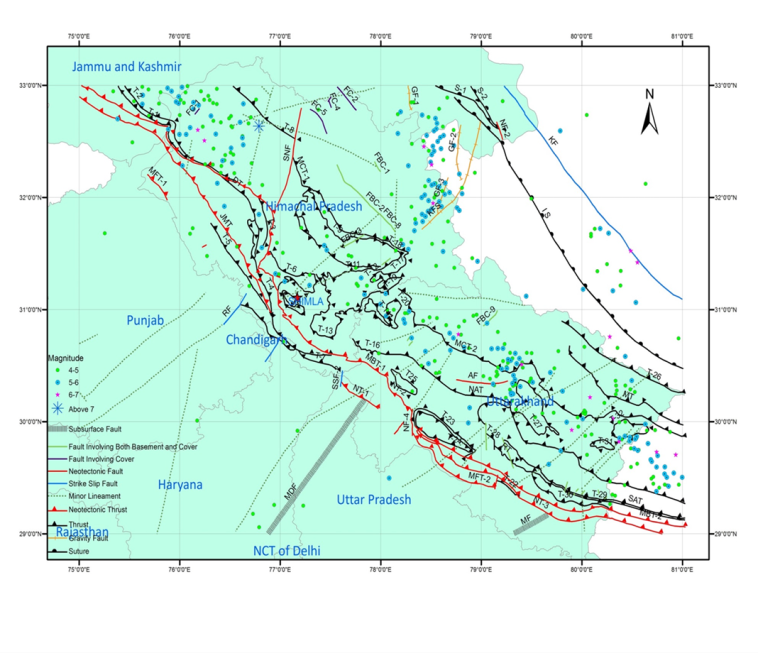 | Figure 1. Seismotectonic map of the considered region (after [7]) in the study region |
3. Method of Analyses
3.1. Deterministic Seismic Hazard Assessment of the Study Region
3.1.1. Identification of Seismotectonic Sources
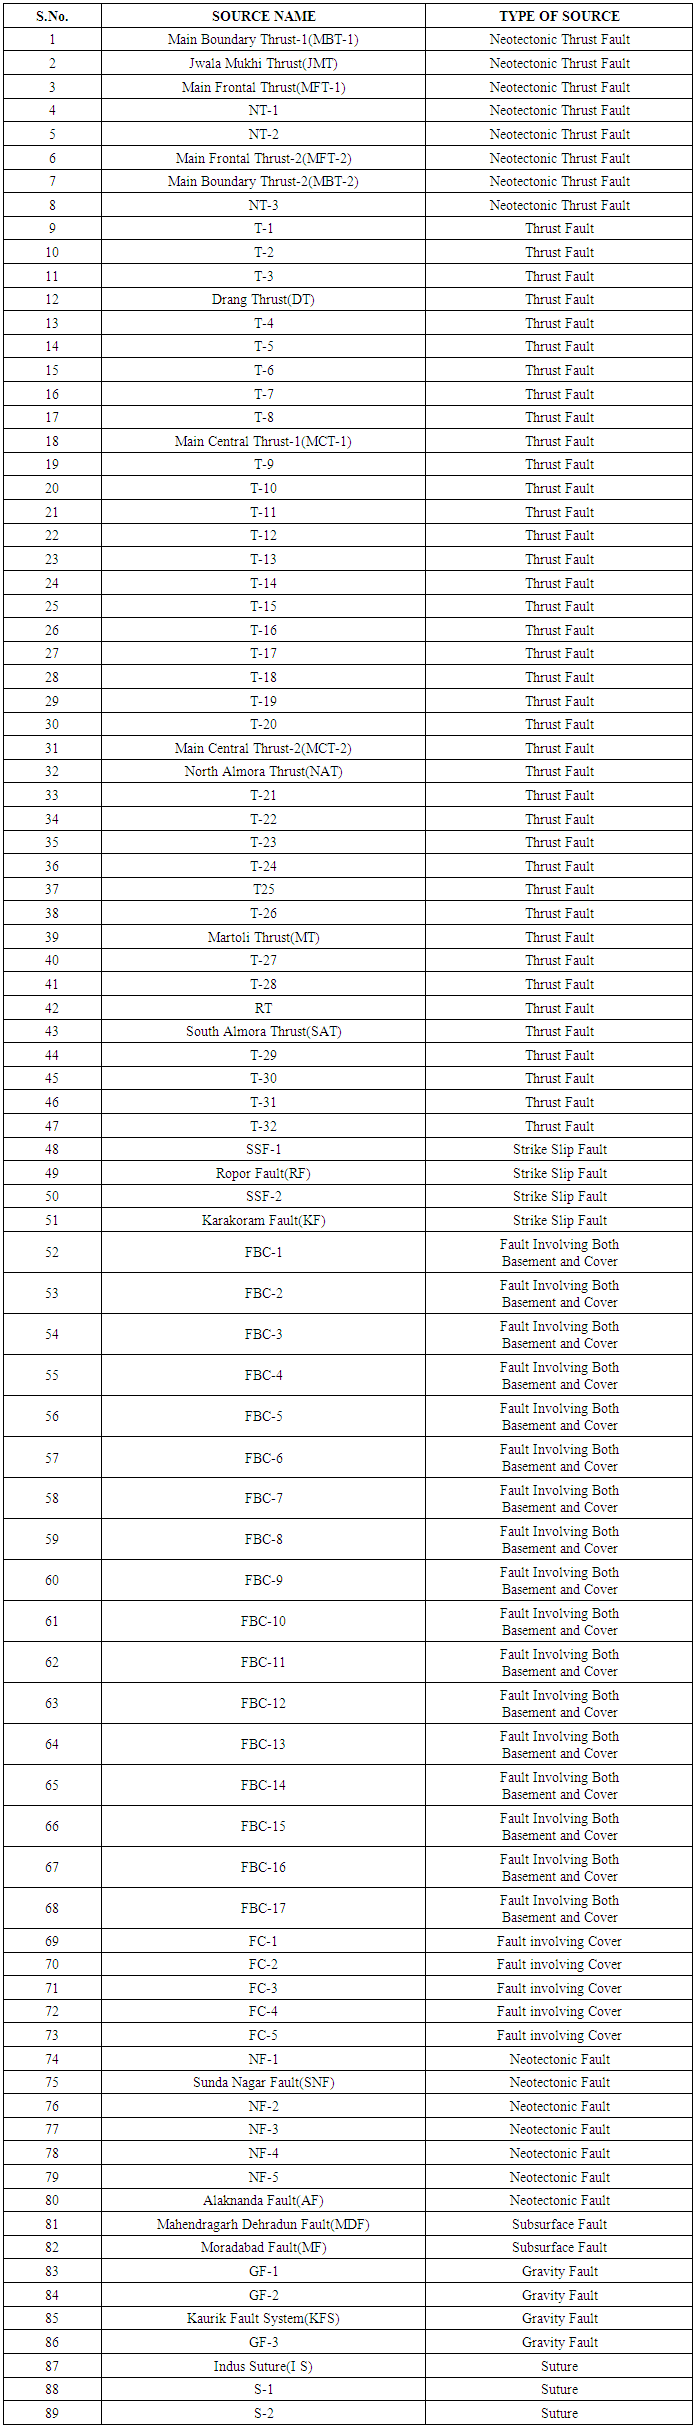
- Based on regional seismicity and tectonic setting of the region under study, Eighty nine seismotectonic sources have been identified which are linear in character. These sources are listed in Table 1 and plotted using Arc GIS 10.1.
|
3.1.2. Estimation of Maximum Magnitude of Sources and Depth or Energy Release
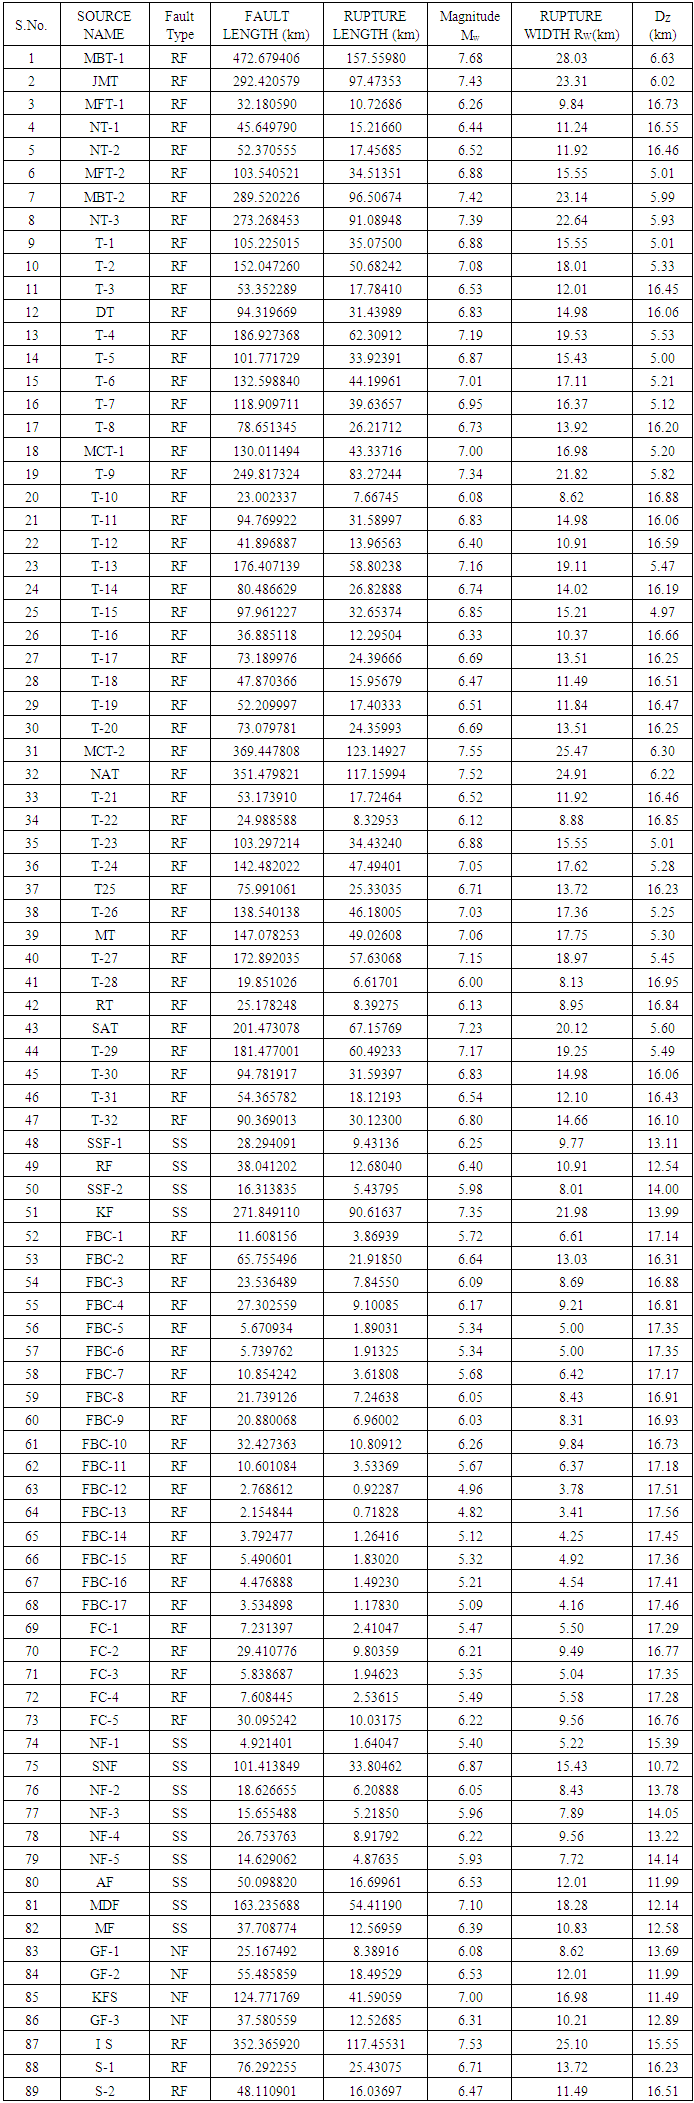
- There are two methods of calculating expected magnitude or assigning maximum magnitude to any fault.a) Based on past seismicity: This method uses observed maximum magnitude in a seismic zone from the earthquake catalogue. This is not an efficient method because there are some of the fault which do not have any significant earthquake present on them, which is responsible for ground motion. This doesn't mean that they cannot trigger any future earthquakes.b) Based on dimensions of rupture: In this method the concept of fault rupture length has been utilized. Worldwide earthquake studies have shown that faults do not rupture over the entire lengths or areas during individual event.Adopting the general assumption based on world wide data that 1/3 to 1/2 of the total length of fault would rupture producing the maximum earthquake and using the following relationships between the surface rupture length (L) and earthquake magnitude for reverse, strike slip, and normal faults, the moment magnitude (MW) for each seismotectonic source has been computed [13].MW = 5.16 + 1.12logL (Strike Slip Fault)MW = 5.00 + 1.22logL (Reverse Fault)MW = 4.86 + 1.32logL (Normal Fault)Adopting the above relationships, the maximum magnitude and rupture width, for various seismotectonic sources have been computed and are listed in Table 2.
|
3.1.3. Computational Steps
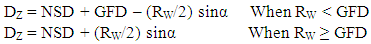
- Computations of the maximum horizontal ground acceleration and maximum vertical ground acceleration at a given point have been carried out using four softwares, namely Arc Info GIS 10.1, Arc View GIS 10.1, MS Excel and Surfer 13. The steps involved in the computation of maximum horizontal acceleration and vertical acceleration are briefly described below:× All the tectonic features and earthquake epicenters lying between latitude 29° N to 33° N and longitude 75° E to 81° E were identified and digitized in Arc View GIS 10.1. For this SEISAT 5 & 6 from Seismotectonic Atlas of India [7] were scanned and seismotectonic maps were prepared. Using these digitized seismotectonic maps a composite seismotectonic map was prepared indicating seismic sources in terms of faults, lineaments and other geological structures. For computing maximum magnitude of various sources their lengths were estimated.× The study area lies within latitude 29° N to 33° N and longitude 75° E to 81° E. The area was divided into small grids, each grid having a dimension of 0.5° latitude by 0.5° longitude. Center of each grid is taken as a site for the purpose of calculating ground motion parameter.× For each site following calculations were made:Ÿ The closest distance to all seismic sources (faults) were computed using Arc Info GIS 10.1Ÿ These closest distances were combined with the vertical distances showing the depth of energy release to compute the distance to the zone of energy release. Using these distances to the zone of energy release and maximum magnitudes assigned to various seismotectonic sources, the peak horizontal ground accelerations and vertical accelerations for the sites were computed adopting the prescribed attenuation relationship.Ÿ The highest of those acceleration values was taken to represent the acceleration at the site under consideration.The above steps were repeated for all the grid points and the highest acceleration value at the center of each grid was taken for preparing contour maps showing the variation of PGA. The contour map was prepared using Surfer 13.Knowing the Mw, the rupture width (RW) for each source is calculated using following relationship [13]Log (RW) = -1.01 + 0.32MWFor calculating the depth of energy release (DZ) General Focal Depth (GFD) of 15 km has been taken because the reported focal depths of moderate earthquakes in this region generally fall in range of 10 km to 20 km, and non seismogenic depth (NSD) is taken as 3 km [6]. The dip angle (α) is taken as 15° for thrust type seismotectonic sources, and 90° for normal and strike slip type sources. The depth of energy release (DZ) has been computed using the following relationship:
 The distance to the zone of energy release (De) is estimated using the depth to the zone of energy release (Dz) and the epicentral distance (Ep) as:De = (Ep2 + Dz2)0.5The attenuation relationship developed by [1] has been used to compute both peak horizontal acceleration (ah) and peak vertical acceleration (av)
4. Computational Results
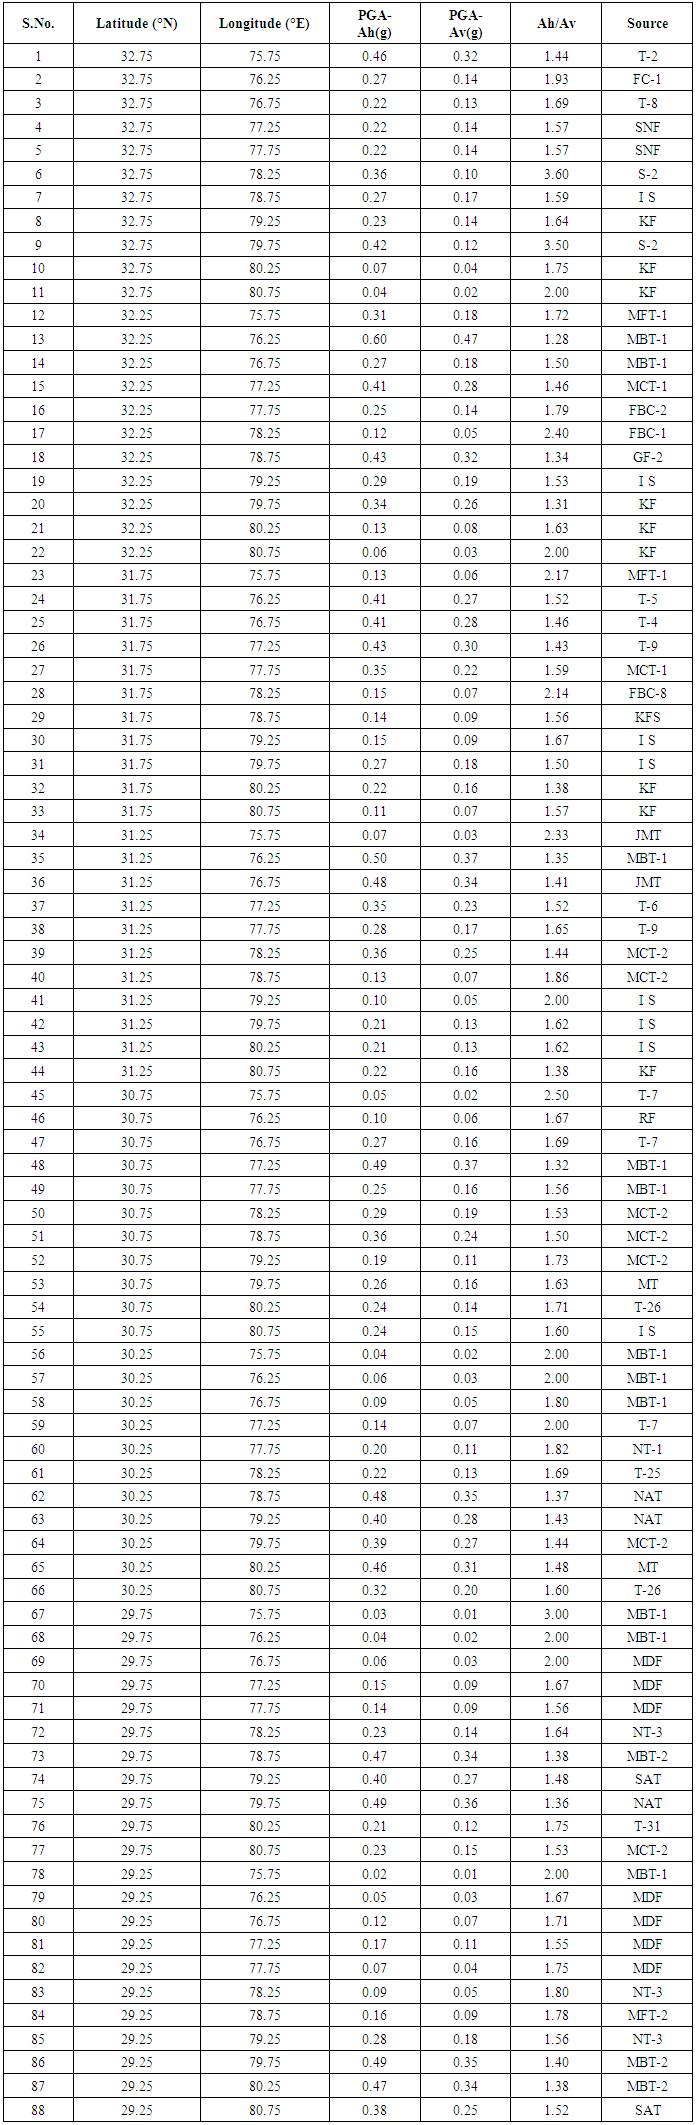
- For conducting Deterministic Seismic Hazard Assessment eighty nine potential seismic line sources were delineated based on the major tectonic features mapped in the study area and observed seismicity patterns. The area was divided into small grids, each grid having a dimension of 0.5° latitude by 0.5° longitude. Center of each grid is taken as a site for the purpose of calculating ground motion parameter. The attenuation relationship developed by [1] has been used to compute both peak horizontal acceleration (ah) and peak vertical acceleration (av). The expected ratios of peak vertical to peak horizontal accelerations (av/ah) have also been computed. The maximum value of peak horizontal and vertical accelerations computed at the center of each grid point, along with the ratio av/ah and the source that has made maximum contribution is listed in Table 3.
|
5. Discussion and Conclusions
- The most extensively used and studied parameter of strong ground motion earthquake records is peak ground acceleration, specially its horizontal component. At the distance beyond which surface waves appear, the vertical component is generally smaller and its frequency is higher compared to horizontal components. The pair of orthogonal horizontal component records (NS-EW) will be randomly oriented with respect to the direction of the progress of the waves and will usually possess comparable amplitudes. The component in the direction of wave propagation is generally larger. Experienced showed that on an average the peak ground acceleration is not so much affected by geology in comparison to the peak horizontal velocity and displacement. The velocity and displacement are found to be larger on soft rock sites. The peak ground acceleration is assocated with higher frequencies on hard rock sites compared to soft rock sites. Also the velocity and displacements are more sensitive to changes in the value of modules of elasticity. The presence of shallow soft soil layers will amplify the low frequency components (Horizontal) and attenuate high frequency components (vertical). The effect is more pronounced away from the epicenter but will be within 25-30% [2]. It has been also observed that peak ground acceleration is expected to be 15-25% higher for reverse faults compared to strike-slip faults [2]. Additionally, azimuth of the site with respect to the strike of the fault is important. In general at comparable distances the peak horizontal acceleration may be higher in the direction of about 600 to the strike of the fault [2].The contour maps showing the variation of peak horizontal accelerations (ah) and peak vertical accelerations (av) are shown in Figures 2 and 3. The present, study region, Himachal Pradesh (HP), and Uttarakhand, is a northern state in India situated in the western part of the seismically active Himalayan region. This region has experienced several major earthquakes in the past, namely, the Kangra earthquake (Mw 7.8, 1905) with its epicenter in the Kangra region, which resulted in extensive damages to infrastructure and human life. [10] have reported seismic hazard in terms of return periods and probability of earthquake occurrences. Hence, this article presents an estimate estimated of peak horizontal accelerations varying from 0.02g to 0.60g (Figure 1) and peak vertical accelerations vary from 0.01g to 0.47g (Figure 3). The ratios of horizontal to vertical accelerations vary from 3.60 to 1.28 (Figure 4). These estimates would be very helpful for future preparedness planning and even construction practices in the considered area The PGA contour maps prepared for the region show that larger Peak Ground Accelerations are present in the region where there is a higher density of larger faults and vice versa.[4] Developed a probabilistic seismic hazard map of India and adjoining regions. Eighty six potential seismic source zones were delineated from the earthquake data and major tectonic features, and PGA were computed for 10% exceedence in 50 years in a grid of 0.5° by 0.5°. The values for Himachal Pradesh and Uttarakhand vary from 0.05g to 0.35g. These values are less than those obtained in the present study. The hazard map prepared by [4] is based on large sized source zones and uses different attenuation relationship and thus reflect the broader framework and the values of accelerations may not be representative on local and regional scale as they have not considered the local and regional tectonic features.
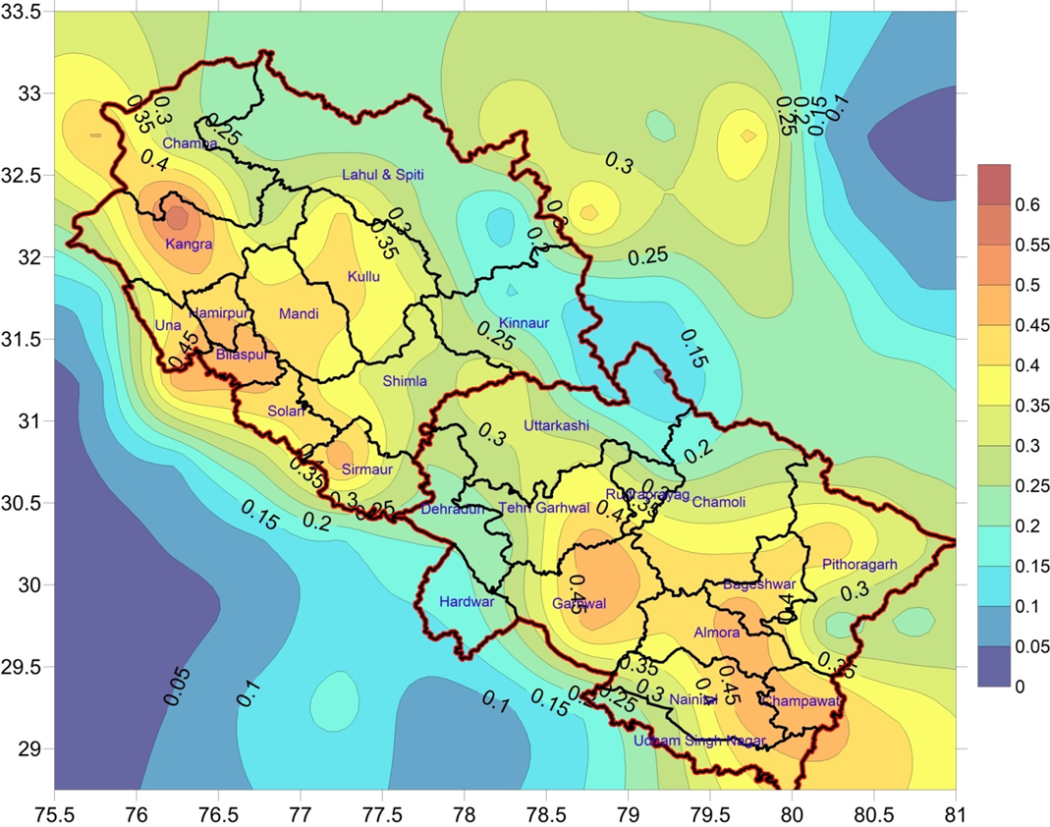 | Figure 2. Contour map showing variation of peak horizontal accelerations in the study region |
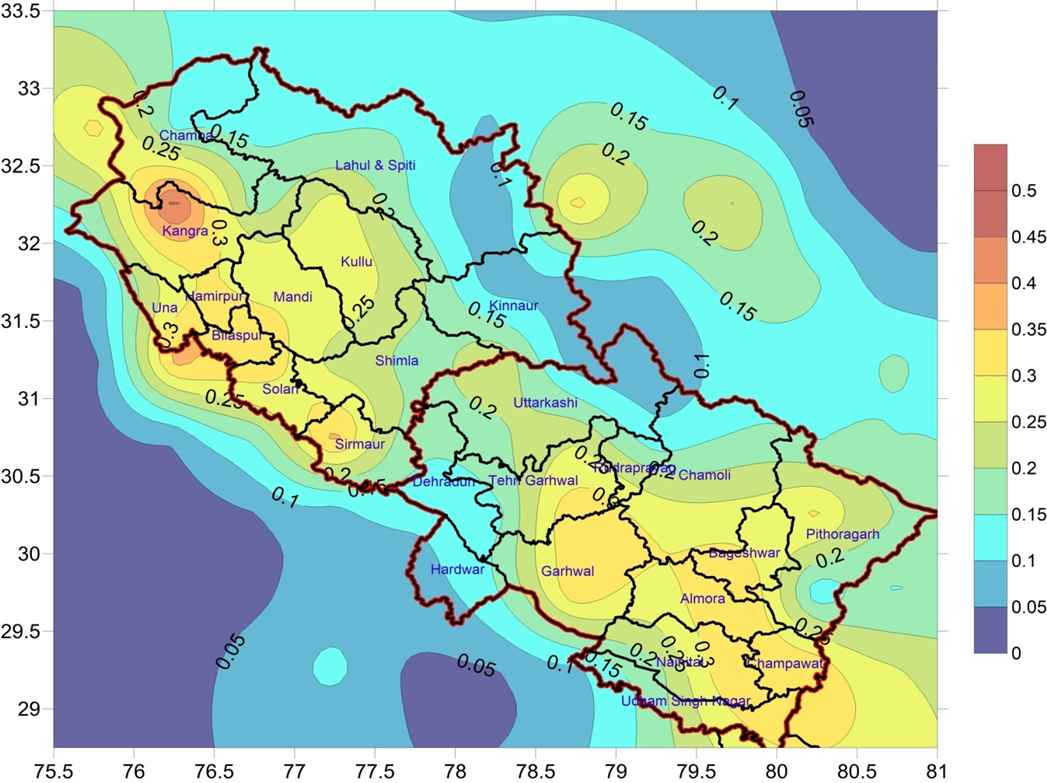 | Figure 3. Contour map showing variation of peak horizontal accelerations in the study region |
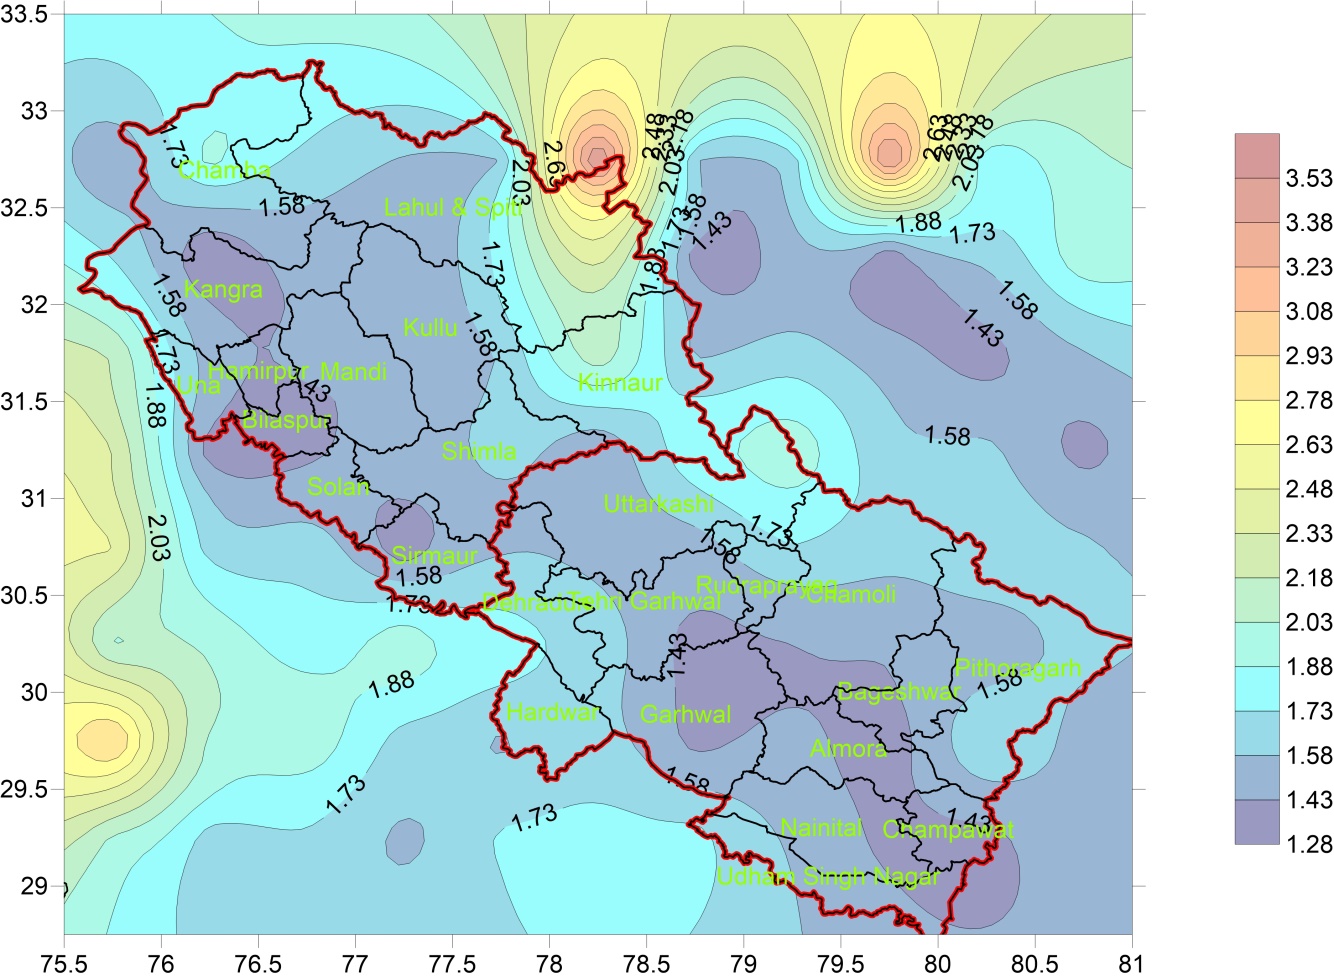 | Figure 4. Contour map showing variation of ratio of Horizontal to vertical accelerations in the study region |
ACKNOWLEDGEMENTS
- The results presented here is the part of the Master Thesis. Authors are indebted to Department of Earthquake Engineering, IIT Roorkee, Roorkee for providing excellent computational facilities to carry out this research work. Views expressed in this paper are that of authors only, and may not necessarily be of the institute.