-
Paper Information
- Paper Submission
-
Journal Information
- About This Journal
- Editorial Board
- Current Issue
- Archive
- Author Guidelines
- Contact Us
Geosciences
p-ISSN: 2163-1697 e-ISSN: 2163-1719
2018; 8(1): 7-13
doi:10.5923/j.geo.20180801.02

Effects of Diversified Land Use/Cover Types on Rainfall-runoff Generation in a Rural Catchment in Uganda
 Abstract
 Reference
 Full-Text PDF
 Full-text HTML
Barasa Bernard1, Kakembo Vincent2, Mugagga Frank3
1Department of Geography and Social Studies, Kyambogo University, Kyambogo, Kampala, Uganda
2Department of Geosciences, Nelson Mandela University, Port Elizabeth, South Africa
3Department of Geography, GeoInformatics and Climatic Sciences, Makerere University, Kampala, Uganda
Correspondence to: Barasa Bernard, Department of Geography and Social Studies, Kyambogo University, Kyambogo, Kampala, Uganda.
| Email: |  |
Copyright © 2018 The Author(s). Published by Scientific & Academic Publishing.
This work is licensed under the Creative Commons Attribution International License (CC BY).
http://creativecommons.org/licenses/by/4.0/

Patches of land use/cover types determine the amount and rate of rainfall runoff produced. This study investigated the susceptibility of disturbed and undisturbed soils to rainfall-runoff generation and volume from diverse land use/cover types. Comparative in-situ soil infiltration experiments were performed, while the curve number based model was adopted to estimate runoff volume. The results show that the diversified land use/cover types had a significant effect on the content of nitrogen, sand, phosphorus and organic matter (P<0.05) than on the percentage of clay and silt parameters in the cultivatable soil layer. The anthropogenically disturbed forest patches and agricultural land use (cotton and beans) types had relatively higher rates of soil infiltration (>40 mm/hr.) compared to the rates in rice and woodland. In principle, the subsistence agricultural land use is statistically qualified as the primary contributor of rainfall-runoff generation followed by disturbed forest patches and scattered bushlands in the catchment. This was demonstrated by the moderately lower rates of saturated hydraulic conductivity in the agricultural land use types which later translated into an increase in the catchment streamflow. In addition, the curve-number model also posted higher rainfall runoff volume (71,740 m3) above average generated from agricultural land use types followed by bushlands (42,872 m3) from any given single rainfall storm in the studied tropical rural catchment.
Keywords: Land use/cover types, Rainfall-runoff, Infiltration, Malaba, Curve-Number
Cite this paper: Barasa Bernard, Kakembo Vincent, Mugagga Frank, Effects of Diversified Land Use/Cover Types on Rainfall-runoff Generation in a Rural Catchment in Uganda, Geosciences, Vol. 8 No. 1, 2018, pp. 7-13. doi: 10.5923/j.geo.20180801.02.
Article Outline
1. Introduction
- Land use/cover change may affect the regional and local scale water resources Huisman et al. [1]; Turyahabwe et al. [2] by influencing changes in rainfall-runoff components and the climate Hernandez et al. [3]; Kim et al. [4]. This change is driven by the intense human utilization of land resources Bronstert et al., [5]; Barasa et al. [6] to provide food, fibre, water, and shelter to more than six billion people worldwide Foley et al. [7]. This results in an increase in the magnitude of rainfall-runoff volume and peak discharge Fox et al. [8]. The effects of land use/cover change on hydrological responses are more prominent in the tropical regions, and their contribution is substantially larger than that of climate change. These changes have increased the global runoff by 0.08 mm/year2, and accounts for ≈50 percent of the reconstructed global runoff trend over the last century Piao et al. [9]. Therefore, investigating the effect of land use/cover types on the soil susceptibility to rainfall-runoff generation and volume is a prerequisite to understanding hydrological responses in a catchment Niehoff [10]; Pfister [11]. This is because hydrological responses are dependent on the surface and soil physio-chemical properties Kirkby et al. [12] such as antecedent soil moisture Nutchanart and Wisuwat [13], organic matter, soil texture, macro-pores, roots or micro-topography channelling water movement Hundecha and Bárdossy [14]. Little is known so far if there is a well-defined quantitative relationship between the land use/cover types and rainfall-runoff generation at a catchment scale Samaniego and Bardossy [15]; Wei et al. [16]. Much as quantifying this relationship using soil infiltration experiments are limited in the tropical region Giertz and Diekkrüger [17]. This study bridges this information because it is important to gain an understanding of what these specific effects are. Therefore, the present study sought to establish the characteristics of the soil under different land use/cover types and their effect on the surface rainfall-runoff generation that later translates into streamflow in the catchment. It is against this background that this study critically examined the effect of land use and cover on soil properties and their implications for the rainfall-runoff generation and volume in the Malaba River catchment.
2. Materials and Methods
2.1. Description of the Malaba River Catchment
- The catchment of Malaba River lies in the continuously humid non-tropical – cyclone sub-region in terms of rainfall. This sub-region is found within a relatively narrow band at 3°N – 5°S latitude. The catchment is transboundary in nature because it is shared between Uganda and Kenya (Figure 1). The river originates from the slopes of Mount Elgon and drains into Lake Kyoga, which is located in the central and mid-northern part of Uganda (Figure 1). Seventy percent of the downstream and midstream sections are located in the eastern region of Uganda (618159.6N, 64877.5E), while the remaining portion (the upstream section) is situated in western Kenya (666168.4N, 79848.4E) zone 36N. The extent of the catchment is 2,232 km2. Mt. Elgon is also the main source of Lwakhakha, and Malakisi rivers. These tributaries discharge into Lake Kyoga at an elevation of 950 meters above sea level. The minor tributaries include Rivers Solo, Aturukuku, and Okame. The catchment experiences a bimodal rainfall pattern with an average annual rainfall of 1,514 mm/year.
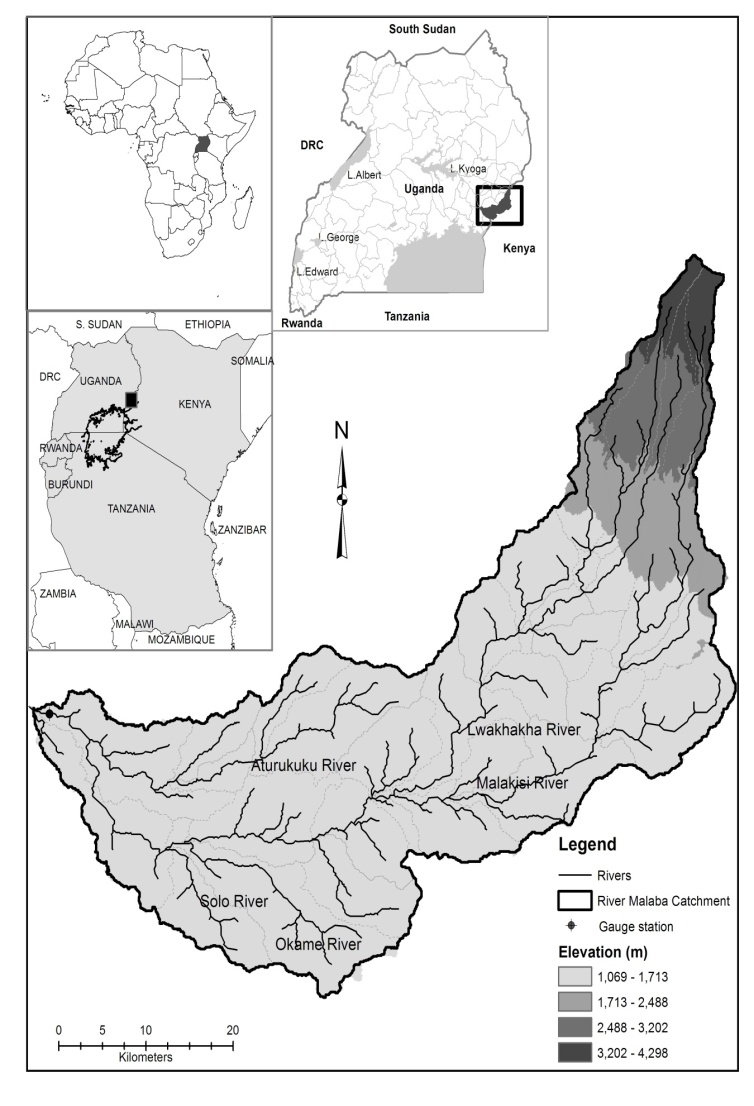 | Figure 1. Study area |
2.2. Study Approach
- Soil sampling was carried out from the Petric plinthosol, and Gleysol soil types to determine the effect of land use/cover change on the soil properties susceptibility to rainfall-runoff generation. This was assessed through soil sampling and use of soil infiltration experiments. The two soil groups had a diversity of land use/ cover options, which meant that they were more prone to both natural and human disturbances. The curve number model was applied in this study to estimate the rainfall runoff volume because of its comprehensive inclusiveness of components that influence land use and cover components in the catchment.
2.3. Susceptibility of the Soil to Runoff
2.3.1. Soil Characteristics
- The study laid out field plots (50 x 50m) that were measured 100m away from the river channel where soil composites were randomly sampled from the representative land use and cover types (agriculture, tropical forest, regenerating forest, bushlands, tree plantation, and wetland) following a zigzag method. Soil sampling was carried out at two soil depths i.e. 0-15cm and 15-30cm. The collected soil samples were analysed in the laboratory following Okalebo et al. [19] laboratory methods for soil analysis. A one-way analysis of variance (ANOVA) was performed on the analysed samples to test if land use/cover types and soil depth had an effect on the soil properties (P<0.05).
2.3.2. Soil Infiltration
- A series of double ring soil infiltration experiments were conducted from representative land use/cover types situated from the prominent hill slopes to the valleys. These experiments were adopted because water infiltration is an important component of the catchment water balance. The double ring technique was chosen because it minimized the slacking effect and the effect of lateral water flow Bamutaze [20]. The infiltration rate was assessed by observing the decreasing water level inside the inner ring. Water in the outer ring was kept at approximately the same level as in the inner ring to prevent lateral flow and promote vertical water movement in the soil Moroke et al. [21]. The experiments were conducted on the representative land use/cover types, that were situated between the two soil catena groups (Petric plinthosols and Gleysols). Under the Petric plinthosol soil type, the agricultural land use comprising of cassava, maize, cotton, sorghum and a land cover comprising of forest, bushlands, and tree plantation were sampled. From the Gleysols - rice, bushlands and woodland land use/cover types were sampled. The collected soil samples were analysed in the laboratory for saturated hydraulic conductivity using the constant head method. The soil hydraulic conductivity rates were defined and classified in accordance with the United States Department of Agriculture [22] rating scheme.
2.4. Estimation of Runoff Volume
- The U.S. Soil Conservation Service, [23] curve number model was adopted by this study to estimate rainfall-runoff volume. The model accounts for the factors that affected runoff, such as soil type, land use, surface and antecedent moisture condition Xiao [24]. The runoff equation was expressed as:
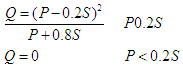 Where Q is a direct runoff (1000/C)-10 in inches, P is storm rainfall, and S is potential maximum retention or infiltration. Equation (1), S is expressed in the form of a dimensionless runoff curve number (CN):
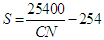 in mm, SI units.Where, CN represents the runoff (mm) potential of the land cover soil-complex governed by soil property, cover type and the hydrologic condition of the soil surface. The runoff volume was determined when the area was multiplied by runoff depth.The allocated curve number values for the different land use and cover types were as follows; Gleysols had a CN range from 0 to 1, while those under the Petric plinthosols ranged from 73 to 79. However, the highest curve number values were allocated to the degraded forest and built up areas (Figure 2).
 | Figure 2. Curve number ranges |
3. Results
3.1. Effect of Land Use/Cover Types on the Soil Properties
3.1.1. Soil Characteristics
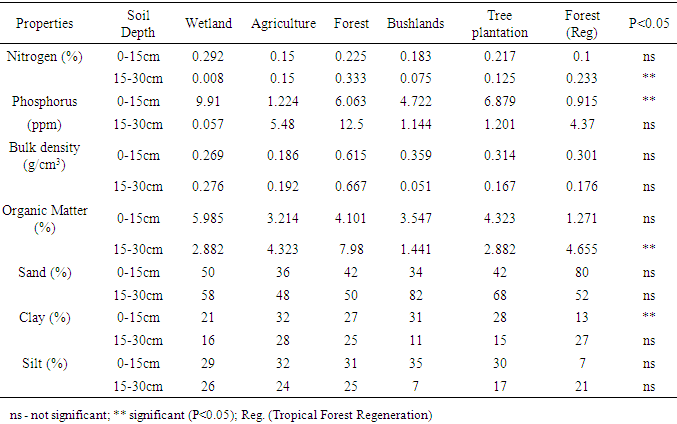
- The soil physiochemical properties for the representative land use/cover types are summarized in Table 1. The effects of land use/cover change varied with soil depth and the representative land use and cover types. From the sampled land use /cover types, the most affected soil properties were the clay fraction and phosphorus at the 0-15 cm soil layer (P<0.05); while nitrogen and organic matter content at the 10-30 cm soil layer (Table 1).
|
3.1.2. Susceptibility of the Soil to Runoff Generation
- Soil texture can show the behaviour of soils in terms of their chemical and physical properties. The percentage of sand varied across the sampled representative land use/cover types with soil depth. The percentage of sand was relatively higher in the subsoil layer than for silt and clay. In regard to the soil particle size instability, the fractions of silt and sand showed that they were more susceptible to detachment in the rainfall-runoff generation than the clay fractions.
3.1.3. Soil Infiltration
- Figure 3 shows the rates of measured soil infiltration from the sampled representative land use/cover types. The rates of soil infiltration varied across the sampled representative land use/ cover types, and soil catena groups. The observed rates of soil infiltration were relatively higher in the Petric plinthosol soil type than in the Gleysols. The tropical forest land cover, cotton and beans land use types showed higher rates of soil infiltration than the observations made under the rice and woodland land use/cover options. Generally, the observed rates of soil infiltration were higher in the agricultural land uses than from the sampled land cover types in the catchment.
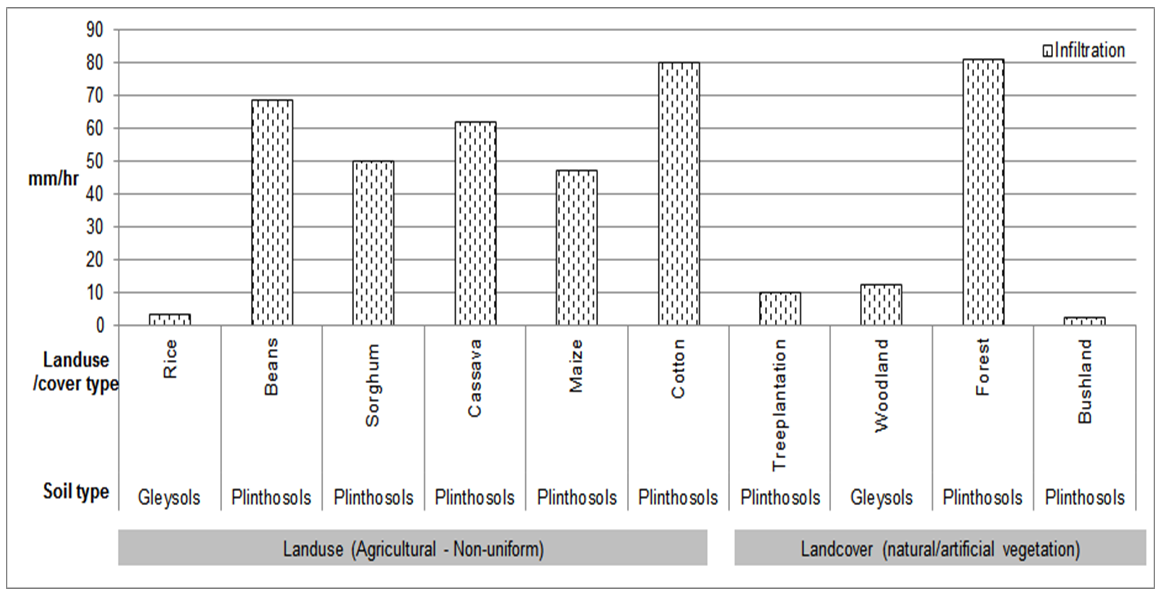 | Figure 3. Rates of soil infiltration from the sampled land use and cover options |
3.1.4. Soil Hydraulic Conductivity
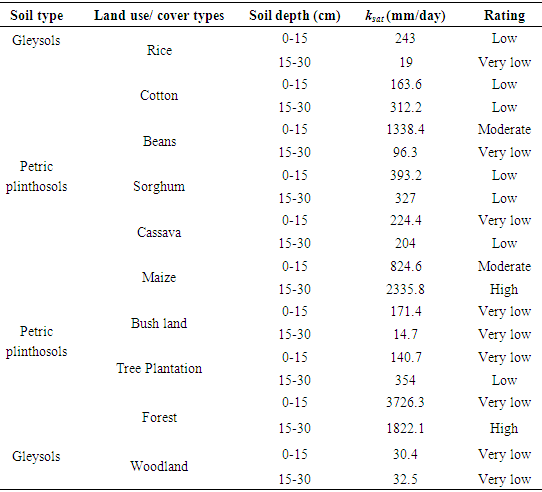
- The soil hydraulic conductivity (ksat) plays a critical part in the runoff generation process because it controls the lateral flow of rainfall in the soil profiles. The agricultural land use types (beans and maize) had moderate rates of soil conductivity in the topsoil layer compared to the land cover types (forest, bushlands and thickets, woodland). However, the Gleysols had a lower saturated hydraulic conductivity than the Petric plinthosol soil type. The low rates of ksat in the agricultural land use types (crop growing), showed a characteristic of Petric plinthosol type (Table 2). The one-way ANOVA procedure was implemented to test the significance of land use and depth on the ksat. The results indicated that the effect of land use/cover types were more significant (P<0.01) on ksat, than in relation to the soil depth (P>0.65).
|
3.1.5. Estimation of Runoff Volume
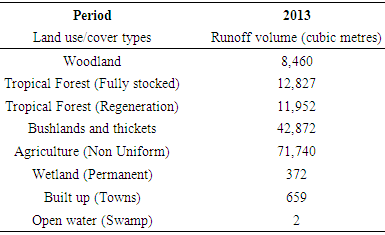
- The SCS CN model estimated that the highest rainfall-runoff volume was generated from the agricultural land use followed by bushlands and thickets land cover types (Table 3). The high rate of runoff volume could be attributed to the high rate of natural land cover conversion to crop growing. This is accompanied by poor farming practices such as bush burning, selective depletion of forest cover for charcoal burning and firewood extraction among others. The predicted model results also showed a strong correlation between the CN values and the depth of rainfall storms events experienced in the catchment.
|
4. Discussion
- This study revealed that the sampled representative land use/cover types in the catchment had a moderate effect on the soil properties and rainfall-runoff generation. Thus, the land uses/cover options under the Gleysols contributed a significant amount of runoff that ended up as streamflow. However, this impact greatly depended on the amount of precipitation received in the catchment. This finding was also observed by Niehoff et al. [10] who argued that the influence of land-use conditions on storm-runoff generation depends greatly on the rainfall event characteristics and on the related spatial scale. The impact was more significant from the agricultural land use (crop growing) than from the land cover options. The cultivated areas (beans, maize, sorghum, and cassava) were more susceptible to generate intermediate amounts of rainfall-runoff, especially under an average rainfall higher than 1,000 mm per year. The continuous cultivation practices without external inputs and encroachment on the marginal areas for more fertile land increased the susceptibility of the soil to runoff through the exposure of the soil to the rainfall-runoff agents. Rockstrom [25] also found out that the practices exist because over 95 percent of the land used for food production is based on rain-fed agriculture and it’s prone to rainfall-runoff in Eastern Africa. The poor cultivation practices were also responsible for the low availability of organic matter content in the soil. This effect was also noted by Lal [26] that soils with low levels of organic matter content, and those containing predominantly low-activity clays are more susceptible to rainfall-runoff generation. This was also observed by Borbor-Cordova et al. [27] and Barasa et al. [28] who noted that the agricultural land management practices in the tropical catchments have more direct effects on the content of nitrogen, phosphorous, hydraulic conductivity and organic matter. However, the content of soil organic matter in the Malaba catchment was above the 3.0 percent critical value Okalebo et al. [19], except for the tropical forest regeneration, where the content of organic matter was noted to be below the critical value - a phenomenon, which was attributed to charcoal burning activities. The implications for the rainfall-runoff generation were ought to be reflected in the increased rates of streamflow.This study also shows that it is possible to estimate the rainfall-runoff generation using soil infiltration experiments and curve number method. It is also important to note that the generation of overland flow can be distinguished through saturation excess overland flow and the infiltration excess overland flow. The variation in soil texture explains the possibilities of this saturation excess. The infiltration excess was evident in the Gleysol soil type that showed a higher groundwater level. The filtration results of this study demonstrated a characteristic of loamy sand soils, which were often above 25 mm/hr. (Figure 3). This is also in agreement with the findings of Jansson [29] who noted that soil filtration is a function of soil texture; and the loamy soils normally have a percolation rate of approximately 25.4 – 50.8 mm/h.The observed rates of soil infiltration were higher in the agricultural land use (crop growing) than from the sampled land cover types in the catchment. This is also in regard to the findings of Giertz and Diekkrüger [17] who reported higher rates of overland flow from the agricultural land use (crop growing) in the tropical regions. However, the high rate of soil infiltration observed in the forest land cover was attributed to the high density of root network and surface little at the top and subsoil layers. This rate was attributed to bio-turbation, which promotes non-structural macro-porosity. This effect has also been reported by Sobieraj et al. [30] in the tropical rainforests. This study also notes that soil depth is not the most important parameter, which has to be considered in studying rainfall-runoff generation.The SCS CN model estimated a higher rate of rainfall-runoff volume generated from the agricultural land use (crop growing) than in the natural land cover types. The results could be supported by poor farming methods that are destabilizing the topsoil surface and properties. The estimated low runoff volume from the natural land cover options could be attributed to the effect of evapotranspiration. However, the estimated runoff volume in the catchment needs to be validated with the field measurements.
5. Conclusions
- The forest cover, cotton and beans land use types exhibited higher rates of soil infiltration thus increased streamflow than in the rice and woodland. The agricultural land use (crop growing) had a high rate of rainfall-runoff generation than areas, which were under forest, and bushlands and thickets. The Curve-Number model estimated a comparatively higher runoff volume generated from the agricultural land use (crop growing) and bushlands and thickets than from the tropical forest. Therefore, assessing this impact in relation to rainfall-runoff generation is important in understanding the soil dynamics that contribute to the increase in the streamflow in the event of precipitation.
ACKNOWLEDGEMENTS
- We are thankful to soil science department, Makerere University for conducting the soil analysis and Busia District local government for facilitating the data collection process.