-
Paper Information
- Paper Submission
-
Journal Information
- About This Journal
- Editorial Board
- Current Issue
- Archive
- Author Guidelines
- Contact Us
Geosciences
p-ISSN: 2163-1697 e-ISSN: 2163-1719
2017; 7(5): 150-155
doi:10.5923/j.geo.20170705.02

Earthquake Hazard and Engineering Determinations for Indonesian Region Using IMS Network Data
 Abstract
 Reference
 Full-Text PDF
 Full-text HTML
D. Shanker1, Sherif M. Ali2, 3, Manisha Singh4
1Indian Institute of Technology Roorkee, Department of Earthquake Engineering, Roorkee, Uttarakhand, India
2Preparatory Commission for the Comprehensive Nuclear-Test-Ban Treaty Organization (CTBTO), Provisional Technical Secretariat, International Data Centre (IDC), Vienna, Austria
3National Research Institute of Astronomy and Geophysics (NRIAG), Helwan, Cairo, Egypt
4Ex-M.Tech. Student Department of Computing Science and Engineering, Galgotias University, Greater Noida, India
Correspondence to: D. Shanker, Indian Institute of Technology Roorkee, Department of Earthquake Engineering, Roorkee, Uttarakhand, India.
| Email: |  |
Copyright © 2017 Scientific & Academic Publishing. All Rights Reserved.
This work is licensed under the Creative Commons Attribution International License (CC BY).
http://creativecommons.org/licenses/by/4.0/

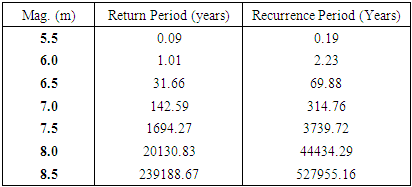
Earthquake hazard and related earthquake engineering determinations usually need estimate of return periods, probabilities of exceedance of specific levels of design load criteria or extremal safety conditions. For these insistences Indonesian region bounded by -14°S–10°N and 93–141°E have been considered for potential earthquake hazard analyses. This region is one of the most seismically Trans-Asian and Circum-Pacific belts type active plate regions of the world where large to great earthquakes have occurred during the past hundred years. Nineteen years recent earthquake data from June 13, 1999 to July 10, 2017 have been taken from International Monitoring System (IMS) Network setup by Comprehensive Nuclear-Test-Ban Treaty Organization (CTBTO), Vienna Austria. The earthquake occurrences agree with the Gumbel’s Type I extreme distribution function and has been applied to analyses those maximum magnitude data with a satisfactory degree of correlation (0.96). The result of analysis has enabled earthquake hazard that exist in Indonesian region to be quantified in terms of recurrence periods and probabilities of occurrence of earthquake of any given magnitude. The line of expected extremes (LEE) which is based on 19 years (1999-2017) of seismicity data of yearly extreme values of earthquakes for the region has been plotted. The medium to large size earthquakes which, expected to occur in this region have been predicted. Study indicates that the most probable largest annual earthquakes are close to 6.0. The most probable earthquake that may occur in an interval of 50 years is estimated as 6.8.
Keywords: Circum-Pacific belts, Trans-Asian, Extremal safety, International Monitoring System (IMS) Network, Line of expected extremes (LEE)
Cite this paper: D. Shanker, Sherif M. Ali, Manisha Singh, Earthquake Hazard and Engineering Determinations for Indonesian Region Using IMS Network Data, Geosciences, Vol. 7 No. 5, 2017, pp. 150-155. doi: 10.5923/j.geo.20170705.02.
Article Outline
1. Introduction
- A main purpose of this work is to demonstrate the usefulness and veracity of extreme value theory when applied to the estimation of earthquake occurrence and risk analyses. Asian Society will not forget, the massive earthquake occurred in 2004 within 150 km of Aceh Province causing damages and many fatalities that followed by a massive tsunami. It increased public and government awareness regarding seismic activities in Indonesia and stimulated several scientists and researchers in earthquake engineering to consider the new conceptual approach to assess the quick potential hazard with limited data set of the region. Assessment of seismic hazard holds a major problem in earthquake engineering. It has long been believed in analysis of seismic risk that it is the extreme or maximum events which are of most interest in day to day life of the people and their environment. Therefore effective engineering solutions are required to meet the challenges in this area regarding earthquakes and its impacts on civil society. There are several validations for adopting extreme value distributions [2-5, 10, 11, 14-16, 18-20, 23, 24]. Thus the use of extreme value now has a lengthy history in several branches of science, including application to the problem of earthquake recurrence estimation. There is the practical consideration in any investigation of seismic risk, firstly, the extreme or maximum events which are of most interest, secondly, and more fundamentally, considerable theoretical justification and knowledge of the behaviour of distributions of extremes. This study would be very helpful for future preparedness planning and even construction practices in the considered area. In practicality, we can estimate the probable return periods of the earthquakes and their probable magnitudes occurrence for which construction industries need at site.
2. Regional Tectonic Characteristics
- Indonesian region (Fig 1) bounded by -14°S–10°N and 93°–141°E, has one of the most highly deformed tectonic domains, which is surrounded by Trans-Asian and Circum-Pacific belts and having prolonged, complex tectonic history [9, 12, 13, 17]. It is where the Eurasian, Indo-Australian, Caroline and Philippine Sea plates converges forming triple junction. This is the region, where processes such as subduction, obduction, slab rollback, rifting, supracrustal extension; lower crustal flow and exhumation are very young or still active [1, 7-9, 12, 17, 22, 25, 26]. Large earthquakes in the eastern Indonesia occur frequently but interpolate megathrust earthquakes related to subduction are rare. This may be due to the disconnection of the descending oceanic slab from the continental margin. In the west, the Sunda convergent margin extends for 5600 km from the Bay of Bengal and Andaman Sea, towards Sumba Island in the southeast and continues eastward as the Banda arc system. This tectonically active margin is a result of the India and Australia plates converging with and subducting beneath the Sunda plate [26]. The main physiographic feature associated with this convergent margin is the Sunda-Java Trench, stretched for 3000 km parallel to the Java and Sumatra land masses and terminates at 120°E. The Java section of the Sunda arc is considered relatively aseismic in comparison to the highly seismically active Sumatra section. Large thrust earthquakes close to the Java trench are typically interplate faulting events of shallow focus and of potential tsunamigenic origin. Taking renewal importance of the region (Fig 1) for frequent occurrence of earthquakes, the estimates of the probability of occurrence of extremes, their return periods and the seismic risk of earthquakes in the region have been investigated.
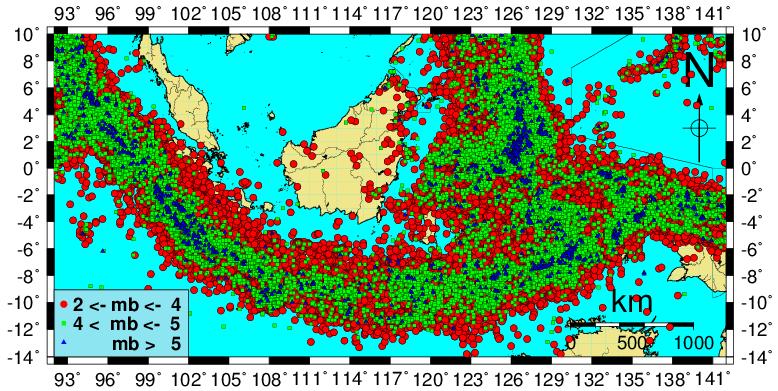 | Figure 1. Seismicity map of the considered region using data recorded by (IMS) from 1999 to 2017 |
3. Seismological Data and Formulation of Analyses
- The occurrence of earthquakes in space and time falls under the general category of stochastic processes, which are, mathematical models of a given physical system change in accordance with the laws of probability [3]. Various statistical models have been proposed to the analysis of earthquake occurrence with different degrees of success [6]. Results thus obtained are often unconvincing because of incompleteness in the data sets or inherent uncertainties in the distributed parameters, which simply ignored. Earthquake occurrence models have usually incorporated the Poisson distribution, or extended to clustering of events using Markovian models of non-independent events. The usual expression linking earthquake magnitudes with their rates of occurrence is due to [6]; log Nm = a - bM. This assumes knowledge of the whole process above a threshold magnitude, with Nm being the annual cumulative number of earthquakes with magnitude equal or greater than M. An obvious weakness in application can be that there is a lack of accuracy, homogeneity and completeness of data sets analysed, particularly in the lower magnitude ranges. Such perturbations mainly arise from the sensitivity and temporal variation of deployed seismograph networks monitoring seismicity. In the present investigation, CTBTO reliable data set have been examined using the largest values to estimate the seismic risk and demonstrate the reliability of the method. It should be borne in mind that the extreme value method has certain clear and obvious advantages as far as the requisite data are concerned when compared with methods requiring the whole data set, which is rarely completely reported. Gumbel’s Type I, which uses extreme value statistics, need only part of the data (the largest earthquakes). This paper utilizes the nineteen years earthquake data from June 13, 1999 to July 10, 2017 with M ≥ 2.0 (Fig 1) for the considered region (-14°S–10°N and 93–141°E) taken from International Monitoring System (IMS) Network setup by Comprehensive Nuclear-Test-Ban Treaty Organization (CTBTO), Vienna Austria. In order to study the earthquake risk, probability of occurrence and return periods, the earthquake data distributed over 19 years has been divide into one year time intervals where at least one event in each year duration is observed, which is necessary condition of the validity of the approach. Gumbel’s [5] formulated the extreme value theory that if the earthquake magnitudes are unlimited, number of earthquakes per year decreases with increasing their sizes, and individual events are unrelated, then the largest annual earthquake magnitude is distributed by cumulative distribution function G(m), where
 | (1) |
 is the average number of earthquakes with magnitude > 0 per year, β is the inverse of the average magnitude of earthquakes under the considered region, and m is the maximum annual earthquake magnitude. The probability integral transformation theorem and manipulation of equation (1) gives the relation:
 | (2) |
 represents the plotting position. The mean frequency of i-th observation in the ordered set of extremes may be represented as
 | (3) |
 and
and  and Gutenberg- Richter parameters a and b can be given by the expression
  | (4) |
 | (5) |
 , in a given year having magnitude exceeding
  can be expressed by the Gutenberg- Richter seismicity relation as
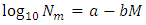 | (6) |
 | (7) |
 occurring within one year is given by the Poisson process as
 | (8) |
 | (9) |
 within t years can be given by the equation
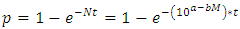 | (10) |
 | (11) |
 | (12) |
4. Results and Discussion
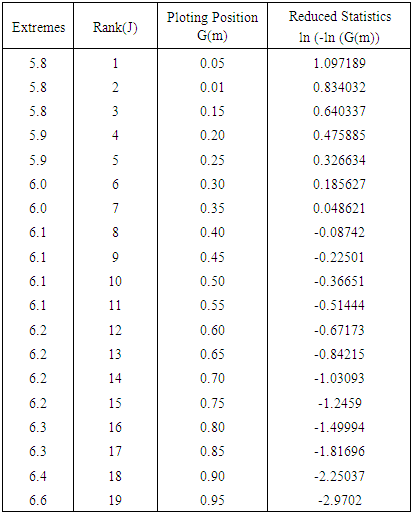
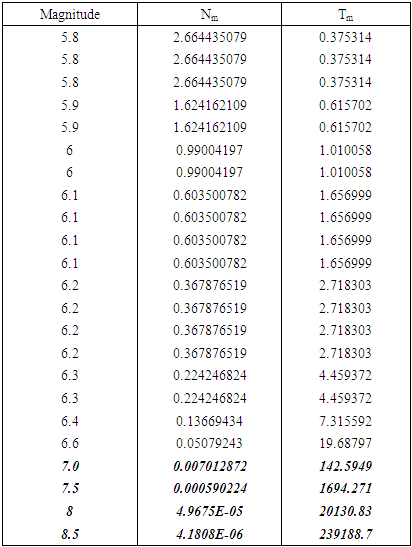
- The annual maximum magnitudes of seismic events recorded in the considered region from the year 1999 to 2017 are shown in Table 1. The events are arranged in rank order, and the values of cumulative frequency probability are calculated using Eq (3). The Extreme Event Type I reduced variant is then calculated as per Eq (2). The obtained results from this process are given in Table 1.
|
 and
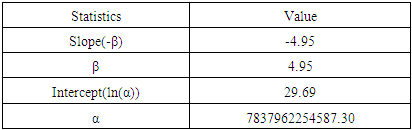
and  are then estimated from a least-square fit to the reduced linear variation equation (Fig. 4) and given in Table 2. Figure 3 demonstrates the mean Line of Expected Extreme (LEE) to study the probability of largest extreme.The variations of maximum magnitude with years shown in Fig 2, indicates that the maximum magnitude increases with time in the considered region.
|
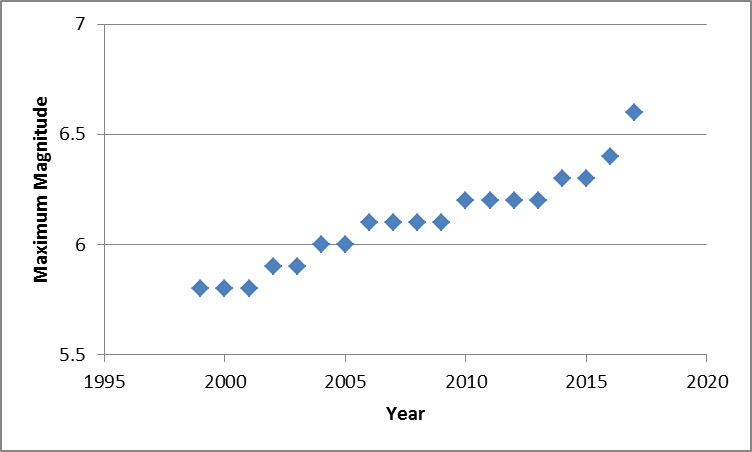 | Figure 2. Variation of maximum magnitude with year |
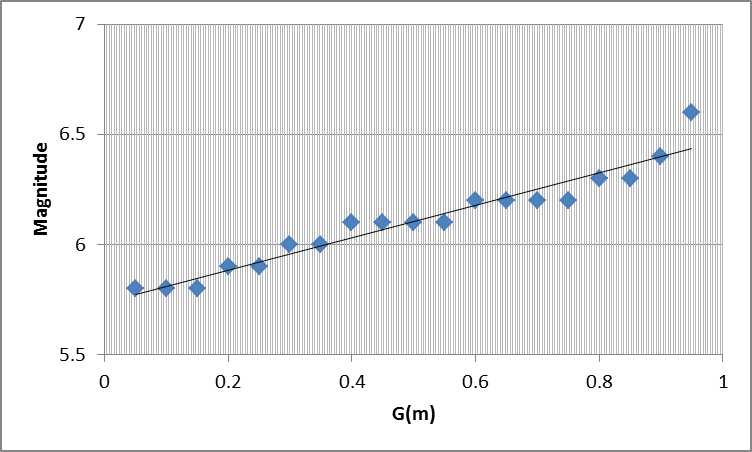 | Figure 3. Variation of extreme magnitude with probability |
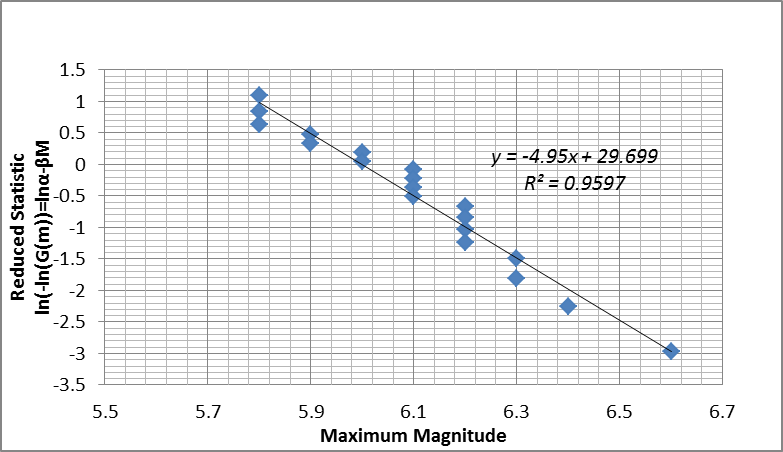 | Figure 4. Display Reduced Variant with extreme magnitudes to estimate α and β using linear regression of data |
|
|
|
|
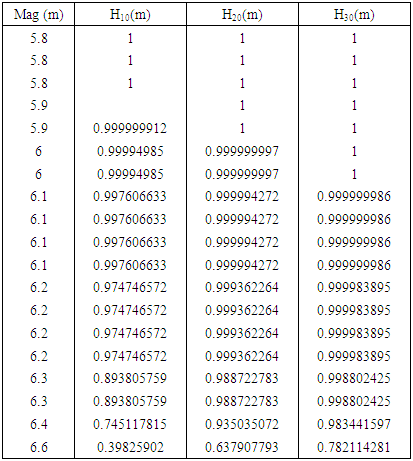
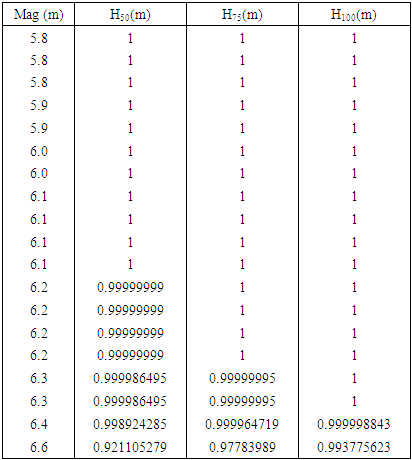
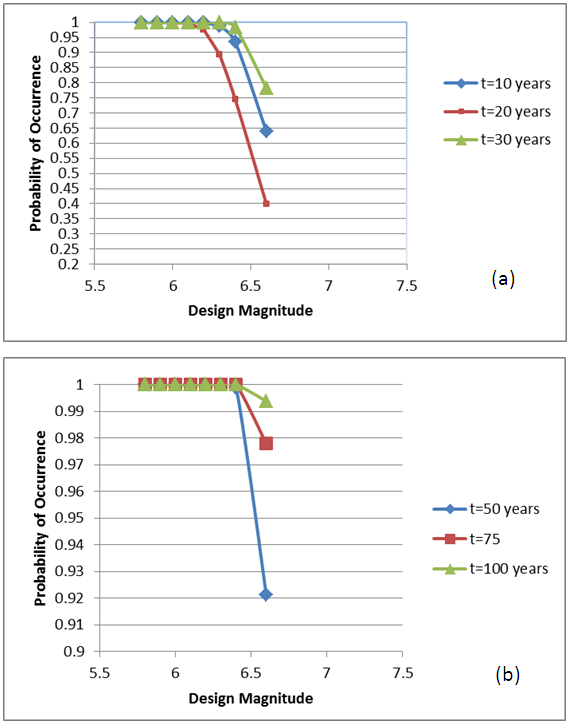 | Figure 5 (a&b). Earthquake hazard in Indonesia region for different period |
ACKNOWLEDGEMENTS
- Authors are thankful to their respective institutes for their cooperation and help to carry out this work. Authors (DS & MS) are also indebted to CTBTO, Vienna Centre for allowing use of IMS data for this study. The results presented and Views expressed in this paper are that of authors only, and may not necessarily be of institutes.